Crossed GRR
Crossed Gage Repeatability and Reproducibility (Crossed GR&R) is a statistical method used to evaluate the variation of measurements taken by different operators using the same measurement instrument, also known as a gauge or gage. The term "crossed" refers to the fact that each operator uses the same set of measurement instruments, rather than each operator using their own set of instruments.
Last reviewed
Key takeaway
Crossed Gage Repeatability and Reproducibility (Crossed GR&R) is a statistical method used to evaluate the variation of measurements taken by different operators using…
On this page
What is Crossed GRR?
Crossed Gage Repeatability and Reproducibility (Crossed GR&R) is a statistical method used to evaluate the variation of measurements taken by different operators using the same measurement instrument, also known as a gauge or gage. The term "crossed" refers to the fact that each operator uses the same set of measurement instruments, rather than each operator using their own set of instruments.
When to use Crossed GRR?
Crossed Gage Repeatability and Reproducibility (R&R) studies are commonly used in manufacturing or quality control settings to evaluate the consistency and accuracy of measurement systems. Specifically, crossed Gage R&R studies are used when there are multiple operators measuring the same parts using multiple gages or instruments.
Here are some situations when you might use a crossed Gage R&R study:
- New measurement system: If you are introducing a new measurement system, a crossed Gage R&R study can help you evaluate its performance and identify any potential sources of measurement error.
- Change in measurement process: If you have made changes to your measurement process, such as using a new gage or instrument, a crossed Gage R&R study can help you determine whether the changes have improved or degraded the measurement system.
- Ongoing quality control: If you need to ensure the accuracy and consistency of your measurement system over time, a crossed Gage R&R study can help you monitor performance and identify any issues that may arise.
Overall, a crossed Gage R&R study can be a valuable tool for identifying sources of variation in your measurement system and improving the overall quality of your manufacturing or quality control processes.
Guidelines for correct usage of Crossed GRR
- Measure parts randomly to avoid influencing the results.
- Use at least 10 parts for an adequate study, but consider using more for a better estimate of process variation.
- Select parts that represent the actual or expected range of process variation.
- Operator and part factors must be crossed and random.
- Operators must measure each part at least twice to estimate repeatability.
- Use at least 3 operators for an adequate study, and ensure they are representative of all operators who use the measurement system.
Alternatives: When not to use Crossed GRR
- If you have nested data, the appropriate method for analyzing your measurement system would be the Nested Gage R&R Study.
- If you have an unbalanced design or additional factors, the Expanded Gage R&R Study would be the suitable method to analyze your measurement system.
Example of Crossed GRR?
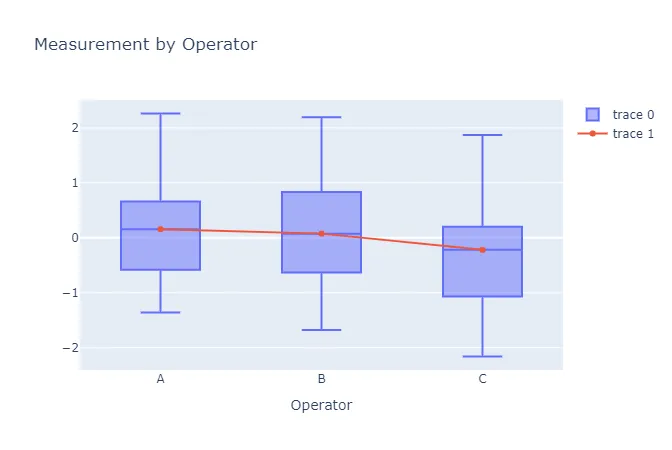
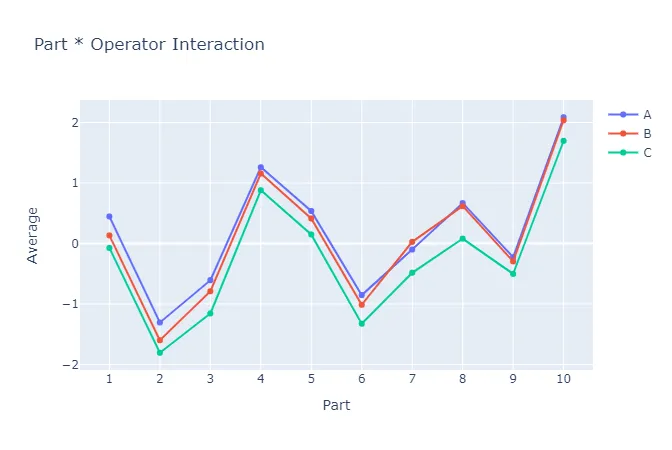
An engineer selects 10 parts that represent the expected range of the process variation. Three operators measure the 10 parts, three times per part, in a random order. The engineer performs a crossed gage R&R study to assess the variability in measurements that may be from the measurement system. She has performed this in following steps:
- She worked all day and gathered the necessary data.
- Now, she analyzes the data with the help of https://qtools.zometric.com/
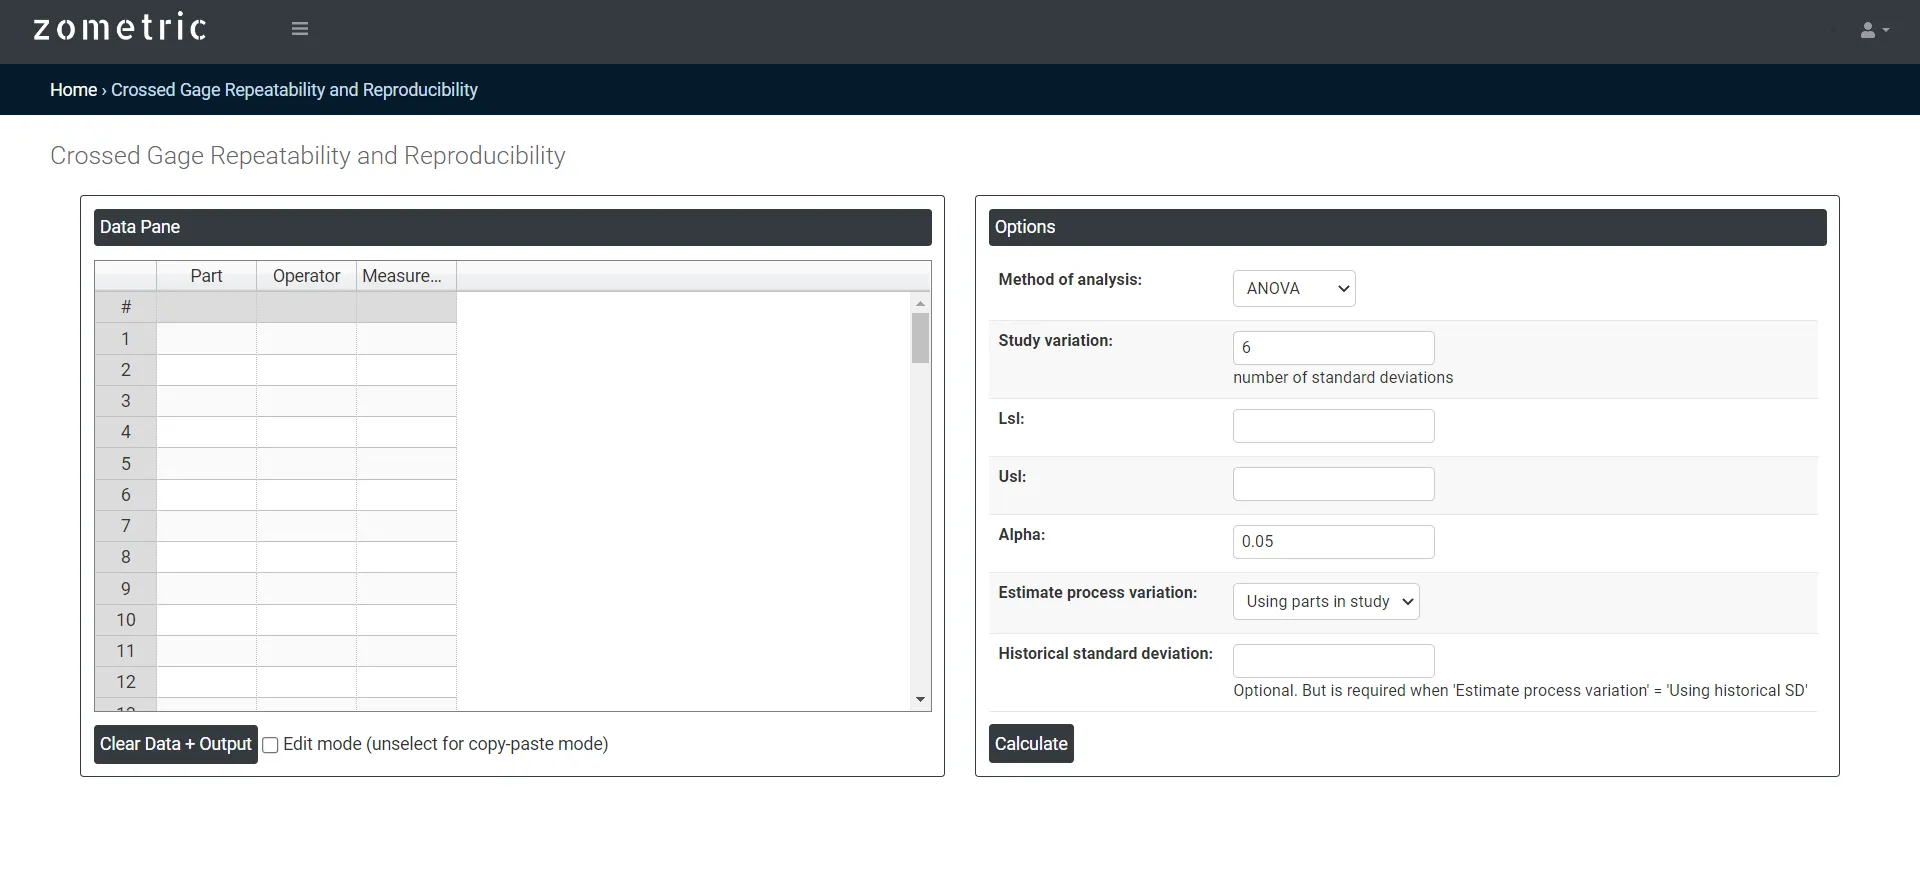
- Inside the tool, she feeds the data. Also, she puts study variation as 6, lsl as -2.16, usl as 2.26 and alpha as 0.05.
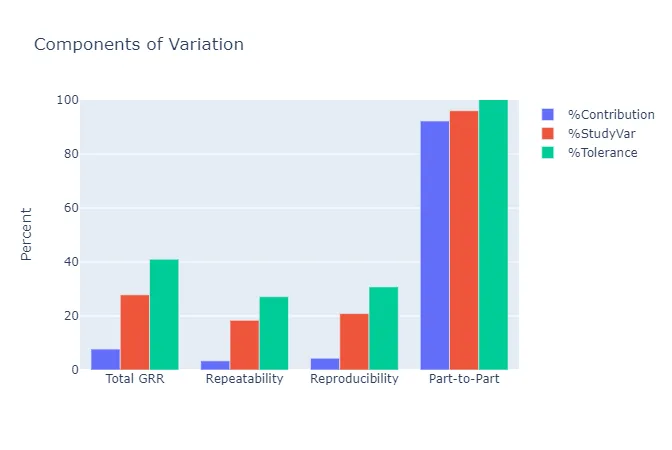
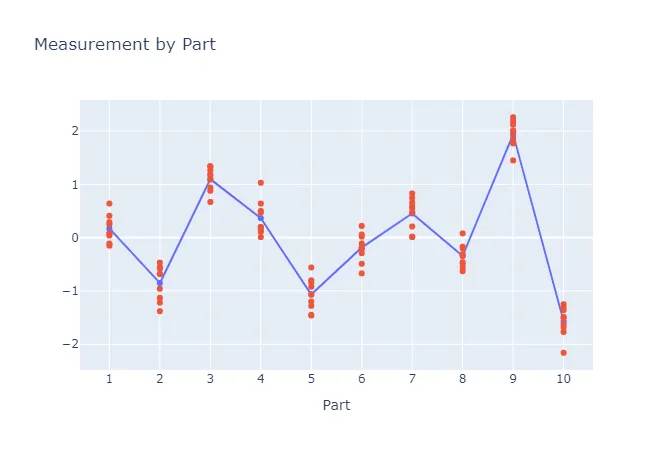
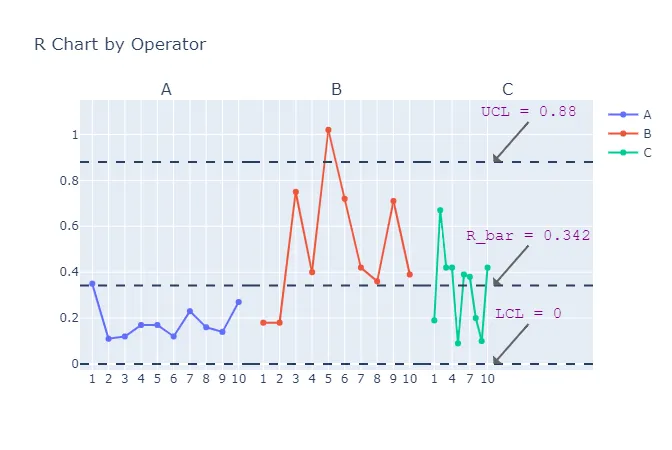
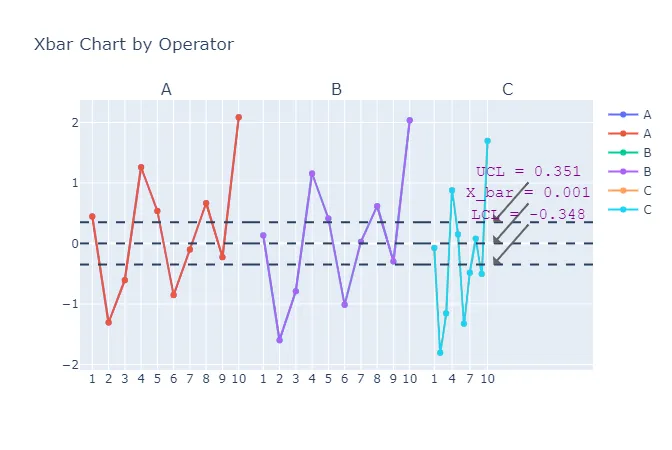
- After using the above mentioned tool, she fetches the output as follows:
How to do Crossed GRR
The guide is as follows:
- Login in to QTools account with the help of https://qtools.zometric.com/
- On the home page, you can see Crossed GRR under Measurement System Analysis.
- Click on Crossed GRR and reach the dashboard.
- Next, update the data manually or can completely copy (Ctrl+C) the data from excel sheet and paste (Ctrl+V) it here.
- Next, you need to put the value of study variation lsl, usl and alpha.
- Finally, click on calculate at the bottom of the page and you will get desired results.
On the dashboard of Crossed GRR, the window is separated into two parts.
On the left part, Data Pane is present. In the Data Pane, each row makes one subgroup. Data can be fed manually or the one can completely copy (Ctrl+C) the data from excel sheet and paste (Ctrl+V) it here.
On the right part, there are many options present as follows:
- Method of Analysis:
- ANOVA: In a crossed GR&R study, multiple operators measure the same parts using different instruments or gages. The data collected from these measurements is then analyzed using ANOVA to identify the sources of variation in the measurement system, including repeatability (variation in measurements taken by the same operator using the same instrument), reproducibility (variation in measurements taken by different operators using the same instrument), and interaction (variation due to the combination of operator and instrument).
- Xbar and R: The Xbar and R method is a commonly used approach for analyzing the results of a Crossed Gage Repeatability and Reproducibility (R&R) study. In this method, measurements are taken using two or more gages by multiple operators, and the repeatability and reproducibility of the gages are assessed.
- Study Variation: The study variation is calculated by taking the square root of the sum of squares of the measurement error (the difference between the measured value and the true value) for each part measured in the study. This value represents the total variation in the measurement system, including the variation due to the gauge, variation due to the parts being measured, and any other sources of variation that may be present.
- Lsl: LSL stands for Lower Specification Limit, which represents the minimum acceptable value for a quality characteristic in a process or product. In the context of a Crossed Gage Repeatability and Reproducibility (R&R) study, LSL refers to the lower specification limit of the measured feature being evaluated.
- Usl: In a Crossed Gage R&R study, USL is the upper limit of the acceptable range for the measurements being taken. It is compared to the observed variation in the measurements to determine whether the measurement system is capable of consistently producing measurements within the acceptable range.
- Alpha: In Crossed GR&R analysis, alpha is typically set to 0.05 or 0.01, which means that we will reject the null hypothesis if the probability of observing the data we have or more extreme data, assuming the null hypothesis is true, is less than 5% or 1%, respectively. This is often referred to as the level of significance.
- Process Variation: Process variation refers to the variation that is inherent in the process or method used to make the measurements. This variation is separate from the variation due to the measurement system itself.