What is Fit Regression Model?
Fit Regression Model is a statistical tool used to examine and quantify the relationship between one or more predictor variables and a continuous response variable. Unlike Fit Line Model which handles only a single predictor, Fit Regression Model supports multiple predictors both continuous and categorical making it more versatile for real-world data analysis.
It builds a mathematical equation through your data that best describes how the predictors collectively influence the response. This equation can then be used to understand patterns, identify significant variables, and predict future outcomes.
Simple Defintion: A tool that finds the best mathematical relationship between multiple input variables and one output variable, so you can understand trends and make accurate predictions.
When to use Fit Regression Model?
A fitted regression model is typically used when there is a need to analyze the relationship between one or more independent variables and a dependent variable. It is a useful tool for predicting and understanding the behavior of a dependent variable based on the values of the independent variables.
Here are some common scenarios where a fitted regression model may be useful:
- Predictive modeling: If you want to predict the value of a dependent variable based on the values of one or more independent variables, a fitted regression model can be useful. For example, you may want to predict the sales of a product based on factors like price, advertising, and customer demographics.
- Relationship analysis: If you want to understand the relationship between a dependent variable and one or more independent variables, a fitted regression model can help. For example, you may want to understand the relationship between income and education level, or between exercise habits and health outcomes.
- Forecasting: If you want to forecast future values of a dependent variable based on historical data, a fitted regression model can be useful. For example, you may want to forecast future sales based on historical sales data and other variables like economic indicators and seasonal trends.
- Predictors can be continuous, categorical, or a combination of both.
- Discrete variables can be treated as continuous or categorical depending on the number of levels and analysis purpose.
- The response variable must be continuous.
- A categorical response is unlikely to meet model assumptions or produce accurate predictions.
In general, a fitted regression model can be useful whenever there is a need to understand or predict the behavior of a dependent variable based on one or more independent variables.
Guidelines for correct usage of Fit Regression Model
- Use a continuous response variable with one or more continuous or categorical predictors; if the response is categorical or count-based, apply the appropriate logistic or Poisson model instead.
- Ensure the data accurately represents the target population; biased or incomplete samples lead to unreliable results.
- Collect sufficient data points to provide the necessary statistical precision and ensure a stable regression model.
- Measure all variables as accurately and precisely as possible; measurement errors directly affect the quality of the fitted model.
- Record data in the order it is collected to help detect any time-based trends or patterns in the residuals.
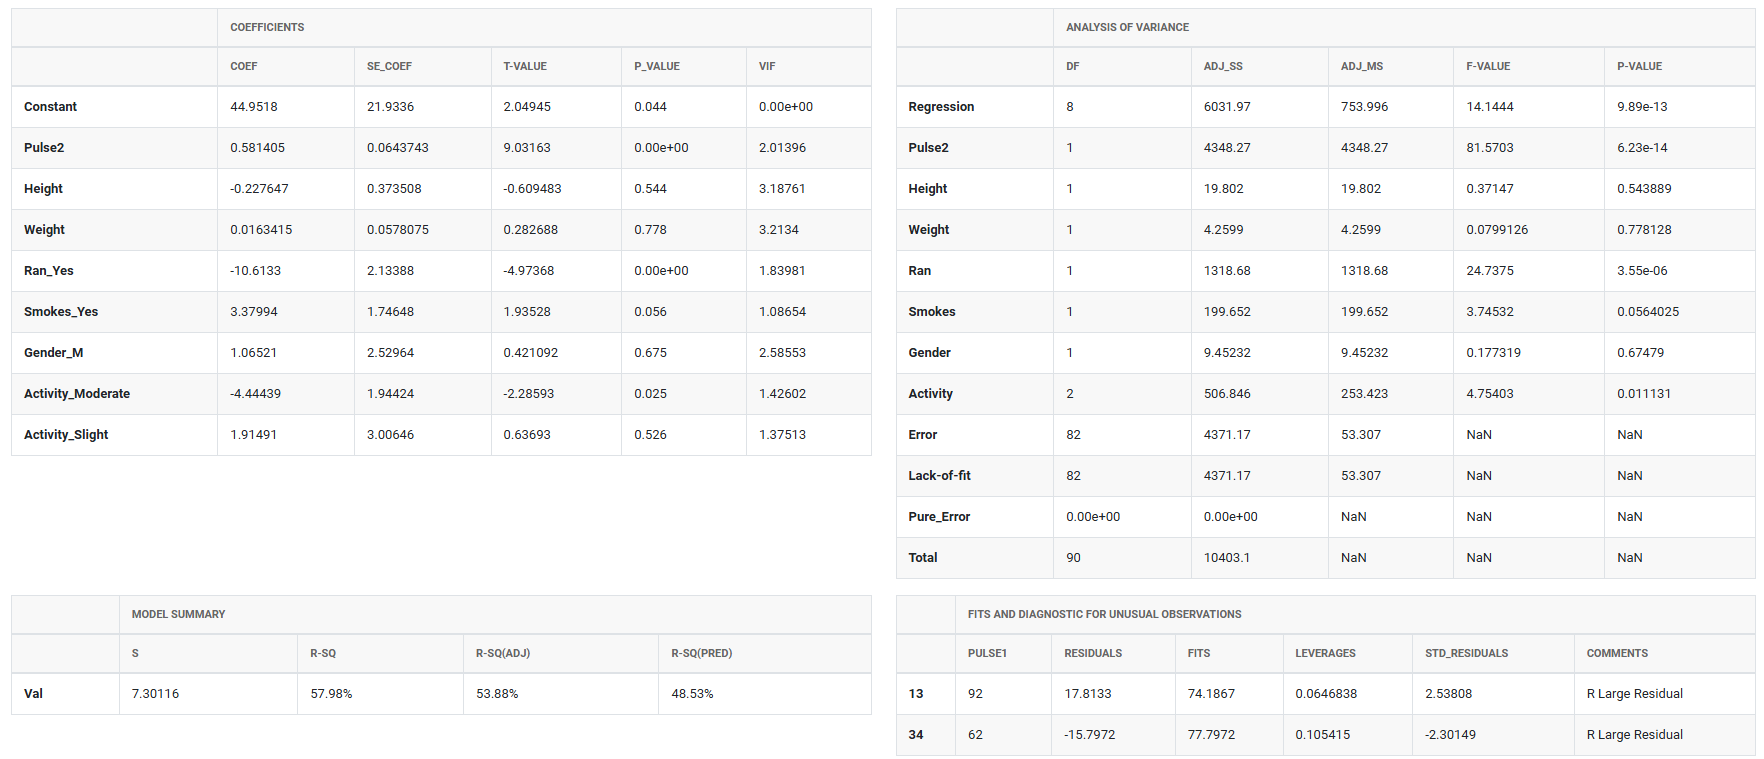
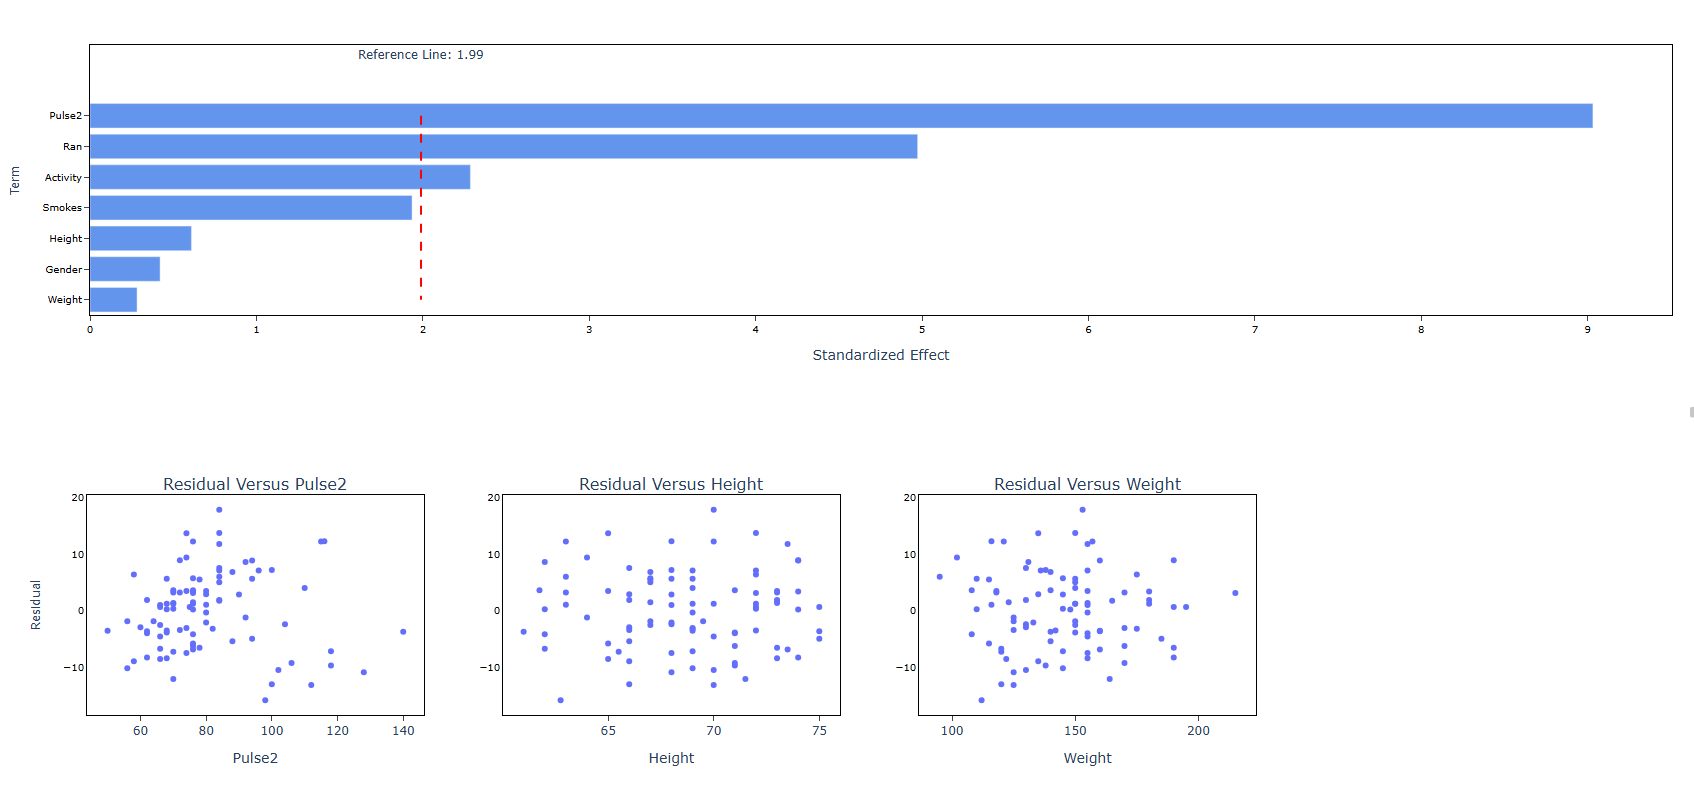
- Check for multicollinearity among predictors — if severe, it becomes difficult to identify which predictors are truly significant. Use Variance Inflation Factors (VIF) in the Coefficients table to assess severity.
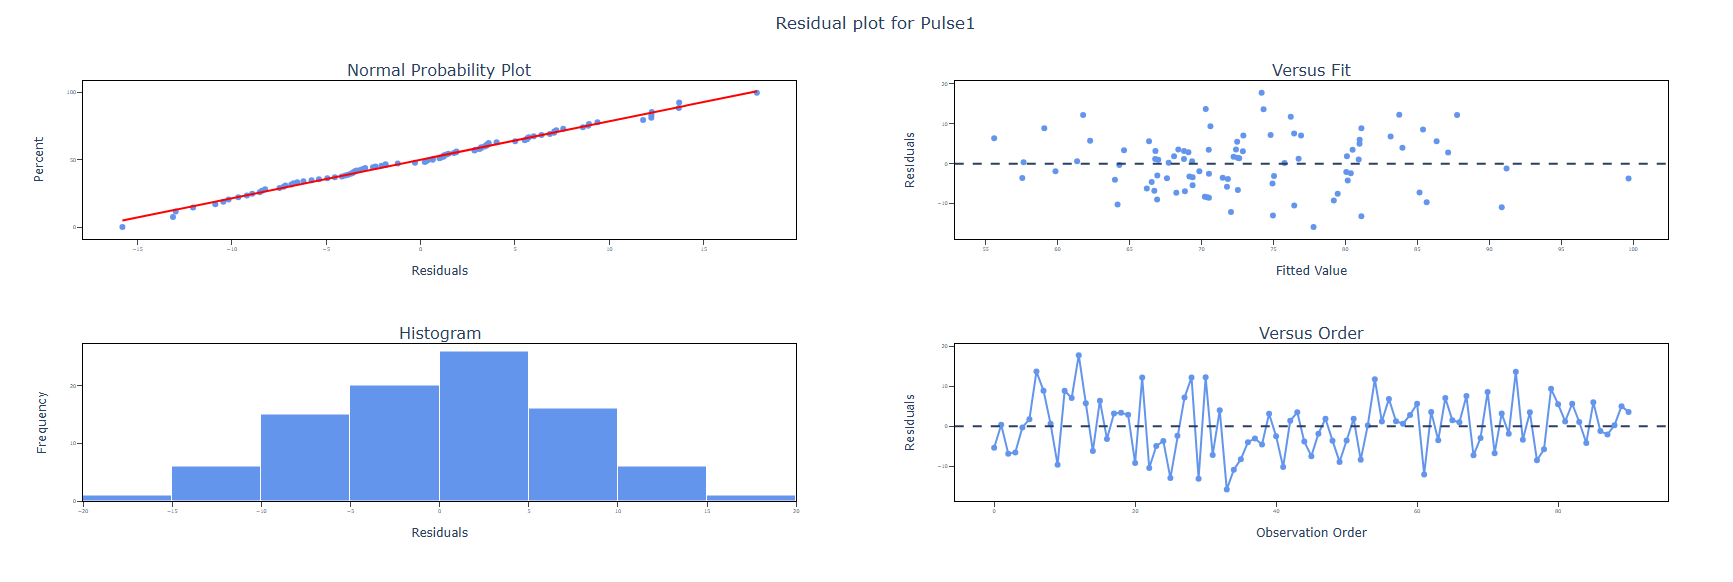
- After fitting, validate the model using residual plots, diagnostic statistics, and model summary statistics; a poor-fitting model can produce misleading conclusions
Alternatives: When not to use Fit Regression Model
- To visualize the relationship between a continuous predictor and a continuous response, use a Fitted Line Plot.
- For a response variable with two categories, use Fit Binary Logistic Model.
- For response variables with three or more categories with a natural order, such as strongly disagree to strongly agree, use Ordinal Logistic Regression.
- For response variables with three or more categories without a natural order, such as scratch, dent, and tear, use Nominal Logistic Regression.
Example of fit regression model?
A medical researcher wants to study the effects of various factors on pulse rates. The researcher records the height, weight, gender, smoking preference, activity level, and resting pulse rate of 91 undergraduate students. The researcher then randomly divides the students into two groups. The first group runs in place for a minute while the other group stands still. Then, the researcher records the students' pulse rates again. The following steps:
- Gathered the necessary data.
- Now analyses the data with the help of https://qtools.zometric.com/ or https://intelliqs.zometric.com/.
- To find Fit Regression Model choose https://intelliqs.zometric.com/> Statistical module> Regression>Fit Regression Model.
- Inside the tool, feed the data along with other inputs as follows:
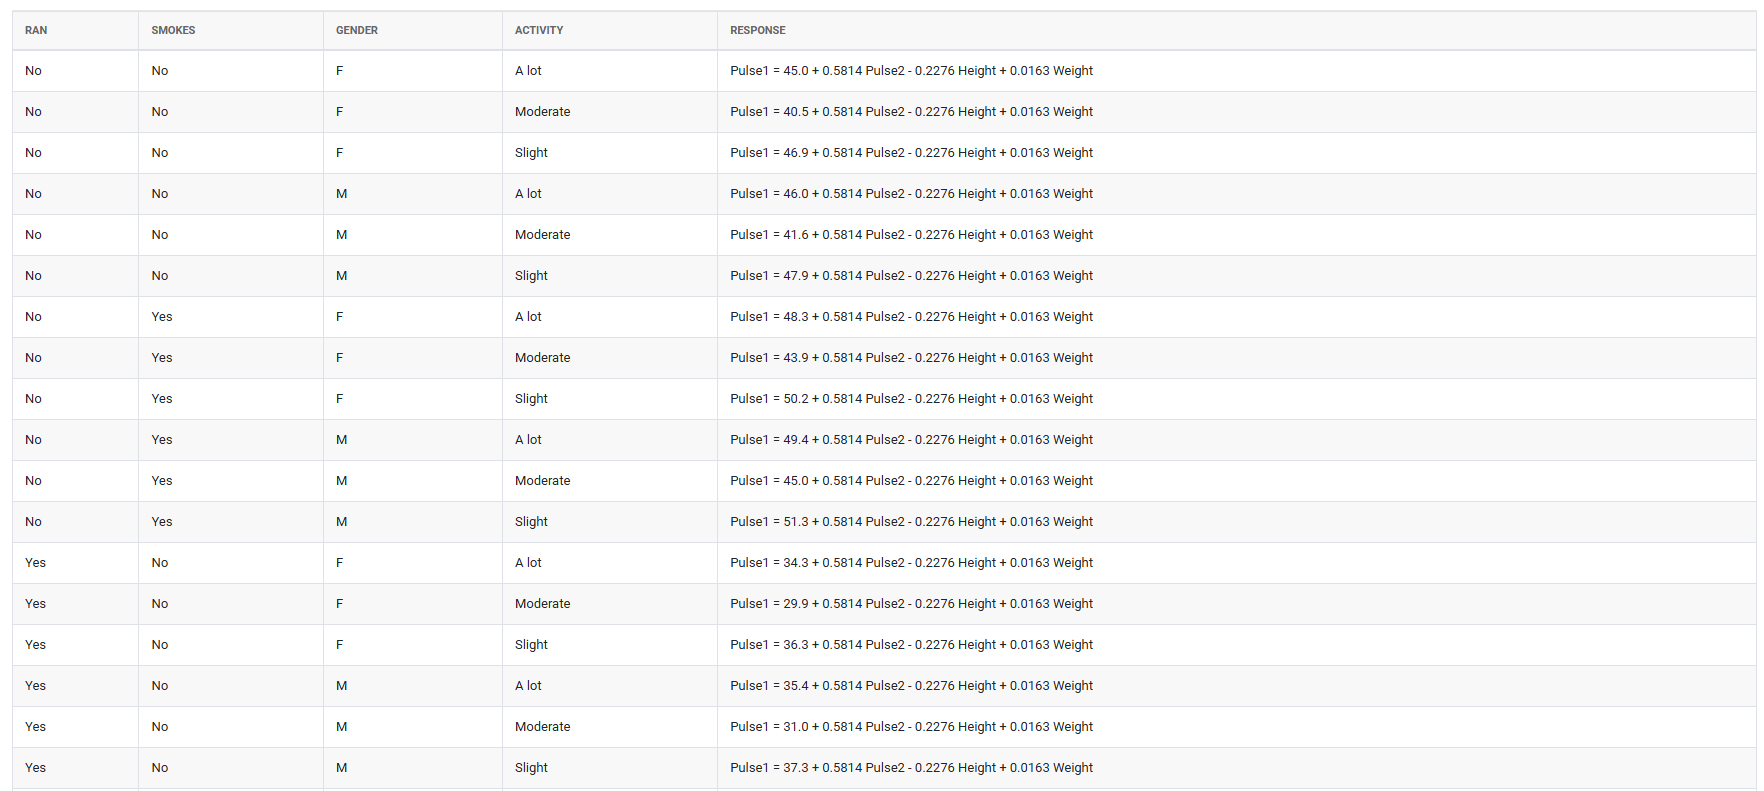
- After using the above mentioned tool, fetches the output as follows
How to do Fit Regression Model
The guide is as follows:
- Login in to QTools account with the help of https://qtools.zometric.com/ or https://intelliqs.zometric.com/
- On the home page, choose Statistical Tool> Regression > Fit Regression Model.
- Next, update the data manually or can completely copy (Ctrl+C) the data from excel sheet or paste (Ctrl+V) it or else there is say option Load Example where the example data will be loaded.
- Next, you need to fill the required options .
- Finally, click on calculate at the bottom of the page and you will get desired results.
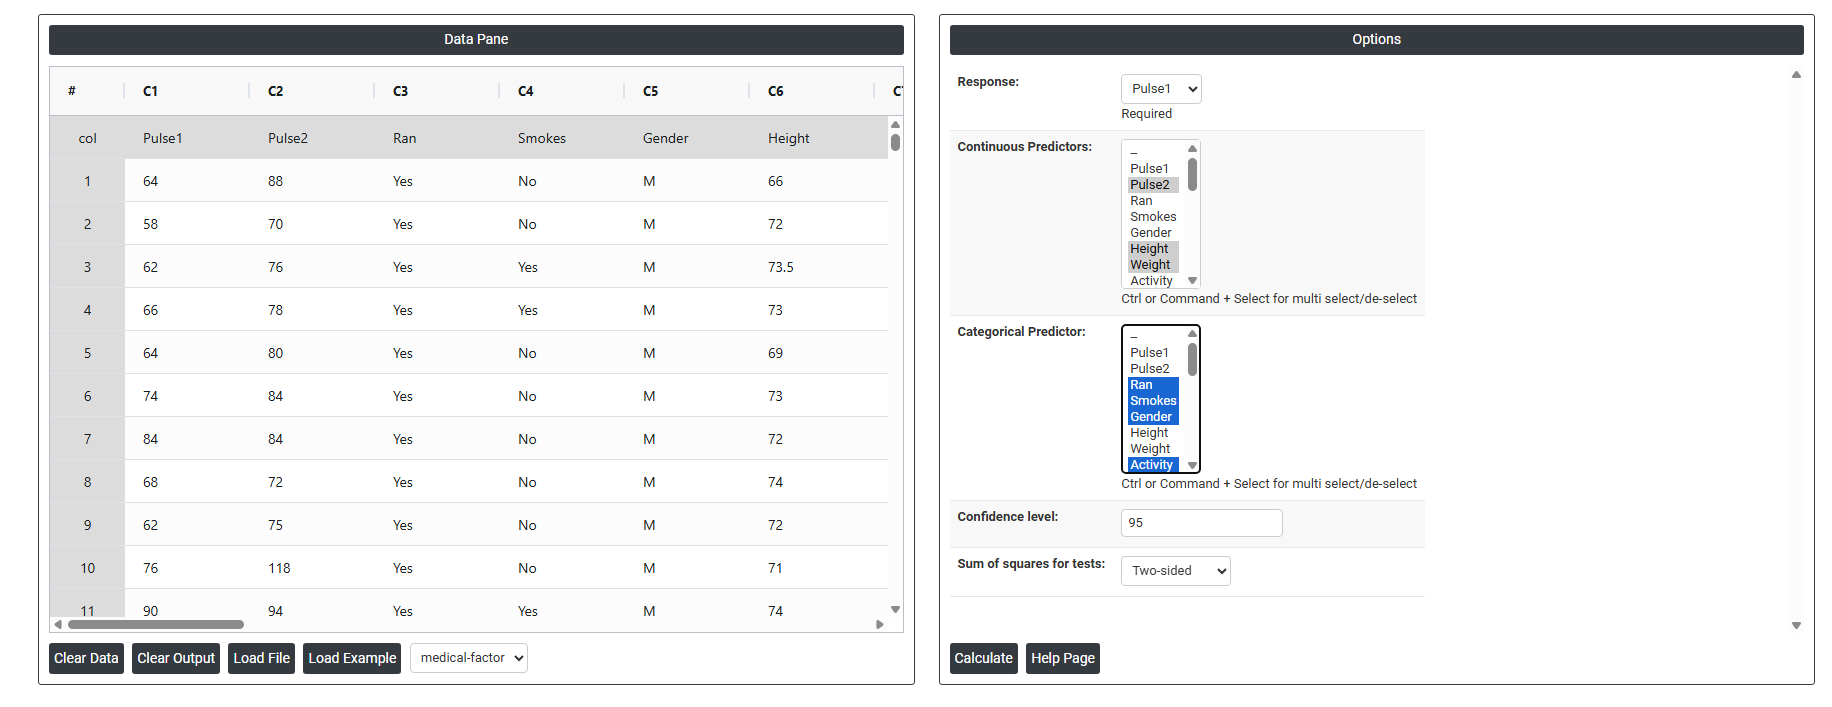
On the dashboard of Fit Regression Model, the window is separated into two parts.
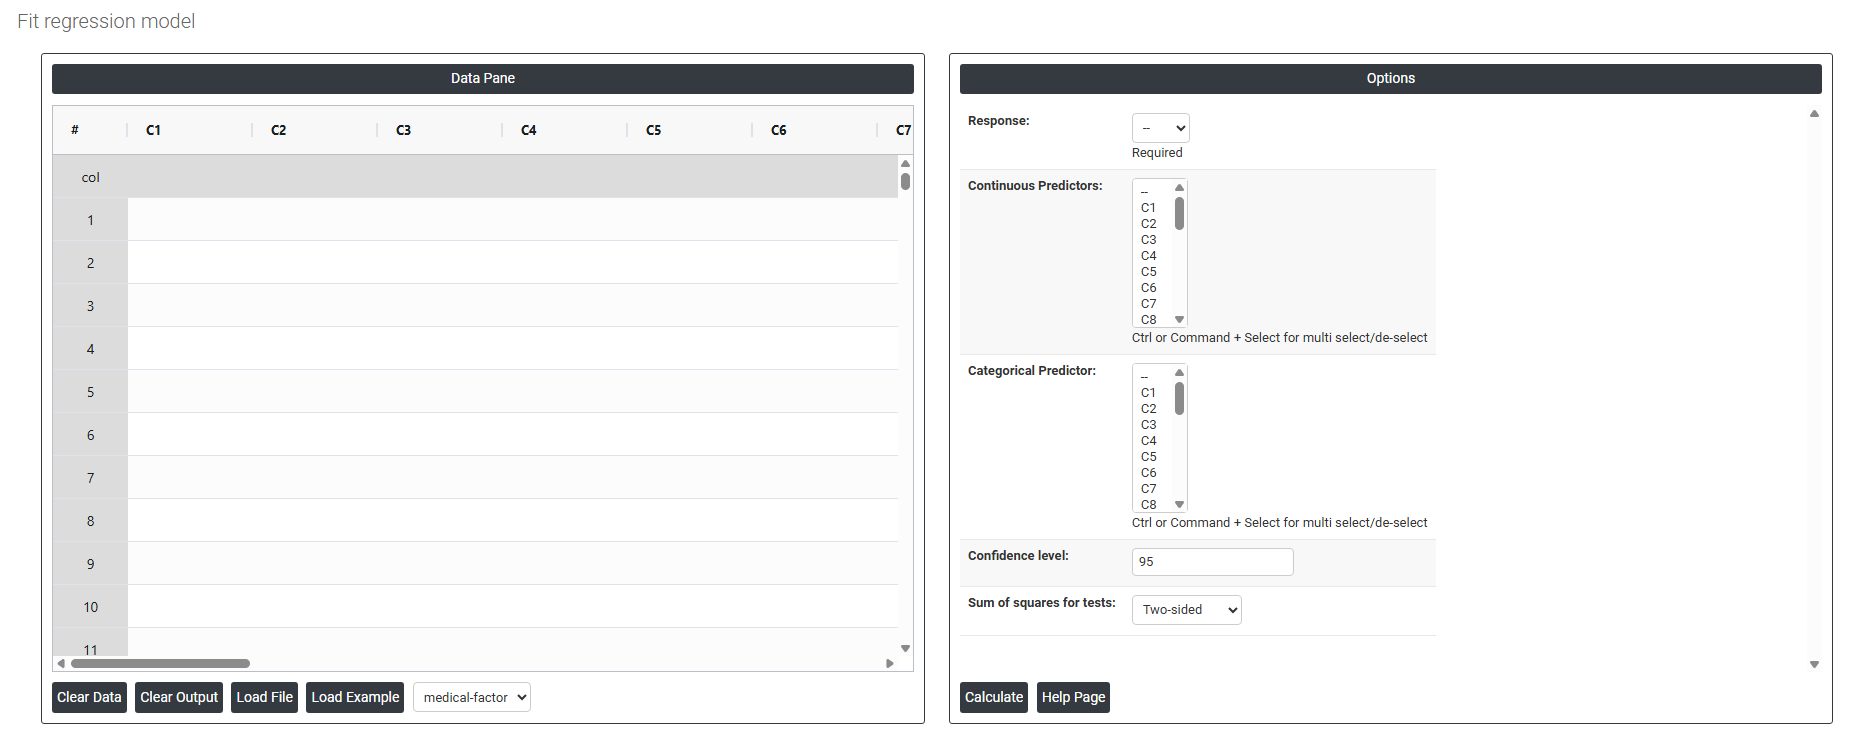
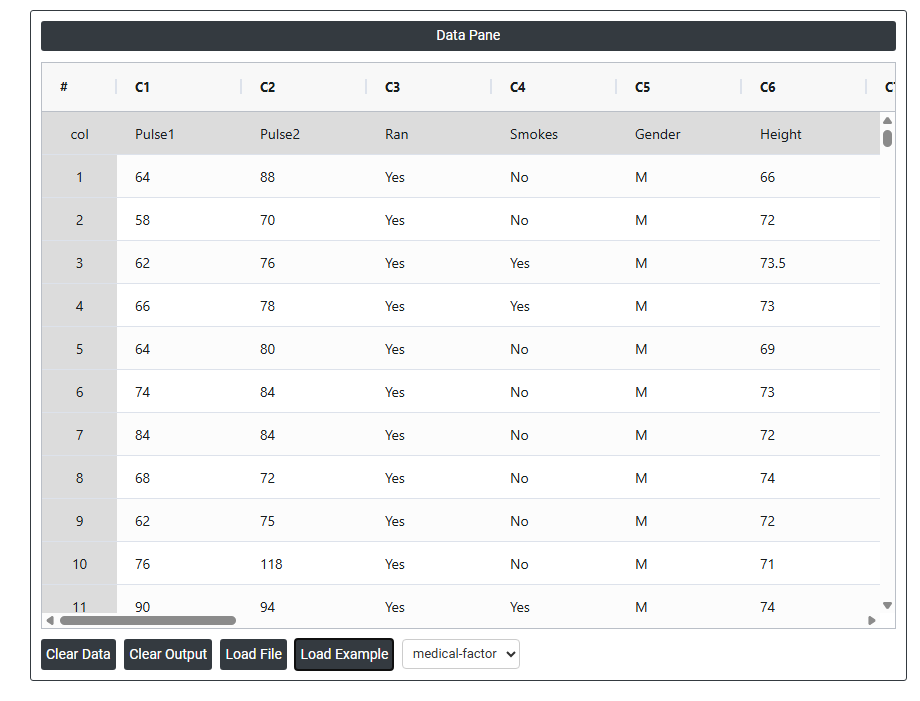
On the left part, Data Pane is present. In the Data Pane, each row makes one subgroup. Data can be fed manually or the one can completely copy (Ctrl+C) the data from excel sheet and paste (Ctrl+V) it here.
Load example: Sample data will be loaded.
Load File: It is used to directly load the excel data.
On the right part, there are many options present as follows:
- Response: In a regression model, the response variable is the variable being predicted or explained by the independent variables or predictors. It is also known as the dependent variable or the target variable. The response variable is the variable that the regression model is trying to estimate or predict based on the values of the independent variables.
- Continuous Predictors: In a regression model, a continuous predictor is a variable that takes on continuous or numeric values, and is used to predict or explain the variation in the response variable. Continuous predictors can take on any value within a certain range or interval, and can have decimal places or fractions.
- Categorical Predictors: In regression analysis, categorical predictors are variables that take on a limited number of discrete values, often referred to as categories or levels. These variables are also known as qualitative or nominal variables, as opposed to quantitative or numerical variables.
- Confidence level: In regression analysis, the confidence level is a measure of the precision and accuracy of the estimated coefficients of the regression model. Specifically, the confidence level refers to the probability that the true population value of a coefficient falls within a certain range of values, given the sample data used to estimate the coefficient. The confidence level is typically expressed as a percentage, and a common value is 95%. This means that if the same regression model were estimated repeatedly using different samples of data, 95% of the time the estimated coefficient would fall within the confidence interval for that coefficient.
- Sum of squares for tests:
- Two sided: The two-sided sum of squares (SS) is a statistical measure used in hypothesis testing for the regression model. It measures the deviation between the observed data and the predicted values based on the regression model. In a regression analysis, the two-sided SS is calculated as the sum of the squared differences between the observed values and the predicted values, for both the explained and unexplained variation in the data. It is called "two-sided" because it considers both positive and negative deviations between the observed and predicted values.
- Lower bound: The lower bound sum of squares for tests in a fitted regression model is typically used in hypothesis testing to determine whether a particular predictor variable has a significant effect on the outcome variable. It is also known as the residual sum of squares (RSS), or the sum of squared errors (SSE).
- Upper bound: The upper bound for the sum of squares in a regression model is determined by the total sum of squares (TSS), which is the sum of the squared differences between the dependent variable and its mean. The sum of squares due to error (SSE) represents the variation in the dependent variable that is not explained by the model. The upper bound for the sum of squares for a particular test can be calculated by dividing the sum of squares due to regression (SSR) by the degrees of freedom (df) for the regression model. This value is known as the mean sum of squares (MSR).