What is One sample proportion test?
A one-sample proportion test is a statistical hypothesis test used to determine whether the proportion of a particular outcome in a single sample differs significantly from a specified population proportion. It is typically used when the data follow a binomial distribution, such as the number of successes in a series of trials or the proportion of defective items in a batch. This test evaluates whether the observed sample proportion deviates from the hypothesized population proportion beyond what might be expected due to random sampling variability.
It compares the observed proportion to a target or reference value and calculates a confidence interval that is likely to include the population proportion. This is also referred to as testing the hypothesis of inequality. The test can use normal approximation or binomial enumeration based on the sample size; normal approximation is more accurate for large sample sizes, while binomial enumeration is more accurate for smaller sample sizes.
When to use One sample proportion test?
One sample proportion test is used when we want to determine whether the proportion of a certain characteristic in a single population differs significantly from a hypothesized value.
- Hypothesized Proportion (P0): Ensure you have a specific hypothesized value for the population proportion to compare against.
- Binary Outcome: The data should be in the form of a binary outcome (e.g., success/failure, yes/no).
- Sample Size:
- Large Sample: If the sample size is large (typically nP0 ≥ 10 and n(1-P0) ≥ 10), use the normal approximation method for the test.
- Small Sample: If the sample size is small, use the binomial enumeration method for more accurate results.
- Random Sampling: The sample should be randomly selected from the population to ensure representativeness and validity of the test results.
- Independence: Each trial or observation in the sample should be independent of the others.
- Proportion Calculation: Calculate the sample proportion (P̂) as the number of successes divided by the total number of trials.
- Test Direction:
- Two-Tailed Test: When you want to test if the sample proportion is significantly different from the hypothesized proportion (P̂ ≠ P0).
- One-Tailed Test: When you want to test if the sample proportion is significantly greater than (P̂ > P0) or less than (P̂ < P0) the hypothesized proportion.
Here are some scenarios where one might use a one sample proportion test:
- A marketing company wants to determine whether the proportion of consumers who prefer their brand over their competitor's brand is higher than a certain value, such as 50%.
- A public health agency wants to determine whether the proportion of people in a certain population who have received a certain vaccine is lower than a certain value, such as 80%.
- An educational institution wants to determine whether the proportion of students who pass a certain exam is higher than a certain value, such as 70%.
In each of these scenarios, a one sample proportion test would be used to determine whether the observed proportion is significantly different from the hypothesized value. This can help in making decisions or drawing conclusions about the population of interest.
Guidelines for correct usage of One sample proportion test
- Random Sampling: Ensure the sample data is selected randomly to make valid generalizations about the population.
- Binary Data: Data must contain only two categories, such as pass/fail or 1/0.
- Independence of Observations: Each observation should be independent from all other observations.
- Appropriate Sample Size: Ensure the sample size is large enough to provide precise estimates, useful confidence intervals, and adequate protection against type II errors.
Alternatives: When not to use One sample proportion test
- When dealing with count data, such as the number of defects in a product, you should use the 1-Sample Poisson Rate test.
Example of One sample proportion test?
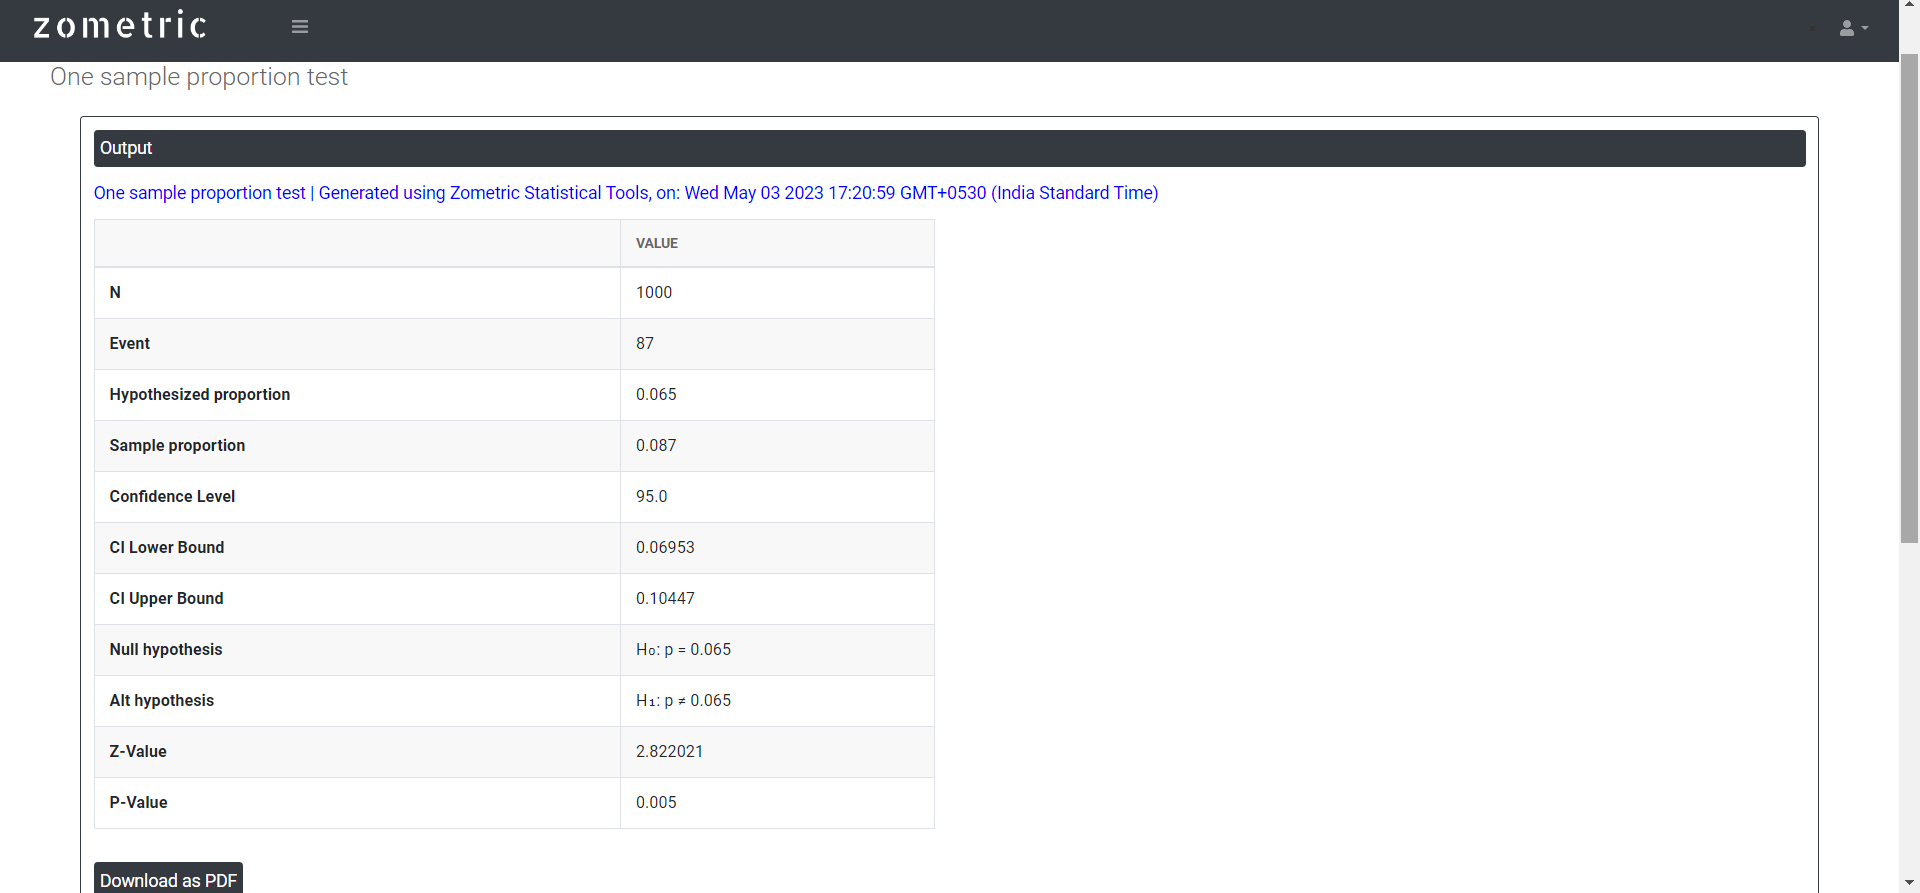
A marketing analyst wants to determine whether mailed advertisements for a new product result in a response rate different from the national average. A random sample of 1000 households is chosen to receive advertisements. Of the 1000 households sampled, 87 make a purchase after receiving the advertisement. The analyst performs a One sample proportion test to determine whether the proportion of households that made a purchase is different from the national average of 6.5%. The following steps:
- Analyzes the data with the help of https://qtools.zometric.com/
- Inside the tool, feeds the data. Put number of events as 87, number of trials as 1000, hypothesized proportion as 0.065 and confidence level as 95.
- After using the above mentioned tool, fetch the output as follows:
How to do One sample proportion test
The guide is as follows:
- Login in to QTools account with the help of https://qtools.zometric.com/or https://intelliqs.zometric.com/
- On the home page, choose Statistical Tool> Graphical analysis >One sample proportion test .
- Click on One sample proportion test and reach the dashboard.
- Next, update the data manually or can completely copy (Ctrl+C) the data from excel sheet and paste (Ctrl+V) it here.
- Next, you need to put the values of number of events, number of trials, hypothesized proportion and confidence level.
- Finally, click on calculate at the bottom of the page and you will get desired results.
On the dashboard of One sample proportion test, the window has only left part.
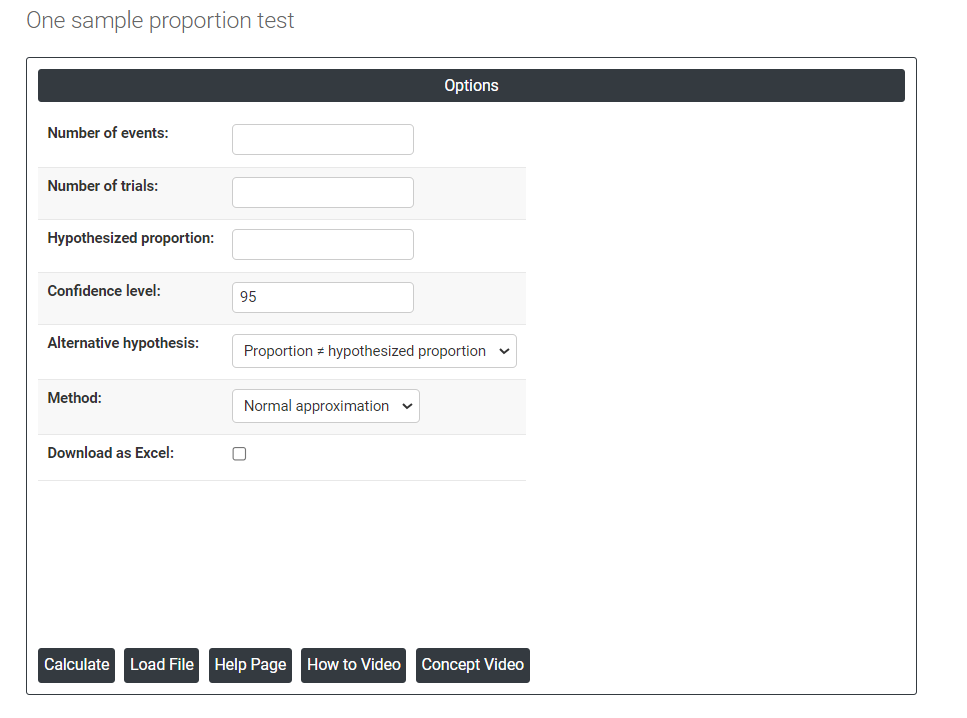
In this left part, there are many options present as follows:
- Number of events: In a one sample proportion test, the number of events refers to the number of occurrences of the event of interest in the sample being analyzed.
- Number of trials: In a one sample proportion test, the number of trials refers to the number of independent, identical trials or observations made on the sample being analyzed.
- Hypothesized proportion: In a one sample proportion test, the hypothesized proportion (also called the null hypothesis proportion) is the proportion that is assumed to be true for the population being tested
- Confidence level: In hypothesis testing, the confidence level represents the degree of certainty or level of confidence that we have in our statistical analysis. It is a probability value that indicates the likelihood that the true population parameter falls within the specified range of values. Typically, the confidence level is expressed as a percentage and is denoted by (1 - α), where α is the level of significance or the probability of rejecting a true null hypothesis. For example, if we have a confidence level of 95%, then we are saying that we are 95% confident that the true population parameter lies within our interval estimate, and there is a 5% chance of making a type I error (rejecting a true null hypothesis). In practical terms, a higher confidence level means that we are more confident in our statistical analysis and results. However, increasing the confidence level also increases the width of the confidence interval, making it more difficult to detect small effects. Therefore, the choice of the confidence level depends on the context of the study and the goals of the researcher.
- Alternative hypothesis: In hypothesis testing, the alternative hypothesis (also called the research hypothesis) is a statement that represents a different conclusion than the null hypothesis. The null hypothesis typically represents the status quo or the assumption that there is no significant difference or relationship between two or more groups or variables. The alternative hypothesis is the statement that is being tested, and it proposes that there is a significant difference or relationship between the groups or variables being studied.
- Normal approximation method: The normal approximation method is a statistical method used in one sample proportion tests to approximate the sampling distribution of the sample proportion as a normal distribution. This method is used when the sample size is sufficiently large (typically, when the sample size n is greater than or equal to 30) and the proportion of successes in the sample is not too close to 0 or 1.
- Load example: Sample data will be loaded.