What is Capability Six Pack (Between/Within)
A Between/Within Capability Sixpack is a summary tool that helps you check if a process is stable and capable when there is big variation between subgroups (such as roll-to-roll, batch-to-batch, or shift-to-shift changes). It shows whether the process is in control, whether the data look normal, and how the process performs compared to the specification limits.
This analysis gives you the key capability indices, such as Cp, Cpk, Pp, and Ppk, and helps you see if the process is centered and meeting requirements.
To run this analysis, you must enter at least one specification limit.
When to use Capability Six Pack (Between/Within)
Use the Capability Sixpack (Between/Within) when you want a quick, visual assessment of process behavior and capability, especially in situations where between-subgroup variation is significant. This tool helps confirm the main assumptions required for capability analysis and provides the primary capability indices.
Use this Sixpack when:
- Your subgroups represent natural process units such as rolls, batches, shifts, machines, lots, or tool setups.
- There is notable variation between subgroups, often caused by machine resets, operator changes, raw-material differences, or shift-to-shift changes.
- You need a quick evaluation of key capability indices (Cp, Cpk, Pp, Ppk) under the assumption of normality.
- You want to verify assumptions before performing a full capability study, including:
• Process stability and control
• Normality of data
• Process centering
• Comparison of process spread vs. specification limits - Use Between/Within Capability Analysis if you need a more complete set of capability metrics.
- Use Non-normal Capability Sixpack if the data are nonnormal and you want to check assumptions for nonnormal capability analysis.
Guidelines for correct usage of Capability Six Pack (Between/Within)
- Use continuous measurement data; attribute counts require a different capability method.
- Collect adequate data, ideally around 100 total observations, for dependable capability estimates.
- Form rational subgroups by sampling items produced under similar conditions in a short time.
- Keep subgroup sizes consistent, as uneven sizes limit how between-subgroup variation is estimated.
- Ensure each subgroup has at least two observations so both within- and between-variation can be calculated.
- Confirm the process is stable and in control before interpreting capability results.
- Verify the data are normally distributed or apply a transformation to support accurate capability indices.
Alternatives: When not to use Capability Six Pack (Between/Within)
- Data are attribute (counts of defects/defectives) → Use Binomial or Poisson Capability Analysis instead.
- Subgroups have only one observation → Between- and within-variation cannot be separated.
- Data are nonnormal and cannot be normalized → Use Nonnormal Capability Sixpack or Nonnormal Capability Analysis.
- Process is unstable or out of control → First fix the process using control charts; capability results won’t be valid.
- Subgroups are not rational (samples collected under different conditions) → Use a capability method that does not rely on subgroup structure.
- Insufficient data are available → Without enough subgroups and observations, the Sixpack cannot provide reliable estimates.
Example of Capability Six Pack (between/within)
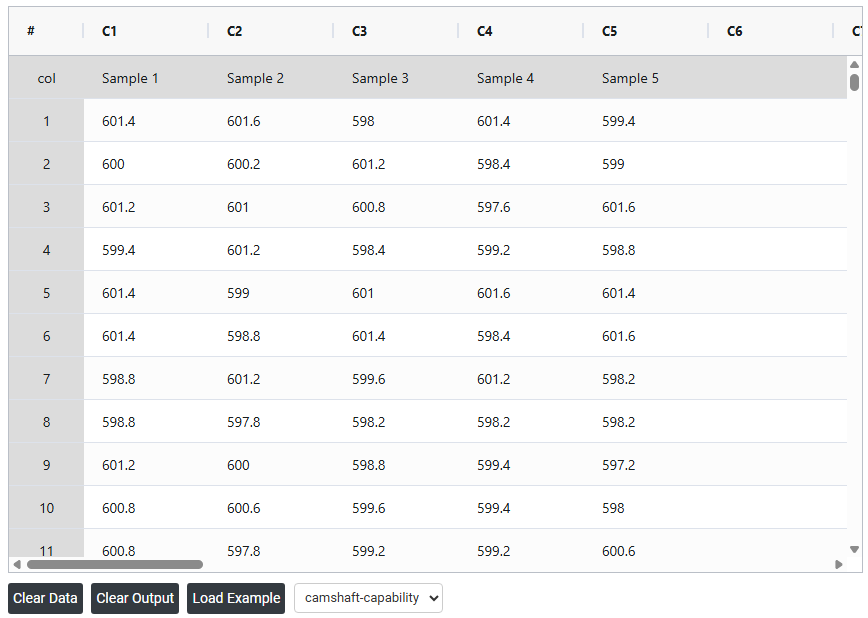
A quality engineer at an automotive parts plant monitors the lengths of camshafts. The engineer collects data in subgroup sizes of 5 every 30 minutes from one of the machines. He is interested in understanding how capable is the manufacturing process in meeting customer specification of LSL = 595, Target = 600 & USL = 605. The following steps:
- Gathered the necessary data.
- Now analyses the data with the help of https://qtools.zometric.com/or https://intelliqs.zometric.com/.
- To find Capability Six Pack (Between/Within) choose https://intelliqs.zometric.com/> Statistical module>Process Capability>Capability Six Pack(Between/Within).
- Inside the tool, feeds the data along with other inputs as follows:
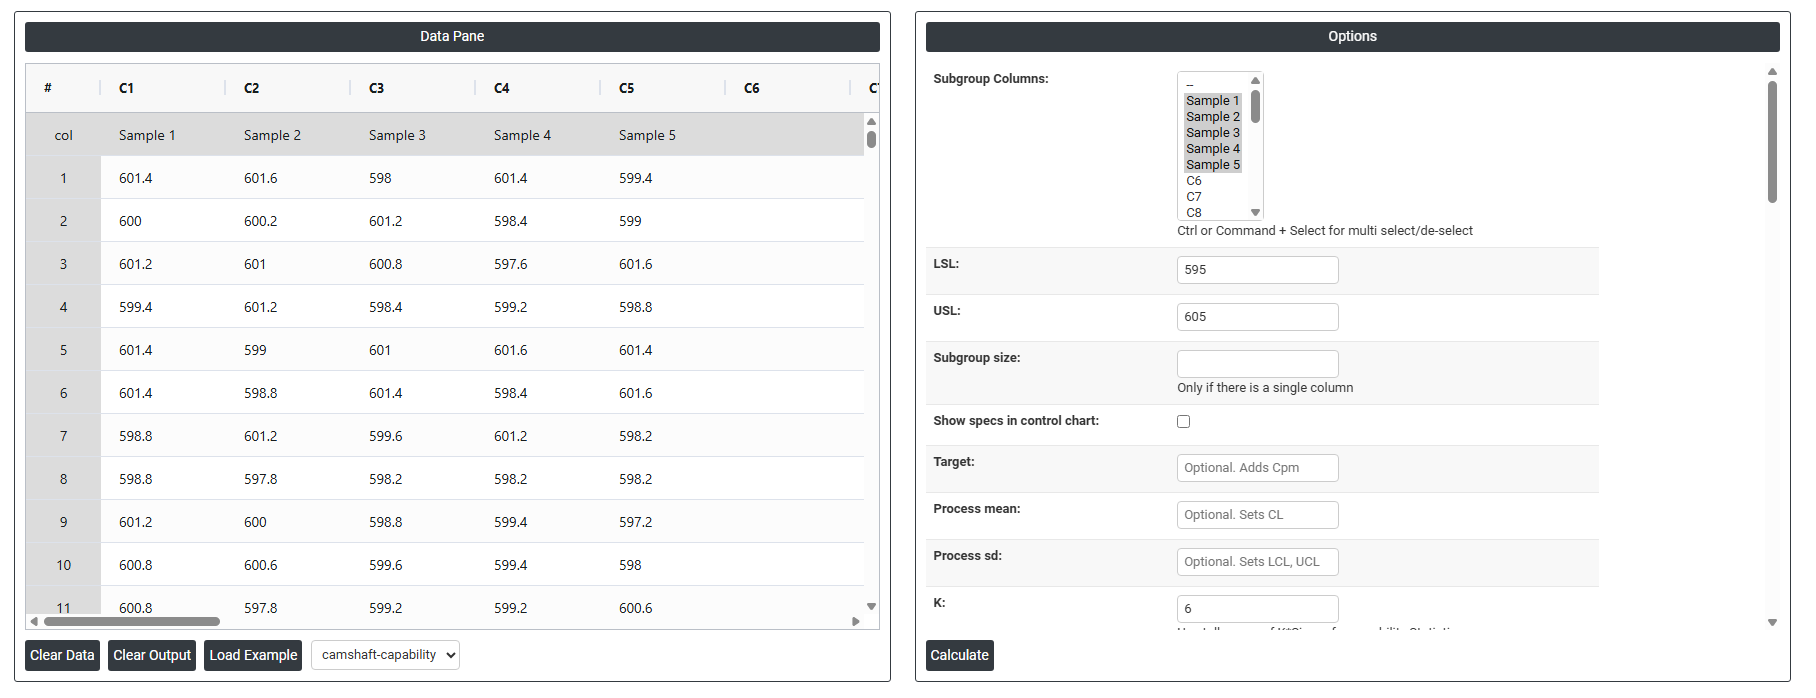
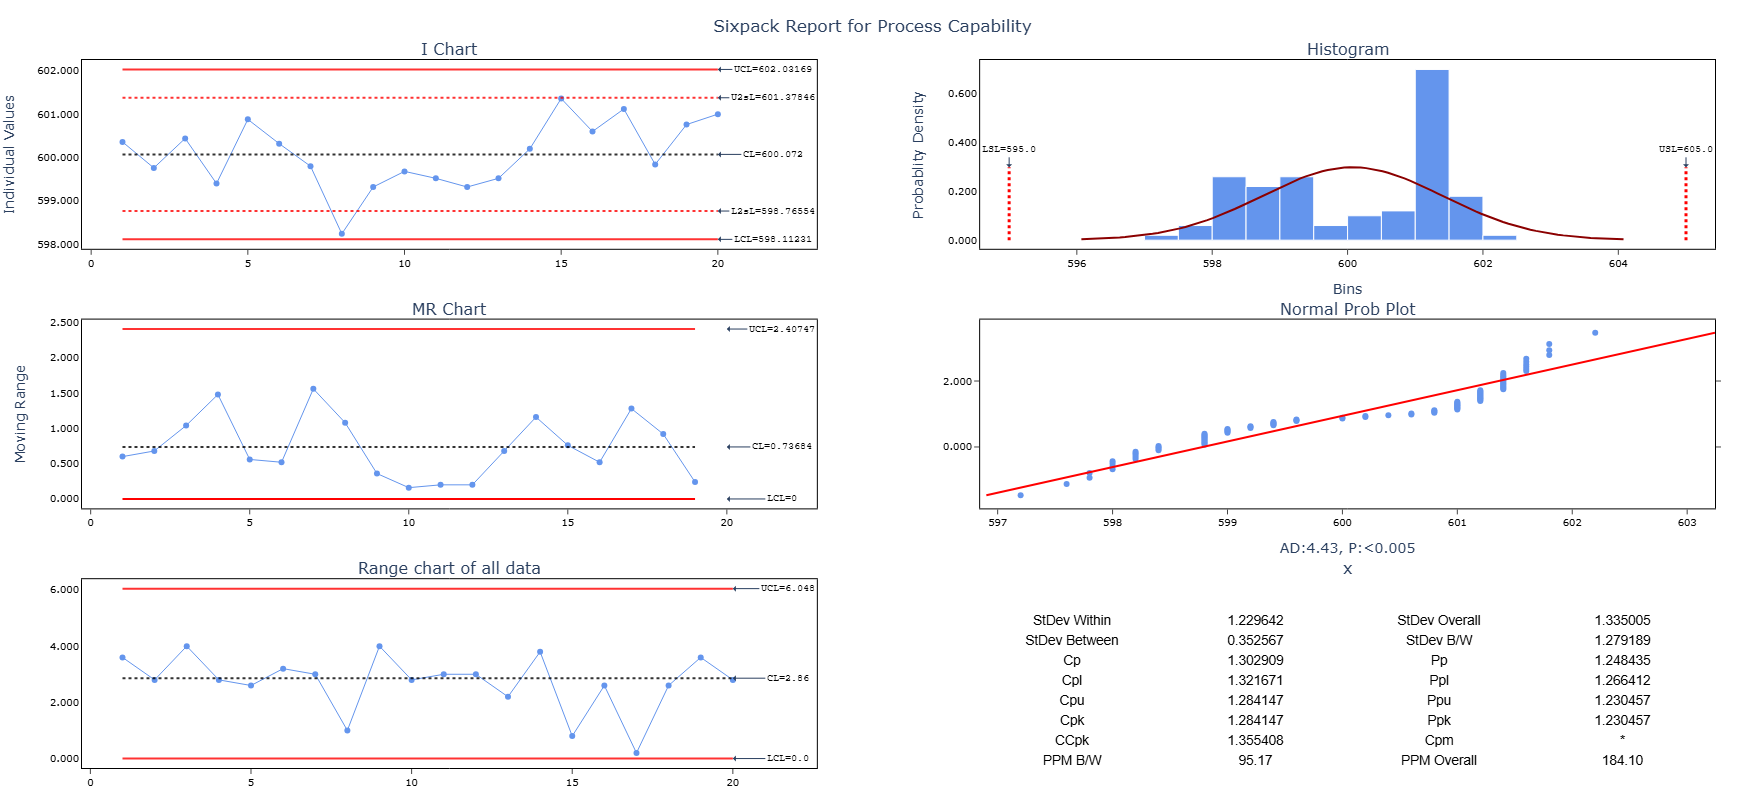
- After using the above mentioned tool, fetches the output as follows:

How to do Capability Six Pack (Between/Within)
The guide is as follows:
- Login in to QTools account with the help of https://qtools.zometric.com/ or https://intelliqs.zometric.com/
- On the home page, choose Statistical Tool> Process Capability >Capability Six Pack (Between/Within) .
- Click on Capability Six Pack (Between/Within) and reach the dashboard.
- Next, update the data manually or can completely copy (Ctrl+C) the data from excel sheet and paste (Ctrl+V) it here.
- Next, you need to fill the desired details such as lsl, usl, target, K, etc.
- Finally, click on calculate at the bottom of the page and you will get desired results.
On the dashboard of Capability Six Pack (Between/Within), the window is separated into two parts.
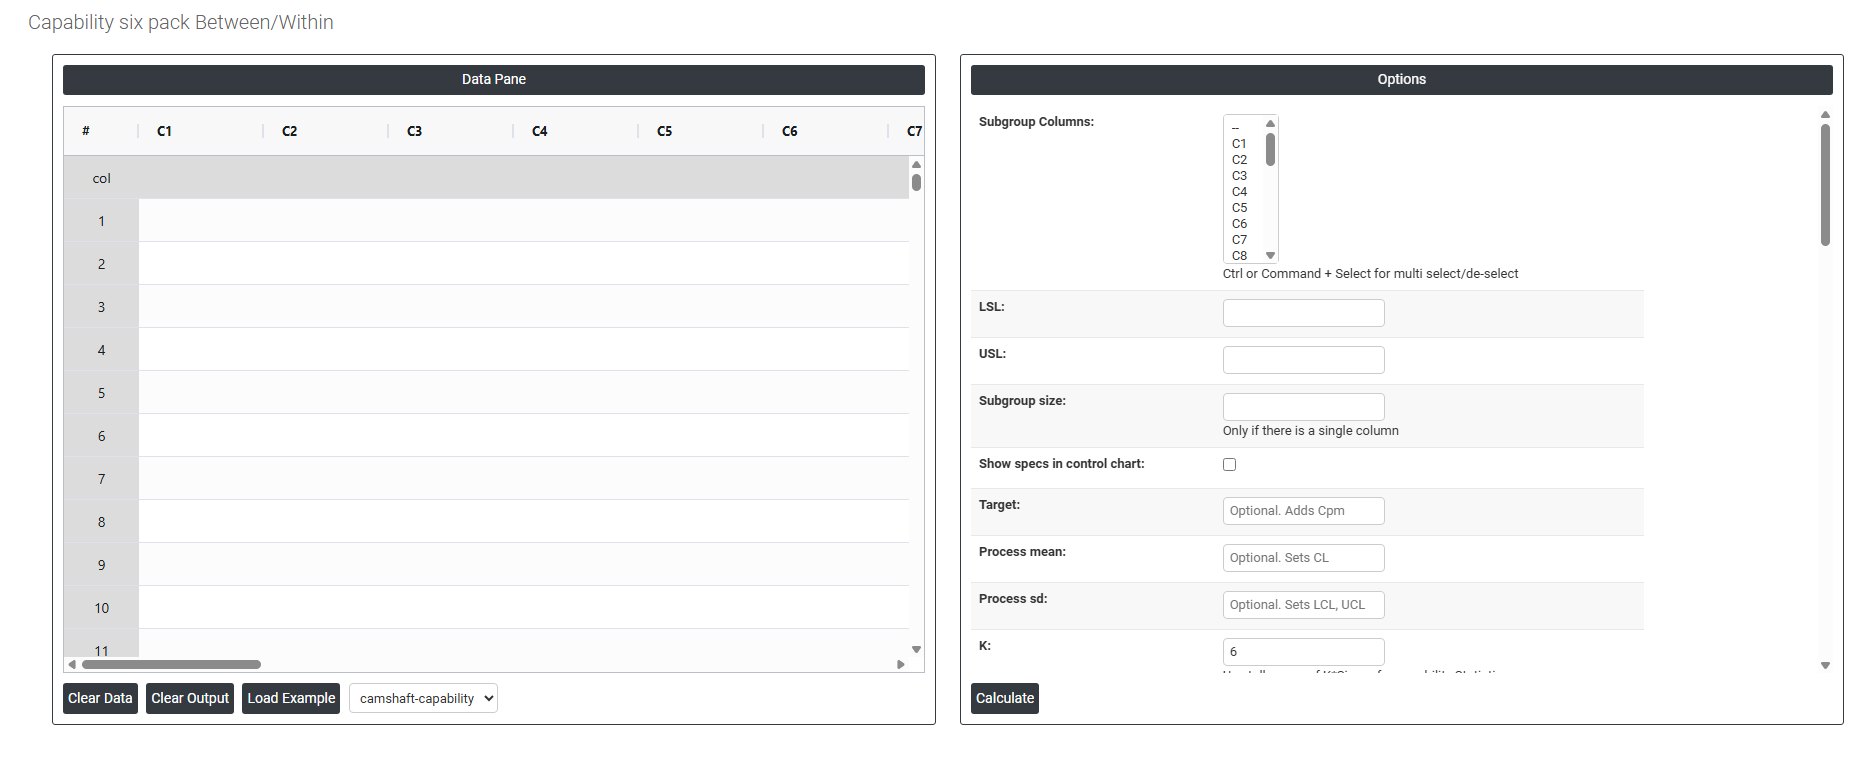
On the left part, Data Pane is present. In the Data Pane, each row makes one subgroup. Data can be fed manually or the one can completely copy (Ctrl+C) the data from excel sheet and paste (Ctrl+V) it here.
Load example: Sample data will be loaded.
Load File: It is used to directly load the excel data.
On the right part, there are many options present as follows:
- Lsl: LSL in process capability refers to the Lower Specification Limit. It is the lower boundary or threshold set for a specific process parameter or characteristic. In process capability analysis, LSL is used to determine whether a process is capable of producing outputs within the desired range or specifications.
- Usl: USL in process capability refers to the Upper Specification Limit. It represents the upper boundary or threshold set for a specific process parameter or characteristic. During process capability analysis, the USL is used to assess whether a process is capable of producing outputs within the desired range or specifications.
- Subgroup Size: When specifying the subgroup size, you can either provide a column that shows which subgroup each measurement belongs to or simply type a number that represents a fixed subgroup size. A between/within analysis requires at least one subgroup that has two or more observations. If all subgroups are the same size, just enter that number (for example, enter 5 if each subgroup has five measurements). If you use a column of subgroup IDs instead, then the subgroups can have different sizes.
- Show specs in control chart: Adding specification limits to the control chart to visualize how process measurements align with quality standards. This helps in assessing whether the process remains within acceptable ranges.
- Target: In process capability, the target refers to the desired or ideal value for a specific process parameter or characteristic. It represents the value that the process is intended to achieve or center around. The target is often based on design specifications or customer requirements.
- Process mean: It is the average value of a set of measurements or observations from a process. It represents the central tendency of the process data over time and is a key indicator of the process performance. If not, Zometric Q-Tools calculates the centerline from the data provided.
- Process sd: It is a measure of the variability or dispersion of the process data around the mean. It provides an indication of how much individual data points within the process differ from the process average. If not, Zometric Q-Tools calculates from the data provided.
- K: In process capability, K refers to the process capability index known as the "Process Capability Index for Non-Centered Distribution" or simply the K-index. It is used to evaluate the capability of a process in relation to the specification limits.
- Within Stdev estimation method:
- Pooled: The pooled standard deviation is the weighted average of subgroup variances, with larger subgroups having a greater impact on the overall estimate. This method offers a more accurate estimate of the standard deviation when the process is stable.
- Rbar: Rbar represents the average of the ranges within subgroups. The Rbar method is a widely used estimate of the standard deviation, particularly effective for subgroup sizes ranging from 2 to 8.
- Sbar:It calculates the average standard deviation (Sbar) of subgroups to monitor process variability. Sbar is crucial for setting control limits on the S chart, indicating changes in data dispersion over time. This method ensures consistent and accurate assessment of process variation in quality control practices.
- Within stdev estimation method for subgroup size = 1:
- Average Moving Range: The average moving range is the mean value of the range of two or more consecutive points, typically used when the subgroup size is 1.
- Median Moving Range: The median moving range is the middle value of the range of two or more consecutive points, recommended when data have extreme ranges that could skew the moving range.
- Moving range of length: Specify the number of observations used to compute the moving range, with the length being ≤ 100. The default length is 2, as consecutive values are most likely to be similar.
- Use Unbiasing Constants to Calculate Overall Standard Deviation: Apply unbiasing constants in estimating the overall standard deviation.
- Machine: The specific equipment or machinery being evaluated in the capability study. Example: Drilling machine, forging machine.
- Reported by: The person who documents the results of the capability study.
- Prepared by: The individual who compiles and organizes the data for the report.
- Verified by: The person who checks the accuracy of the compiled data and findings.
- Approved by: The individual who authorizes the final report for distribution or use.
- Remarks: Additional notes or observations relevant to the study that may affect interpretation.
- Shift: The work shift during which the study was performed, indicating timing and possible shift-specific variables.
- Operation: The specific process or machine being assessed in the study.
- Company name: The organization conducting the capability study.
- Report title: The title summarizing the focus or purpose of the capability study.
- Customer name: The client or customer for whom the capability study was conducted.
- Part: The component or product name or number being manufactured by the machine.
- Variable: The specific characteristic or dimension of the part being measured. Example: Diameter, length, width.
- Unit of Measure: The units used to quantify the variable being measured. Example: Millimeters (mm), inches (in).
- Study date: The date on which the machine capability study was conducted.
- Operator: The name of the machine being operated.
- Inspector: The name of the tool or instrument used for measuring. Example: "Micrometer Model Y."
- Gauge: The measurement instrument or tool used to assess the variable. Example: Caliper, micrometer.
- Check Rule 1: 1 point > K Stdev from center line: Test 1 is essential for identifying subgroups that significantly deviate from others, making it a universally recognized tool for detecting out-of-control situations. To increase sensitivity and detect smaller shifts in the process, Test 2 can be used in conjunction with Test 1, enhancing the effectiveness of control charts.
- Check Rule 2: K points in a row on same side of center line: Test 2 detects changes in process centering or variation. When monitoring for small shifts in the process, Test 2 can be used in conjunction with Test 1 to enhance the sensitivity of control charts.
- Check Rule 3: K points in a row, all increasing or all decreasing: Test 3 is designed to identify trends within a process. This test specifically looks for an extended sequence of consecutive data points that consistently increase or decrease in value, signaling a potential underlying trend in the process behavior.
- Check Rule 4: K points in a row, alternating up and down: Test 4 is designed to identify systematic variations within a process. Ideally, the pattern of variation in a process should be random. However, if a point fails Test 4, it may indicate that the variation is not random but instead follows a predictable pattern.
- Check Rule 5: K out of K + 1 points > 2 standard deviation from center line (same side): Test 5 detects small shifts in the process.
- Check Rule 6: K out of K + 1 points > 1 standard deviation from center line (same side):Test 6 detects small shifts in the process.
- Check Rule 7: K points in a row within 1 standard deviation of center line (either side):Test 7 identifies patterns of variation that may be incorrectly interpreted as evidence of good control. This test detects overly wide control limits, which are often a result of stratified data. Stratified data occur when there is a systematic source of variation within each subgroup, causing the control limits to appear broader than they should be.
- Check Rule 8: K points in a row > 1 standard deviation from center line (either side):Test 8 detects a mixture pattern. In a mixture pattern, the points tend to fall away from the center line and instead fall near the control limits.