Why the problem of excess give away exists?
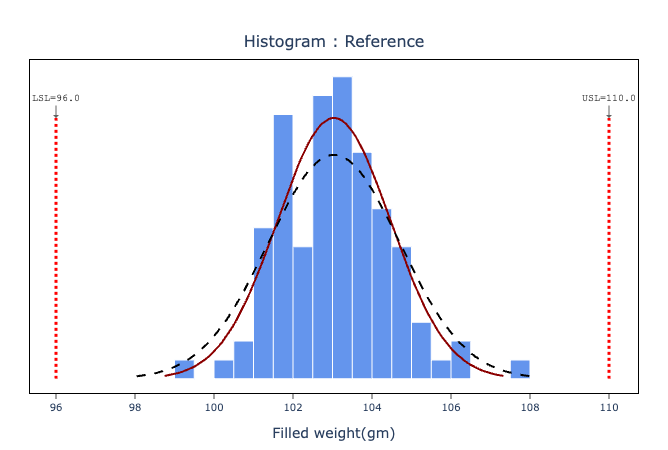
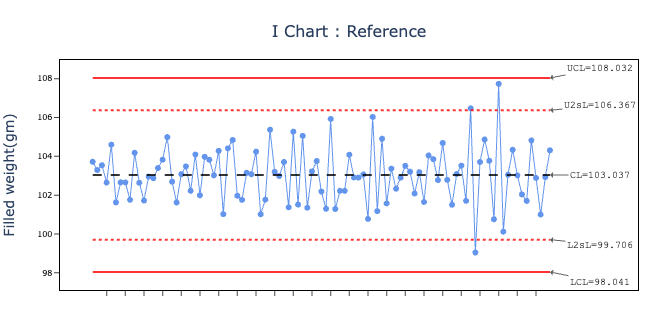
A manufacturer producing consumer goods faced significant challenges in maintaining consistent net content due to process variability. This led to excess giveaway, and a project was taken up to reduce the cost of the SKU. The raw material cost was approximately INR 50 per kg. To ensure compliance with the Legal Metrology Act—which mandates adherence to T1 and T2 limits—the company had been maintaining an inflated average net content of 103 gm, on a declared net weight of 100 gm in one of its SKUs.
The need for this higher average arose due to:
- Higher Process Variation introduced by manual or guesswork-based adjustments.
- Compliance Risks: Avoid breaching the following legal limits:
- T1 Limit: Average of the sample ≥ Declared Quantity - MPE.
- T2 Limit: No individual package < Declared Quantity - 2 × MPE.
- MEP stands for the Maximum Permissible Error as per published standards
With a declared quantity of 100 gm, this translated to:
- T1 Lower Limit = 98 gm
- T2 Lower Limit = 96 gm
Maintaining an average of 103g led to excessive product giveaway, resulting in unnecessary cost burdens.
Quantifying the excess give away in terms of money
The company had to overfill each package to offset process instability. Key issues included:
- Overfilling: On average, each package contained 3g more than the declared 100g.
- Cost of Giveaway: At INR 50 per kg, the cost of 3g overfill per package was:
- 3g × INR 50 per 1000g = INR 0.15 per package
- Annual Losses: For a production volume of 1 million packages per month, the cost of giveaway was:
- 0.15 INR × 1,000,000 packages = INR 150,000 per month
- Annually: 150,000 × 12 = INR 1.8 million (18 lakhs)
This overfill eroded profits and was unsustainable. The company needed a reliable way to reduce process variation and optimize net content settings without violating legal limits.
How SPC (Statistical process control) helped?
The manufacturer implemented Zometric Online / Real-Time SPC Software to improve process control. Key improvements included:
- Elimination of Guesswork: Operators stopped making manual adjustments based on intuition. All process adjustments were driven by real-time statistical insights provided by the software.
- Improved Process Stability: The software continuously monitored process variation and highlighted actionable trends, allowing proactive intervention.
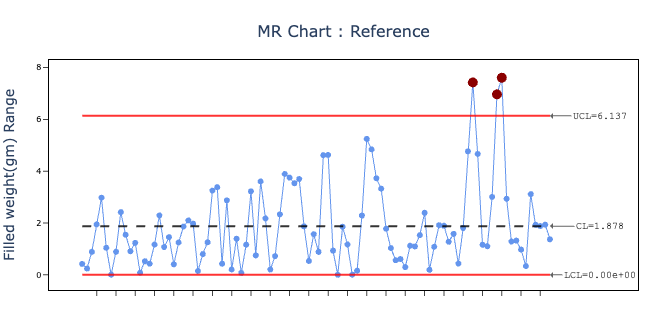
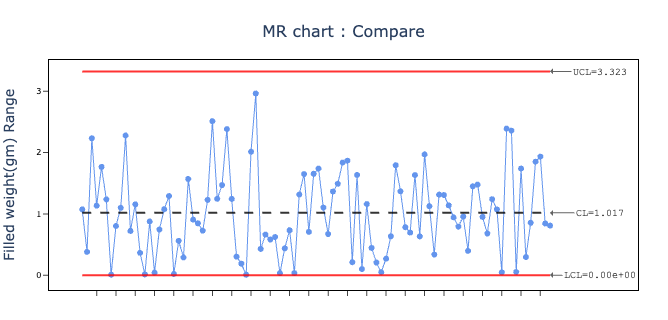
- Reduced Process Variation: With real-time monitoring and data-driven control, the process variation was reduced to its natural limits (overall standard deviation got closer to within standard deviation).
How much profit was added because of SPC?
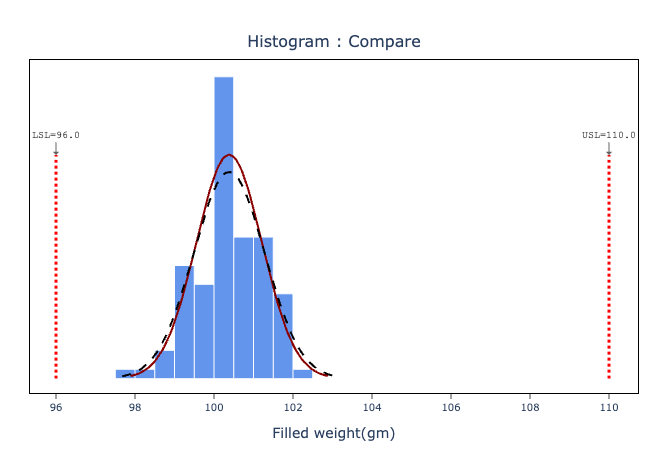
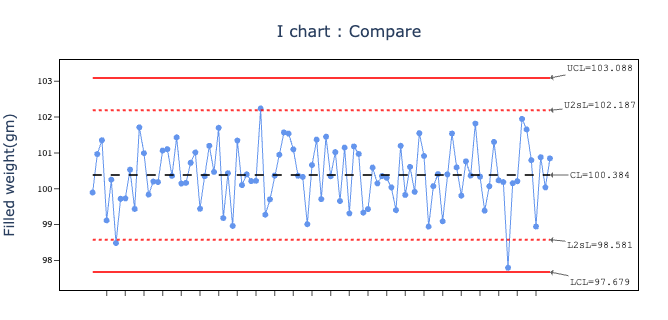
- Optimized Average Net Content:
With reduced variation and improved process predictability, the company confidently lowered the average net content from 103g to 100.3g.- The Lower Control Limit (LCL) stabilized around 98g, which was comfortably above the T1 lower limit of 98g and the T2 lower limit of 96g.
- Reduced Giveaway:
By lowering the average net content to 100.3g, the giveaway per package reduced from 3g to 0.3g.- The cost of giveaway per package now became:
0.3g × INR 50 per 1000g = INR 0.015 per package
- The cost of giveaway per package now became:
- Savings Calculation:
- Previous cost of giveaway: INR 0.15 per package
- New cost of giveaway: INR 0.015 per package
- Savings per package: 0.15 - 0.015 = INR 0.135 per package
- For 1 million packages per month:
0.135 INR × 1,000,000 packages = INR 135,000 per month
Annually: 135,000 × 12 = INR 1.62 million (16.2 lakhs)
- Compliance Assurance:
- The process LCL consistently hovered around 98g, staying within safe limits and ensuring compliance with legal requirements.
- No individual package fell below 96g, meeting the T2 limit.
Therefore, this led to a saving of INR 1.62 million (16.2 lakhs), which got added directly to the profit margin of this SKU.
Summary of impact delivered
By implementing Zometric Online / Real-Time SPC Software, the manufacturer achieved:
- Monetary Savings: Annual giveaway costs were reduced by INR 1.62 million (16.2 lakhs).
- Improved Process Stability: Variability was reduced, and guesswork-based adjustments were eliminated. This lead to reduced machine interruptions, additional productivity & asset utilisation. (monetary value or increased capacity not included above)
- Compliance Confidence: The net content consistently stayed within legal limits, safeguarding the company from regulatory risks.
This case study highlights how adopting a data-driven, statistical approach to process control can optimize performance, reduce costs, and enhance profitability.
Disclaimer: The figures mentioned in this case study have been modified to avoid disclosing exact values. However, the ratios have been largely retained to illustrate the plausible financial impact of adopting this approach in a similar situation.