What is Non-Parametric Process Capability?
Nonparametric Process Capability analysis measures how well a process meets its specification limits without making any assumption about the shape or distribution of the data. Instead of fitting a theoretical distribution like normal, Weibull, or Lognormal, it works directly with the actual observed data — using percentiles and empirical statistics derived purely from the sample values themselves.
This makes it a powerful and safe option when the data distribution is unknown, complex, or impossible to identify reliably with any standard distributional model. The key capability measure reported is the observed performance (PPM — parts per million outside specification), calculated directly from the data rather than from a fitted distribution.
Simple Definitions:A distribution-free capability analysis that works directly with your actual data values — no distribution fitting required — making it the safest choice when you cannot reliably identify what distribution your data follows.
When to use Non-Parametric Process Capability?
- Use when no standard distribution fits your data adequately — for example, when Individual Distribution Identification fails to find a good fit with any available distribution.
- Use when the data has a complex, multimodal, or irregular shape that cannot be described by a single theoretical distribution.
- Use when you want a conservative, assumption-free view of process capability that is purely based on what the data actually shows.
- Use when data is continuous but the sample size is large enough to produce stable empirical percentile estimates — at least 100 observations are recommended.
Guidelines for correct usage of Non-Parametric Process Capability
- Collect a minimum of 100 data points, and ideally more — nonparametric percentile estimates become significantly more reliable and stable with larger samples.
- Ensure the process is stable and in statistical control before running the analysis — capability results from an unstable process do not represent long-term performance.
- The primary output is observed PPM (parts per million outside specification) — this directly counts how many data points fall outside the specification limits, making it highly transparent and easy to explain.
- Do not compare nonparametric capability indices directly with Cp or Cpk values from a normal capability analysis — they are calculated differently and are not directly equivalent.
- If a good distribution fit is available, Non-Normal Capability Analysis will generally give more precise and informative results than the nonparametric approach.
Alternatives: When not to use Non-Parametric Process Capability
| Situation | Use Instead |
| Data is normally distributed | Normal (standard) Capability Analysis |
| A specific non-normal distribution fits well | Non-Normal Process Capability |
| Data can be transformed to normality | Capability Analysis with Box-Cox or Johnson Transformation |
| Data is attribute or count-based | Binomial or Poisson Capability |
| Sample size is less than 100 | Collect more data before any capability analysis |
Example of Non-Parametric Process Capability?
An automotive component manufacturer is developing a critical component for an OEM customer. To ensure quality, an engineer is checking if a drilling machine can meet specifications. The part needs to be within a range: LSL (Lower Specification Limit) of 22.15 and USL (Upper Specification Limit) of 22.35. The engineer takes 125 samples from the machine and conducts a machine capability study.. The following steps:
- Gathered the necessary data.
- Now analyses the data with the help of https://qtools.zometric.com/ or https://intelliqs.zometric.com/.
- To find Non-Parametric Process Capability choose https://intelliqs.zometric.com/> Statistical module> Control Chart> Non-Parametric Process Capability.
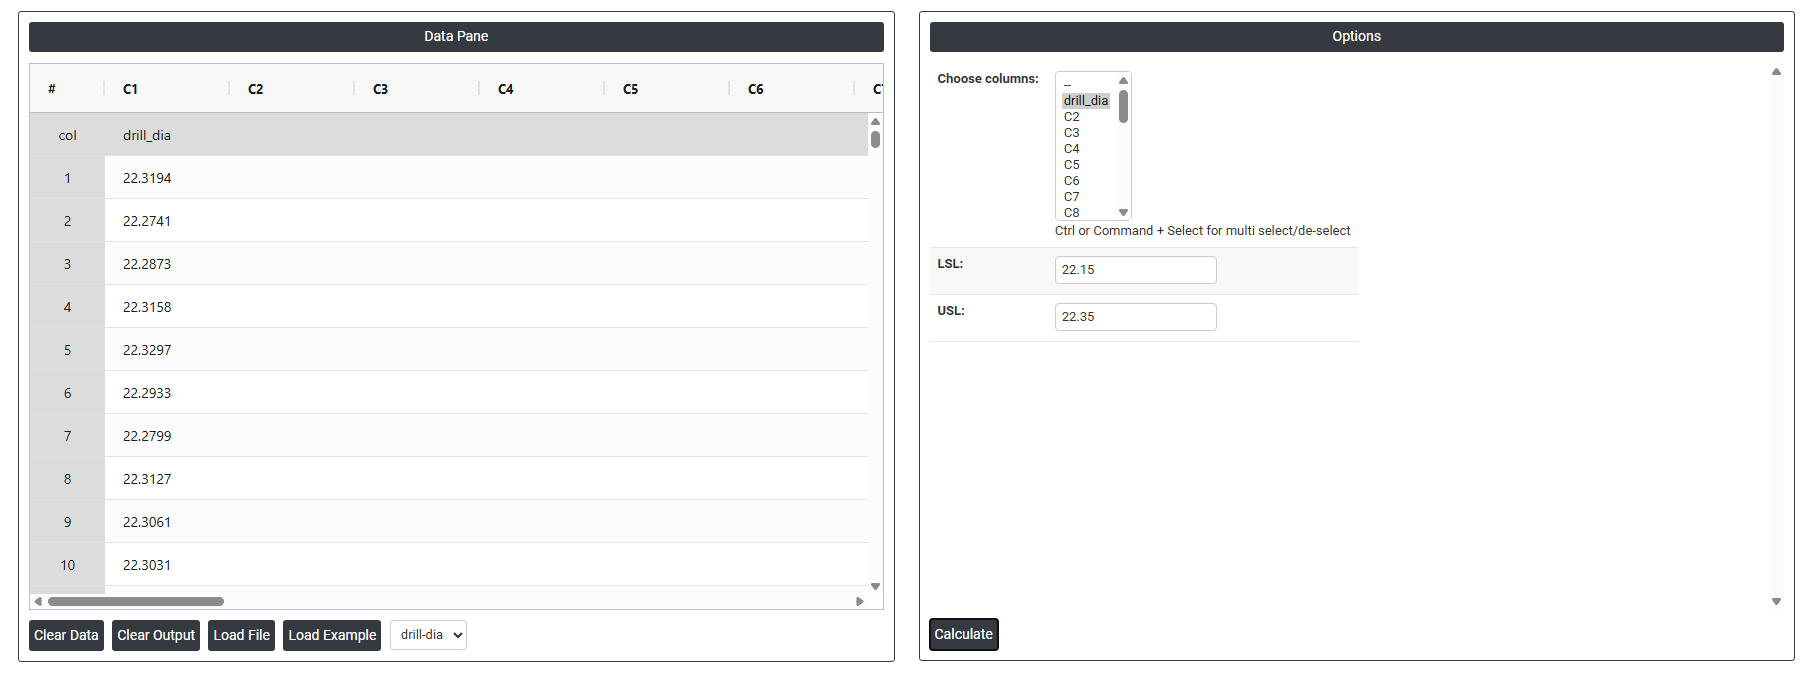
- Inside the tool, feeds the data along with other inputs as follows:
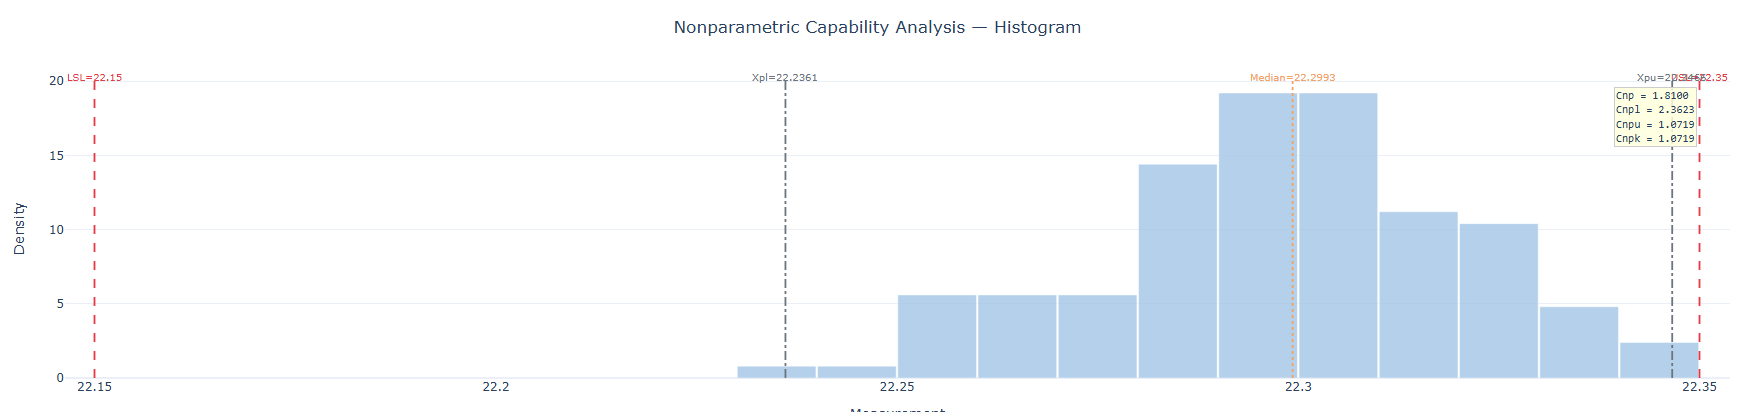
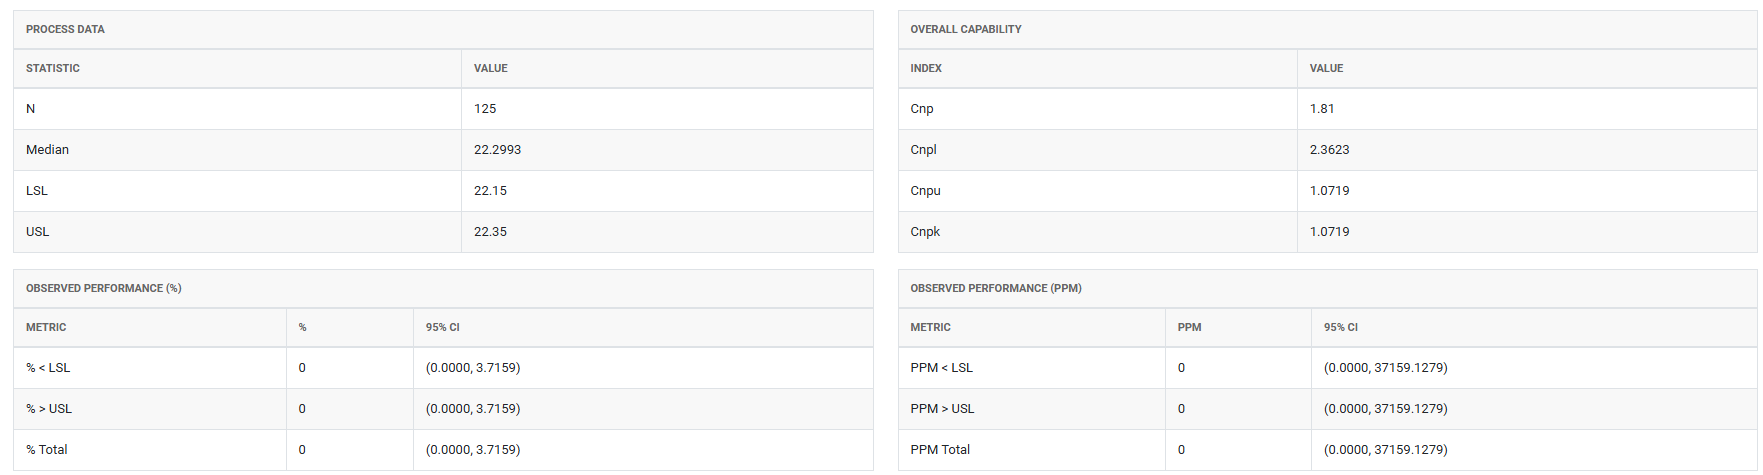
5. After using the above mentioned tool, fetches the output as follows:
How to do Non-Parametric Process Capability.
The guide is as follows:
- Login in to QTools account with the help of https://qtools.zometric.com/ or https://intelliqs.zometric.com/
- On the home page, choose Statistical Tool> Control Chart>Non-Parametric Process Capability .
- Next, update the data manually or can completely copy (Ctrl+C) the data from excel sheet and paste (Ctrl+V) it here.
- Fill the required options .
- Finally, click on calculate at the bottom of the page and you will get desired results.
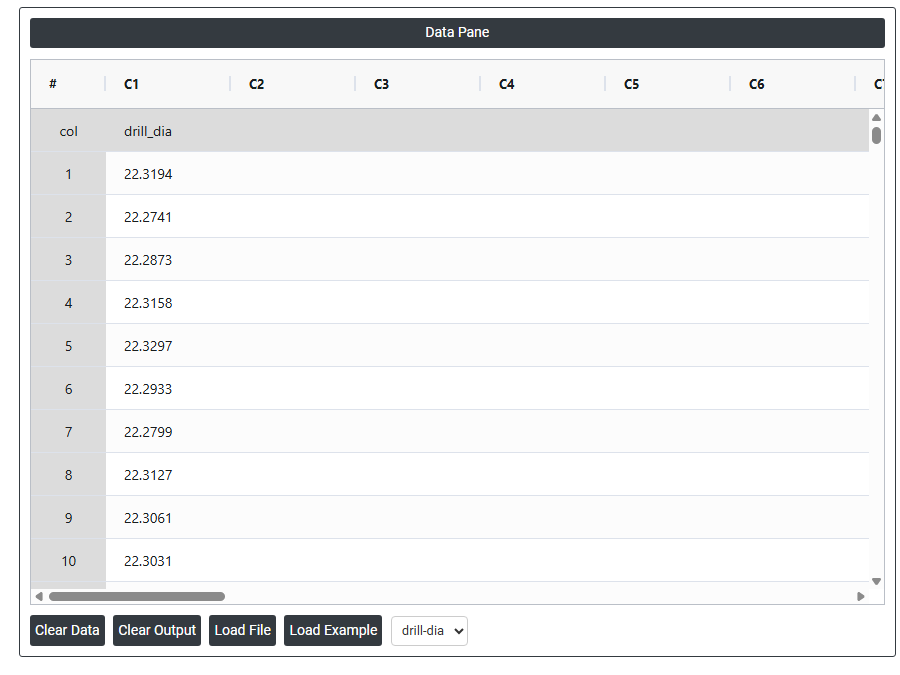
On the dashboard of Non-Parametric Process Capability, the window is separated into two parts.
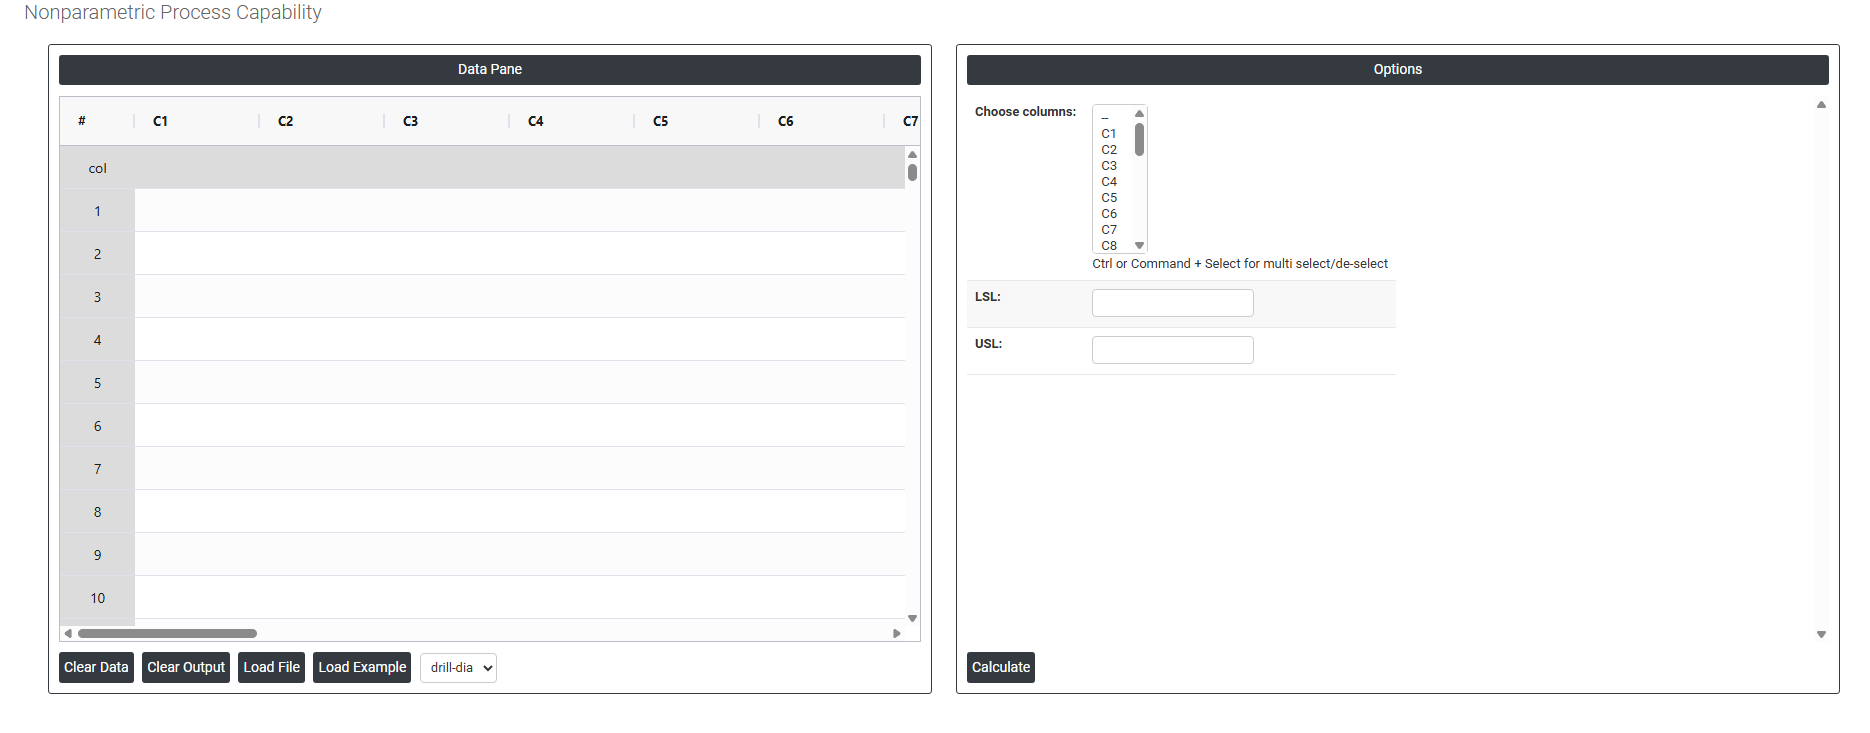
On the left part, Data Pane is present. In the Data Pane, each row makes one subgroup. Data can be fed manually or the one can completely copy (Ctrl+C) the data from excel sheet and paste (Ctrl+V) it here.
Load example: Sample data will be loaded.
Load File: It is used to directly load the excel data.
On the right part, there are many options present as follows:
- Choose Columns Select the column(s) containing your continuous measurement data. Use Ctrl or Command + Click to select multiple columns at once. These are the actual process measurements — such as drill diameters, tensile strengths, or cycle times — that will be analysed for capability against the specification limits using the selected non-normal distribution.
- LSL (Lower Specification Limit) The minimum acceptable value for the measurement. Any data point falling below this value is considered out of specification. Enter the LSL defined by your engineering drawing, customer requirement, or product specification. At least one specification limit (LSL or USL) must be provided — both can be entered if the measurement has two-sided specifications.
- USL (Upper Specification Limit) The maximum acceptable value for the measurement. Any data point exceeding this value is considered out of specification. Enter the USL from your engineering drawing or product specification. If the process characteristic only has a one-sided requirement — for example, a minimum strength with no upper limit — only the relevant limit needs to be entered.