What is Covariance ?
When to use Covariance?
- Use when you want to understand the directional relationship between two continuous variables — whether they move together or in opposite directions.
- Use as an input to multivariate analyses such as Principal Component Analysis (PCA) or multivariate regression where the covariance matrix is required.
- Use when assessing whether multiple process variables are interrelated before building a regression or predictive model.
- Use when comparing the joint variability of two variables across different process conditions or time periods.
Guidelines for correct usage of Covariance
- Both variables must be continuous — covariance is not meaningful for categorical data.
- Check for outliers before interpreting covariance — extreme values have a disproportionate influence on covariance estimates.
- Remember that covariance is scale-dependent — variables measured in larger units will produce larger covariance values regardless of the actual strength of the relationship. Use correlation for standardised comparison.
- A large positive or negative covariance does not necessarily mean a strong relationship — always standardise to correlation for meaningful interpretation of relationship strength.
Alternatives: When not to use Covariance
- If you want to predict one variable from another, use Regression Analysis
- If comparing relationships across categorical groups, use ANOVA or chi-square tests
Example of Covariance?
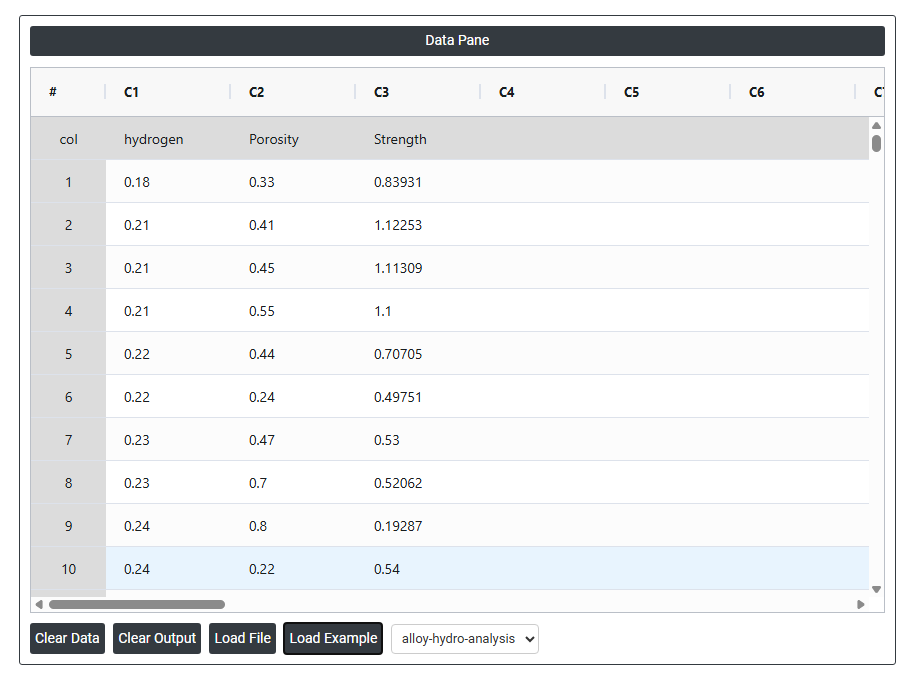
An engineer at an aluminum castings plant assesses the relationship between the hydrogen content and the porosity of aluminum alloy castings. The engineer collects a random sample of 14 castings and measures the following properties of each casting: hydrogen content, porosity, and strength. The test in following steps:
- Gathered the necessary data.
2. Now analyses the data with the help of https://qtools.zometric.com/ or https://intelliqs.zometric.com/.
3. To find Covariance choose https://intelliqs.zometric.com/> Statistical module> Hypothesis Test> Covariance.
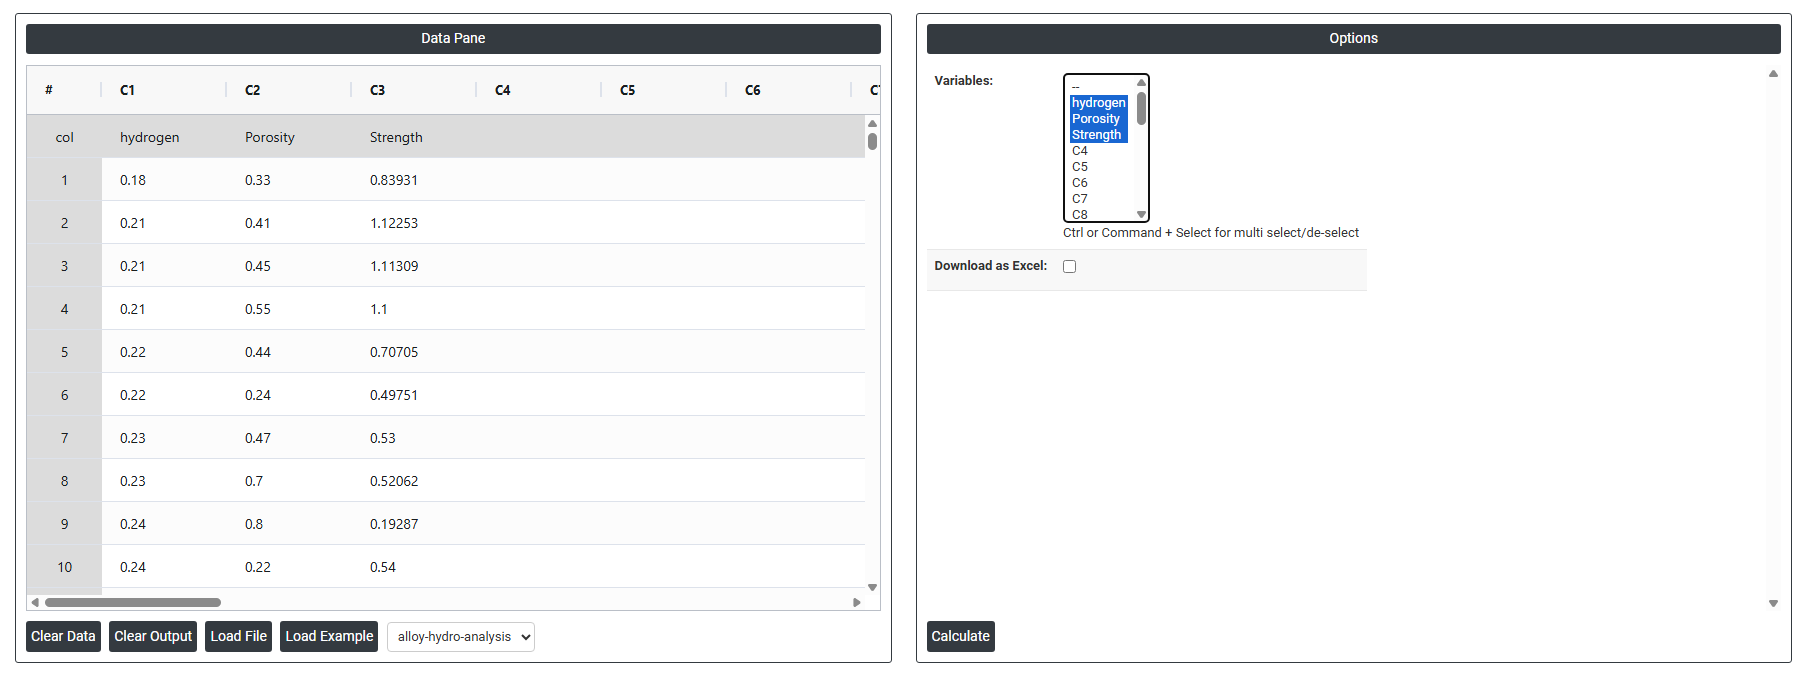
4. Inside the tool, feeds the data along with other inputs as follows:
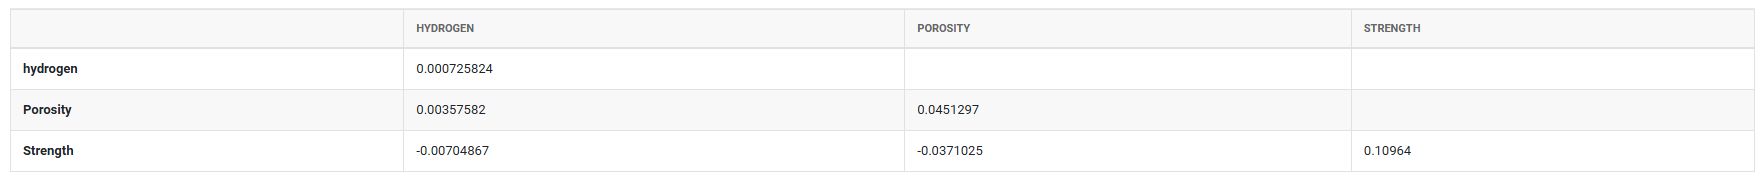
5. After using the above mentioned tool, fetches the output as follows:
How to do Covariance
The guide is as follows:
- Login in to QTools account with the help of https://qtools.zometric.com/ or https://intelliqs.zometric.com/
- On the home page, choose Statistical Tool> Hypothesis Test >Covariance .
- Next, update the data manually or can completely copy (Ctrl+C) the data from excel sheet and paste (Ctrl+V) it here.
- Fill the required options.
- Finally, click on calculate at the bottom of the page and you will get desired results.
On the dashboard of Covariance, the window is separated into two parts.
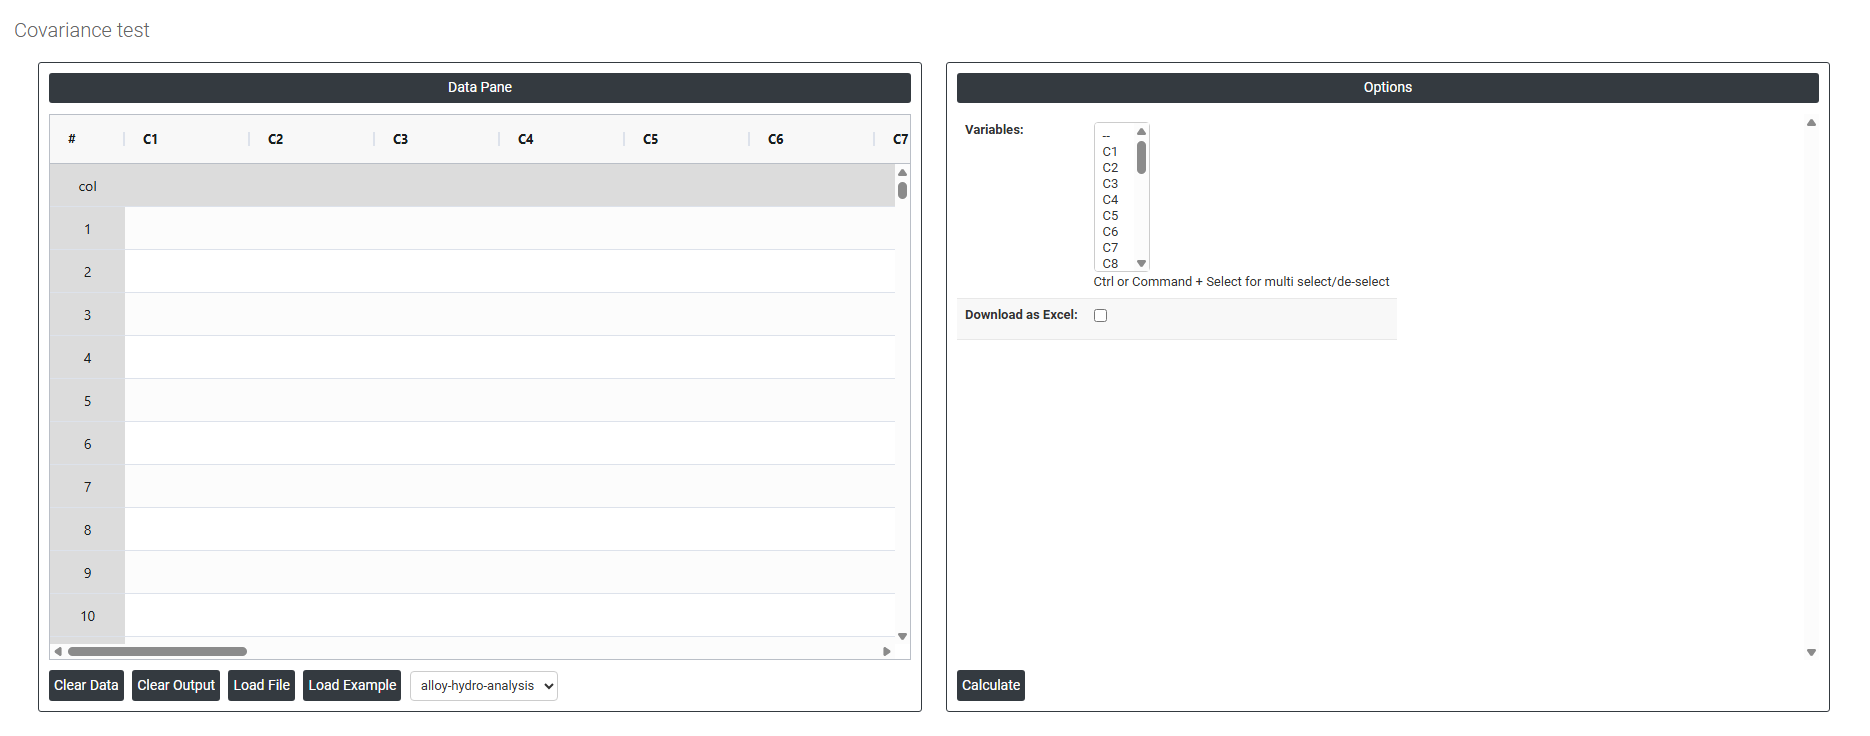
On the left part, Data Pane is present. In the Data Pane, each row makes one subgroup. Data can be fed manually or the one can completely copy (Ctrl+C) the data from excel sheet and paste (Ctrl+V) it here.
Load example: Sample data will be loaded.
Load File: It is used to directly load the excel data.
On the right part, there are many options present as follows:
- Variables Select the column(s) containing the continuous variables you want to analyse. Use Ctrl or Command + Click to select two or more columns simultaneously — covariance requires at least two variables to measure how they change in relation to each other. Each selected variable is compared against every other selected variable, and the results are presented as a covariance matrix where each cell shows the covariance between one pair of variables.
- For example, selecting Hydrogen, Porosity, and Strength will produce a matrix showing:
- Covariance between Hydrogen and Porosity
- Covariance between Hydrogen and Strength
- Covariance between Porosity and Strength
The diagonal of the matrix shows the variance of each variable with itself.
- Download as Excel Exports the complete covariance matrix into an Excel file for further analysis, inclusion in reports, or sharing with colleagues.