What is Kruskal-Wallis Test?
The Kruskal-Wallis Test is a nonparametric statistical test used to determine whether three or more independent groups originate from the same population distribution. It works by ranking all data values together and comparing the average ranks across groups making it a distribution-free alternative to one-way ANOVA that does not require normally distributed data.
It answers the question: is there a statistically significant difference in the central tendency across the groups? A significant result means at least one group differs but it does not identify which specific groups. A post-hoc comparison is required for that.
Simple Definitions: A test that compares three or more independent groups to determine if at least one has a significantly different median without requiring normally distributed data.
When to use Kruskal-Wallis Test?
- Use when comparing three or more independent groups on a continuous or ordinal response variable.
- Use when data cannot be assumed to be normally distributed especially with small samples or heavily skewed data.
- Use as a nonparametric alternative to one-way ANOVA when ANOVA assumptions are violated.
- Use when the response variable is ordinal (e.g. satisfaction ratings) rather than continuous.
Guidelines for correct usage of Kruskal-Wallis Test
- Each group must be independent observations in one group must not be related to those in another.
- Collect at least 5 observations per group for reliable results.
- Groups should have similar distribution shapes and spreads for the median interpretation to be valid.
- A significant result only indicates at least one group differs use pairwise Mann-Whitney comparisons with Bonferroni correction to identify which.
- Ensure the response is continuous or at least ordinal the test is not valid for nominal categorical responses.
Alternatives: When not to use Kruskal-Wallis Test
- If data is normally distributed, use One-Way ANOVA more powerful when assumptions are met.
- If comparing only two independent groups, use Mann-Whitney Test
- If groups are related or repeated measures, use Friedman Test
- If outliers are severe, use Mood’s Median Test for a more robust comparison.
Example of Kruskal-Wallis Test
A hospital group wants to compare the number of unoccupied beds for three hospitals in the same city. 11 different days from the records of each hospital was selected, amd number of unoccupied beds for each day was recorded. To determine whether the median number of unoccupied beds differs, the administrator uses the Kruskal-Wallis test. The following steps:
- Gathered the necessary data.
- Now analyses the data with the help of https://qtools.zometric.com/ or https://intelliqs.zometric.com/.
- To find Kruskal-Wallis Test choose https://intelliqs.zometric.com/> Statistical module> Nonparametric > Kruskal-Wallis Test.
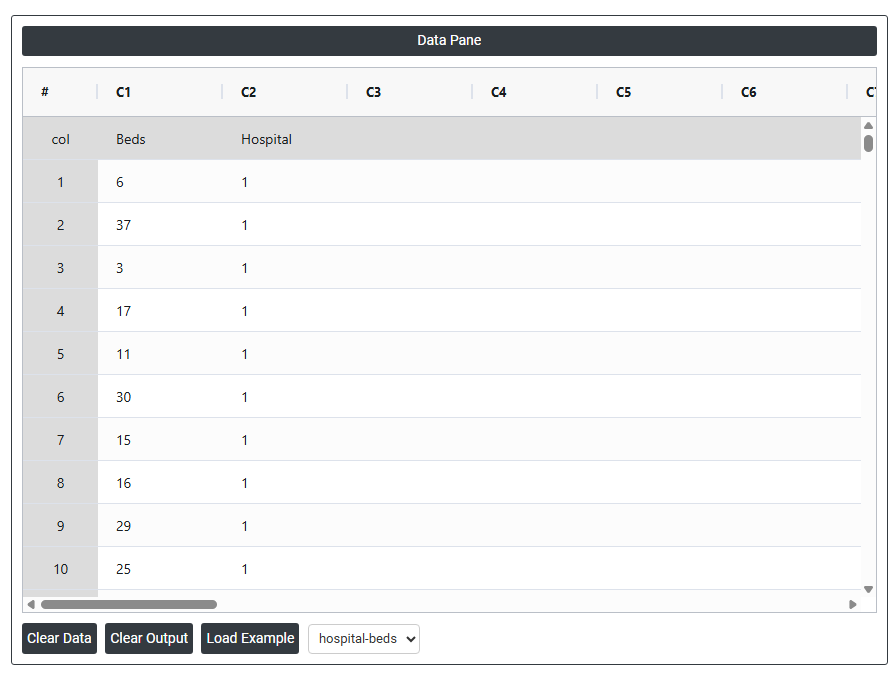
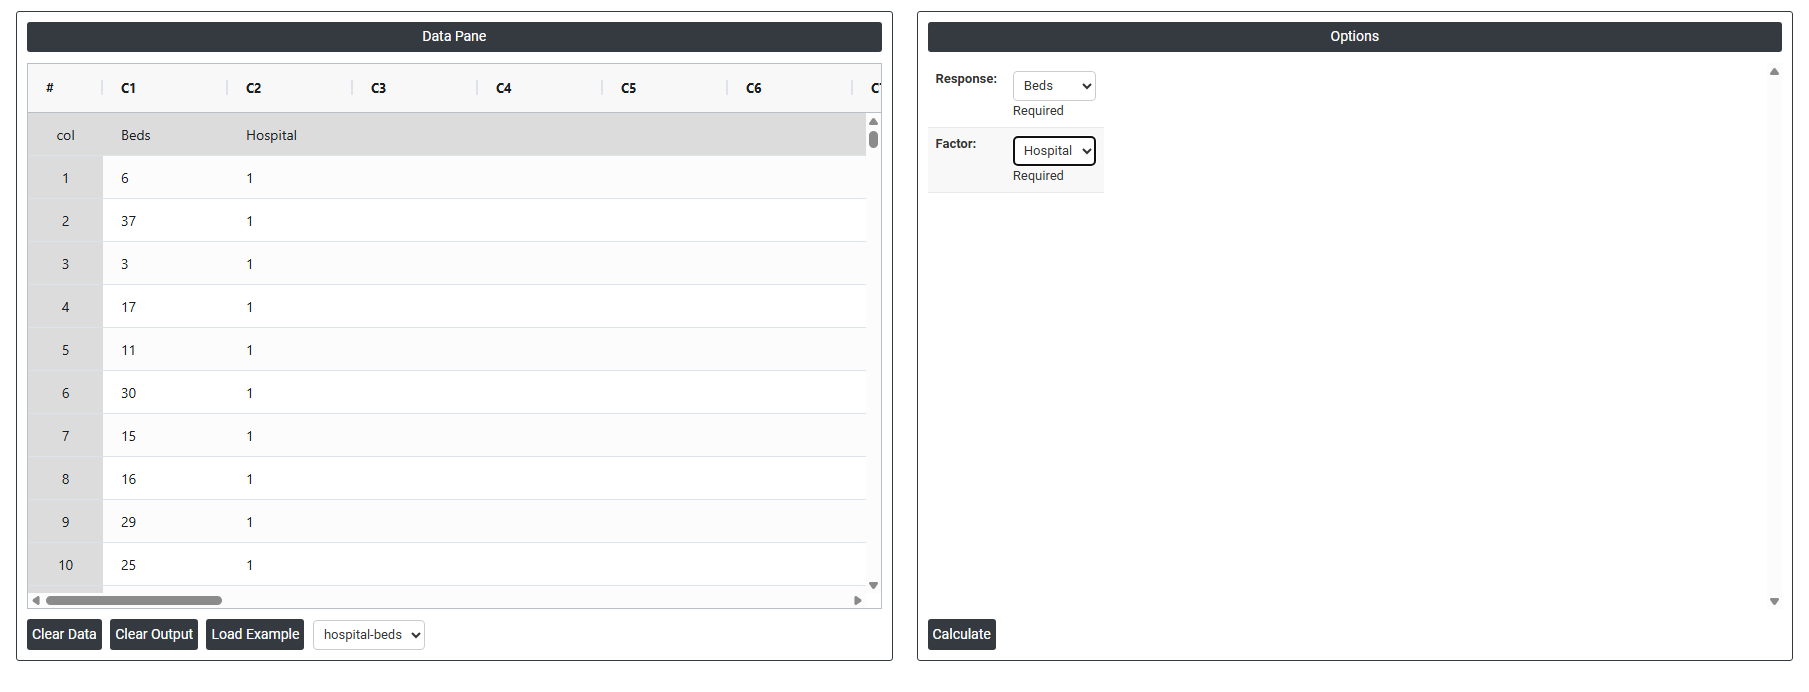
- Inside the tool, feeds the data along with other inputs as follows:
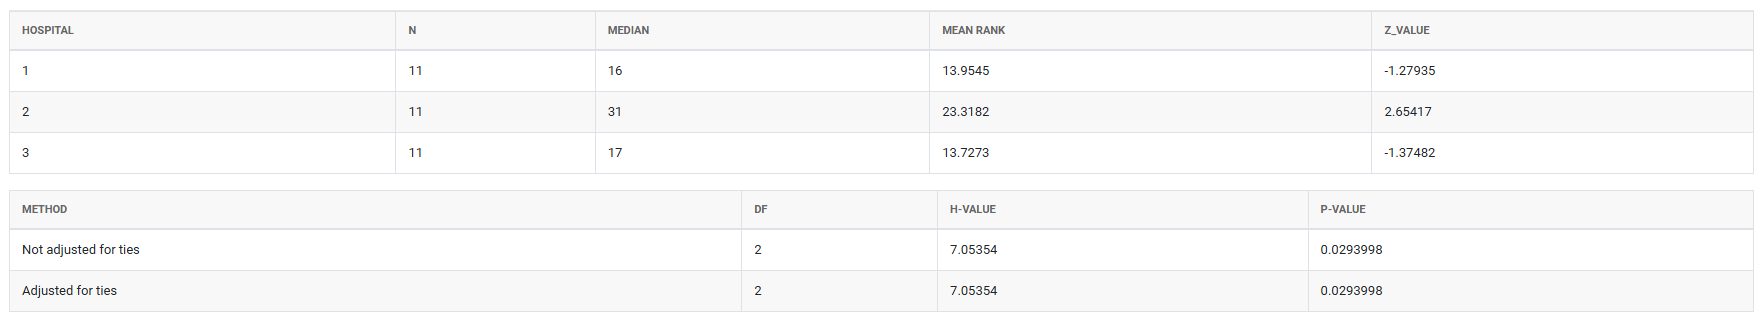
5. After using the above mentioned tool, fetches the output as follows:
How to do Kruskal-Wallis Test
The guide is as follows:
- Login in to QTools account with the help of https://qtools.zometric.com/ or https://intelliqs.zometric.com/
- On the home page, choose Statistical Tool> Nonparametric>Kruskal-Wallis Test.
- Next, update the data manually or can completely copy (Ctrl+C) the data from excel sheet and paste (Ctrl+V) it here.
- Next, you need to fill the required options.
- Finally, click on calculate at the bottom of the page and you will get desired results.
On the dashboard of Kruskal-Wallis Test, the window is separated into two parts.
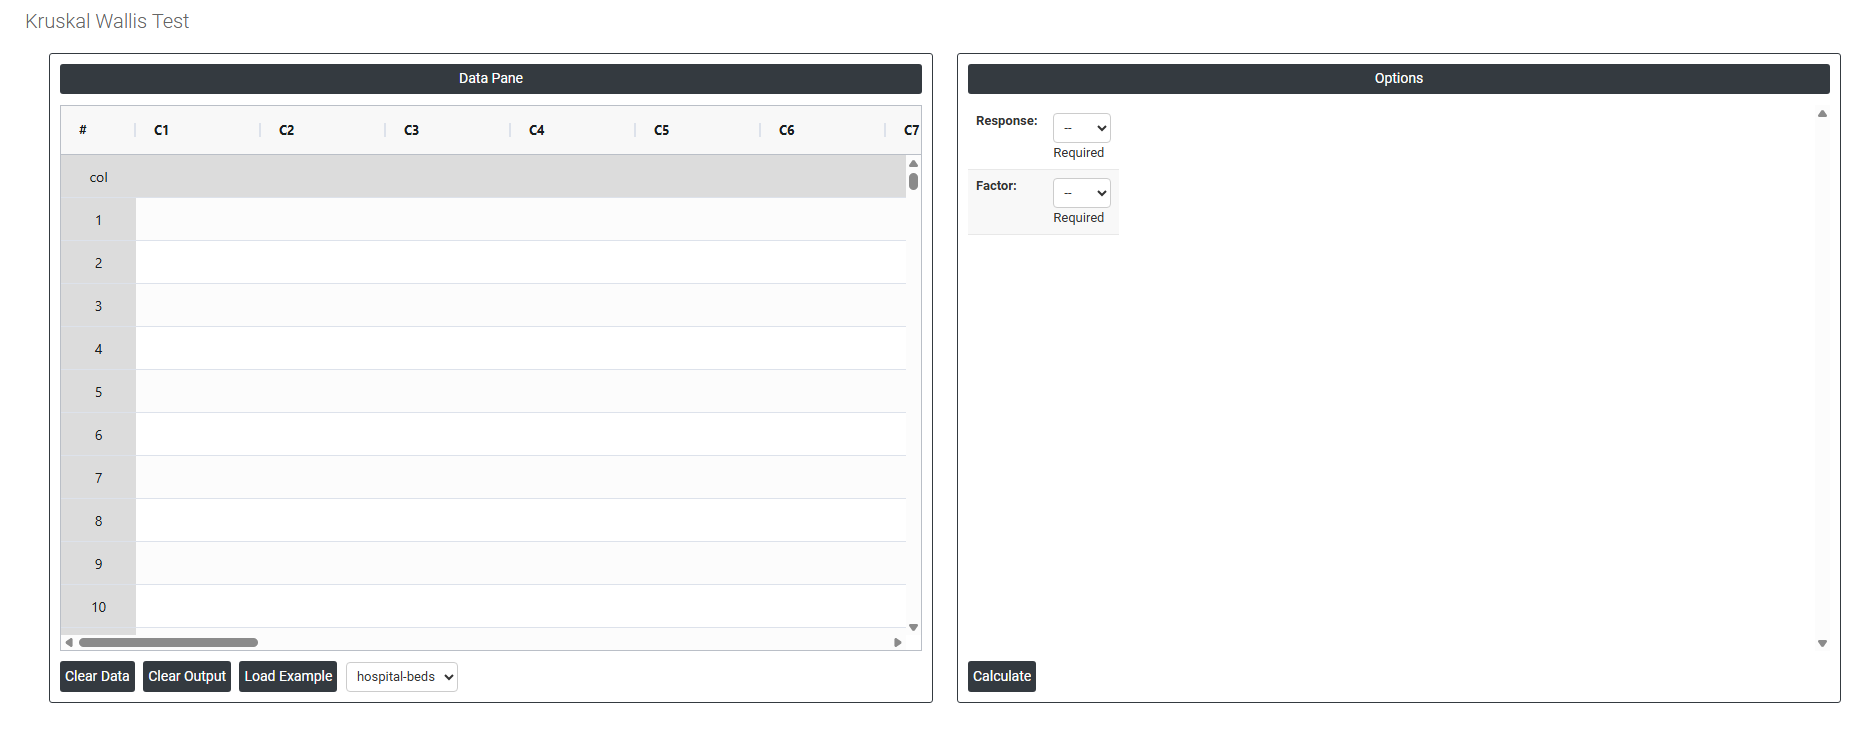
On the left part, Data Pane is present. In the Data Pane, each row makes one subgroup. Data can be fed manually or the one can completely copy (Ctrl+C) the data from excel sheet and paste (Ctrl+V) it here.
Load example: Sample data will be loaded.
On the right part, there are many options present as follows:
-
Response Select the column that contains the measurement values you want to compare across groups such as cycle time, strength, weight, or any continuous or ordinal outcome variable. This is the variable being tested to determine whether its distribution differs significantly across the groups defined by the Factor column.
-
Factor Select the column that identifies which group each observation belongs to such as machine type, operator, shift, or treatment condition. Each unique value in this column represents a separate group. The Kruskal-Wallis test compares the response values across all groups defined here to determine whether at least one group has a significantly different median from the others.