What is Random Poisson Data?
Random Poisson Data generates values from the Poisson distribution, which models the number of events occurring in a fixed interval of time, area, or volume when events happen independently at a constant average rate. You specify lambda (λ) , the average number of events per interval.
Simple Definitions: Generates random count data for how many times an event occurs in a fixed period such as defects per unit, calls per hour, or errors per document page.
When to use Random Poisson Data?
- Use to simulate defect counts, error counts, or arrival rates per unit of time or area.
- Use for testing C charts and U charts with known lambda values.
- Use when events are rare and independent within the observation window.
Guidelines for correct usage of Random Poisson Data
- All values will be non-negative integers verify this in the output.
- For large lambda (> 30), the distribution approximates a normal distribution.
Alternatives: When not to use Random Poisson Data
- For proportion defective data, use Random Binomial Data
- For continuous time-to-event data, use Random Exponential Data
Example of Random Poisson Data
The following steps to Generate Random Poisson Data:
- To Generate Random Poisson Data need to fill the required options.
- Now analyses the data with the help of https://qtools.zometric.com/ or https://intelliqs.zometric.com/.
- To find Generate Random Poisson Data choose https://intelliqs.zometric.com/> Statistical module> Random Data > Random Poisson Data
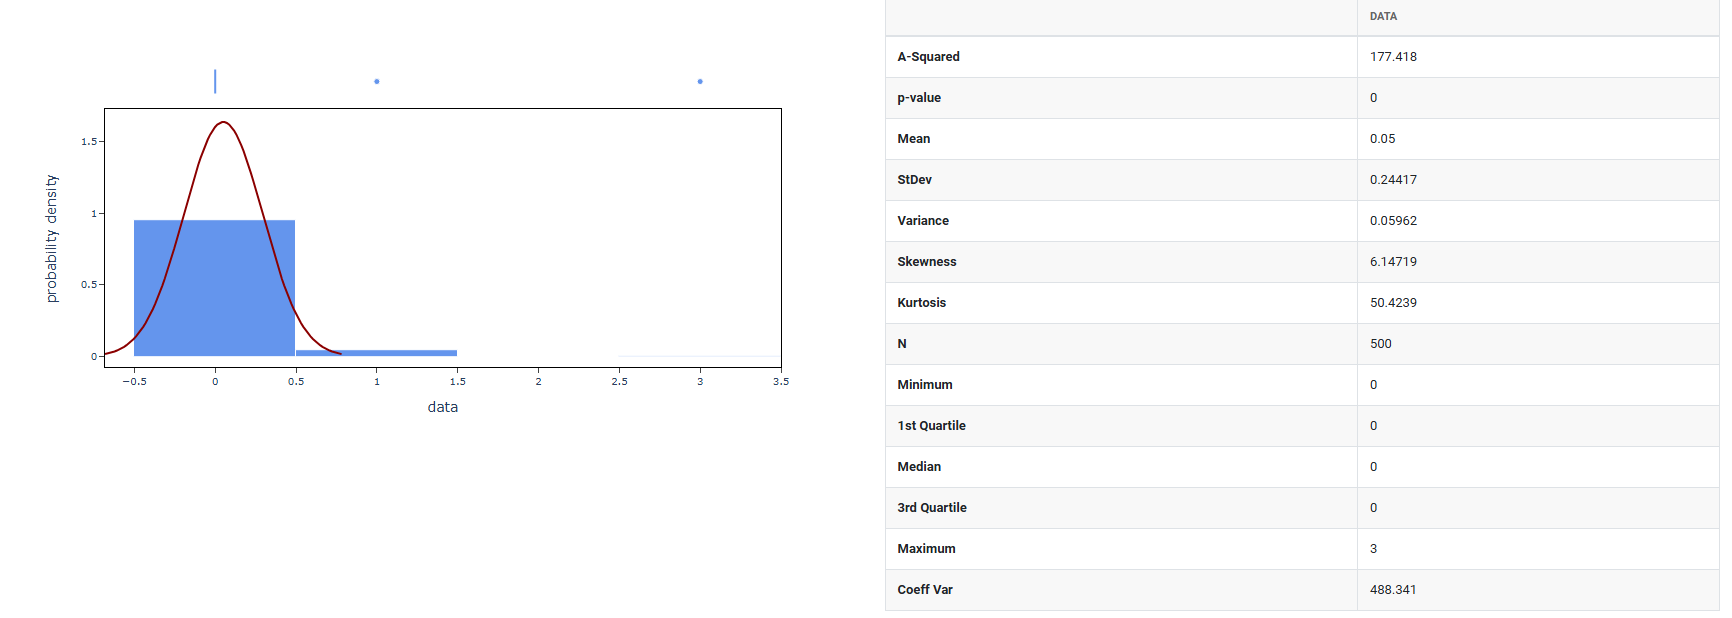
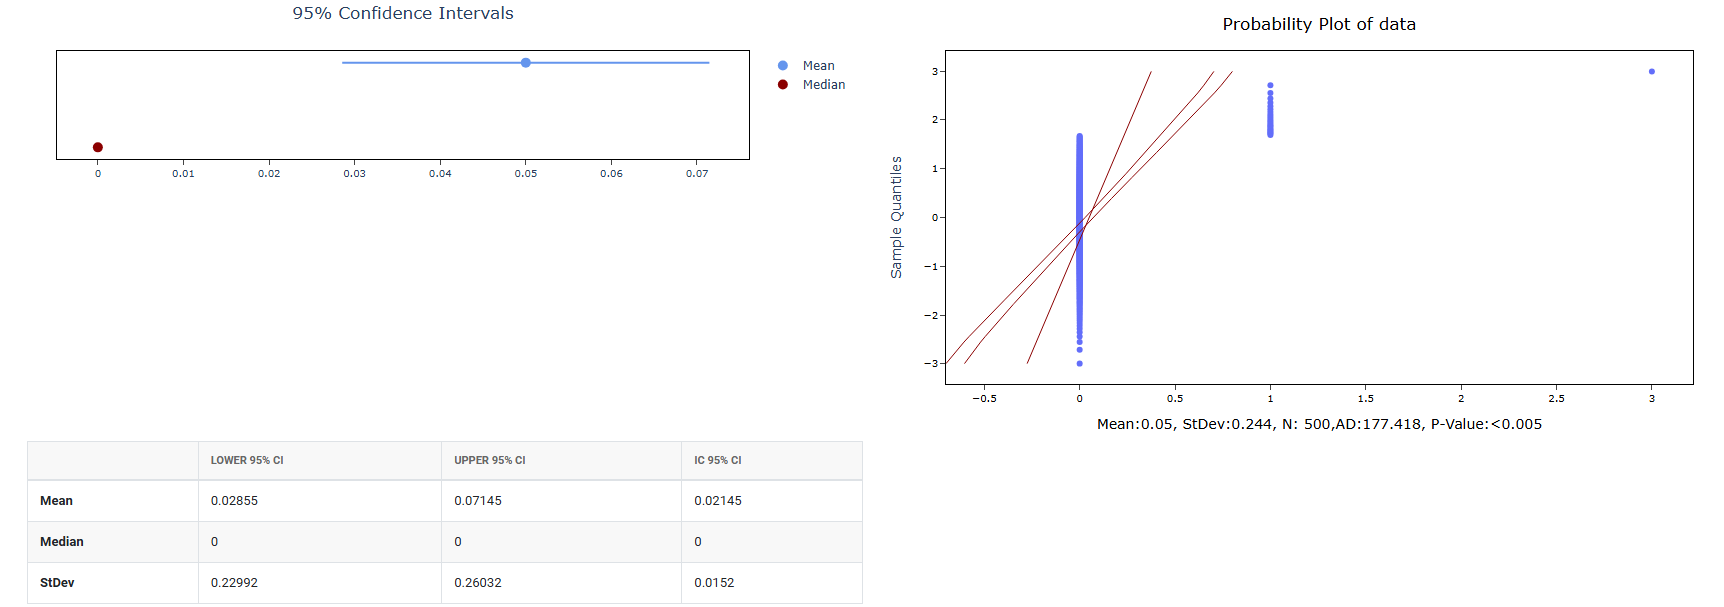
4. After using the above mentioned tool, fetches the output as follows:
How to do Random Poisson Data
The guide is as follows:
- Login in to QTools account with the help of https://qtools.zometric.com/ or https://intelliqs.zometric.com/
- On the home page, choose Statistical Tool> Random Data>Random Poisson Data.
- Next, you need to fill the required options.
- Finally, click on calculate at the bottom of the page and you will get desired results.
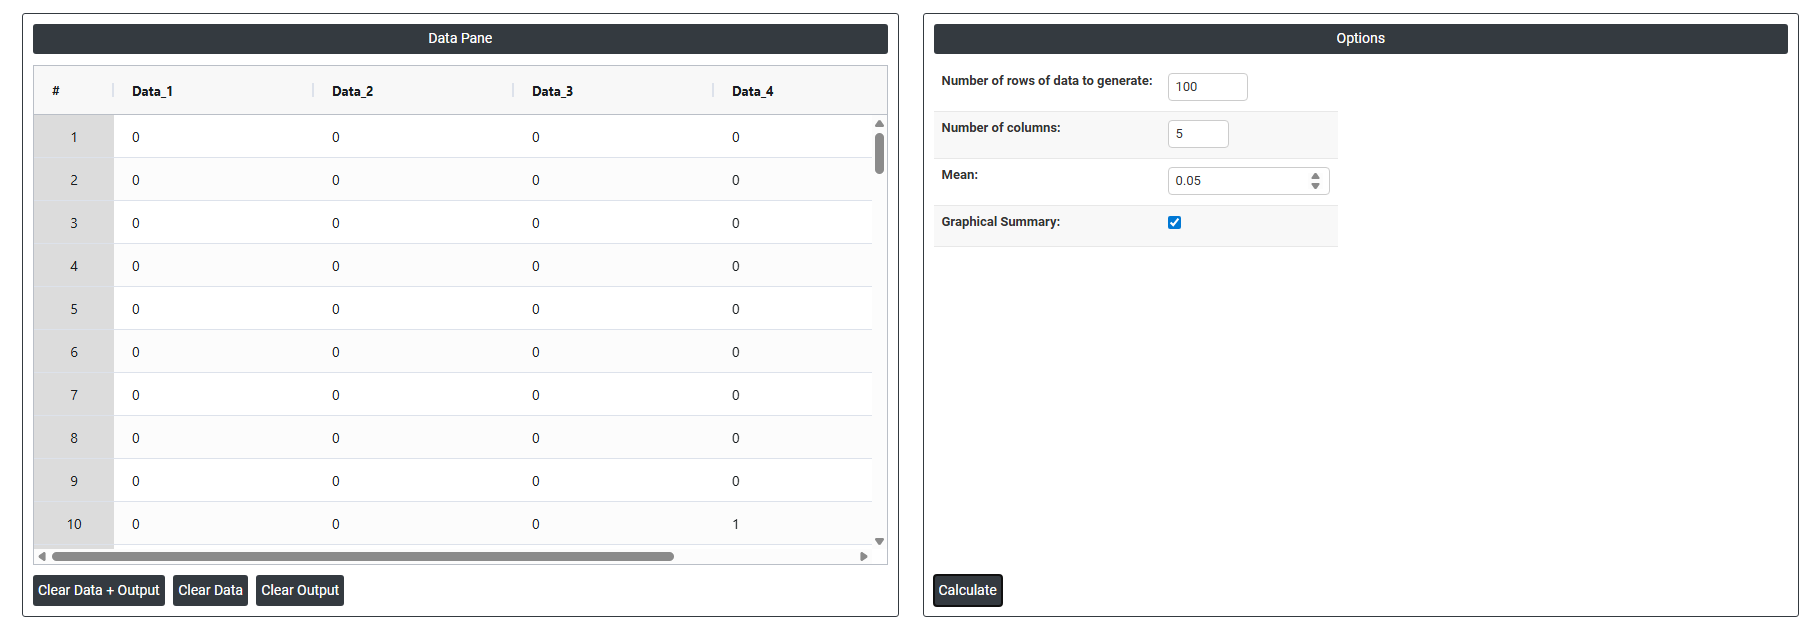
On the dashboard of Random Poisson Data, the window is separated into two parts.
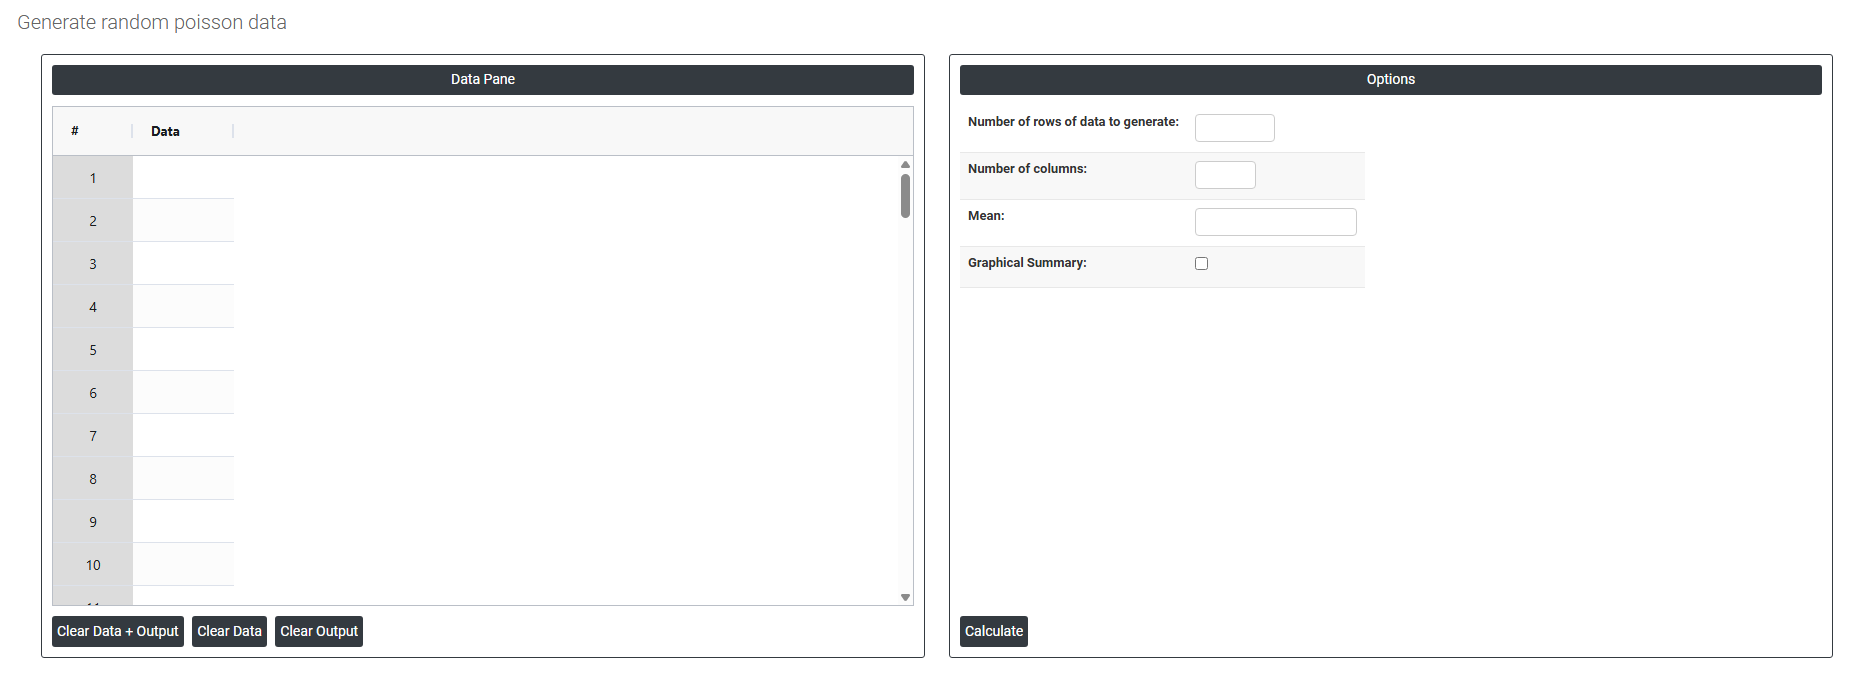
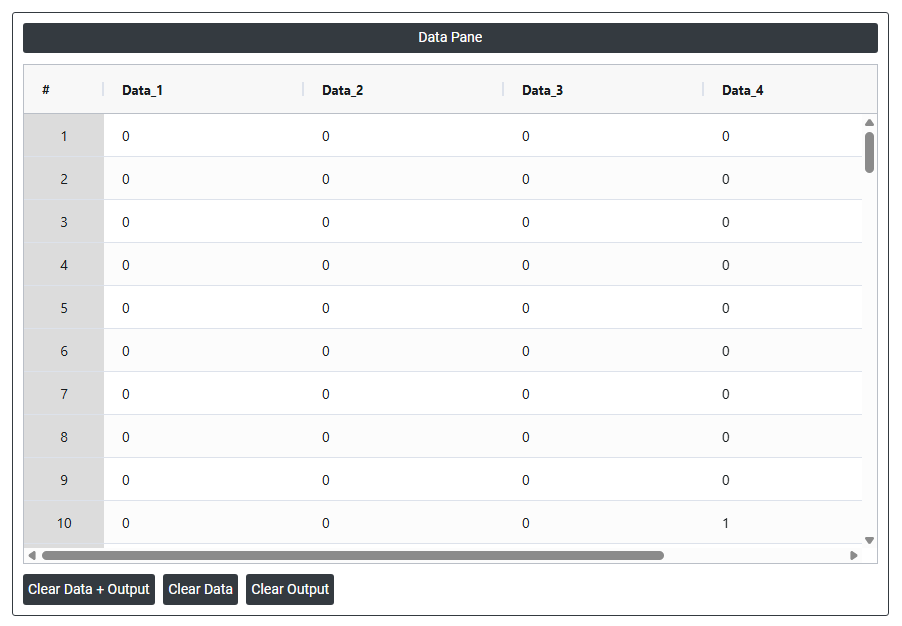
On the left part, Data Pane is present. In the Data Pane, each row makes random data generated. Data will be generated after filling the required options.
On the right part, there are many options present as follows:
- Number of rows of data to generate: Specifies how many random data points to generate. For example, entering 10 will produce exactly 10 rows of random values, all visible in the data pane.
- Number of columns: Specifies how many variables (columns) each row will have. For example, entering 3 will produce 3 columns of randomly generated data side by side in the data pane.
- Mean: The average value used as the centre point when generating the random data. The random numbers will be distributed around this value so if you set the mean to 50, the generated data will cluster around 50, with values spread above and below it according to the standard deviation.
- Graphical summary: After the random data is generated using the mean and standard deviation you specified, this option produces a graphical analysis of that data such as a histogram showing how the generated values are distributed. It is a visual result based on the data that was just created.