What is Random Lognormal Data?
Random Lognormal Data generates values from the lognormal distribution a right-skewed distribution where the natural logarithm of the data follows a normal distribution. The result is a set of always-positive values that are skewed to the right, commonly seen in measurements such as particle sizes, income distributions, and biological concentrations.
Simple Definitions: Generates random positive values with a right-skewed distribution natural for measurements like particle sizes, response times, and material concentrations that cannot be zero or negative.
When to use Random Lognormal Data?
- Use to simulate right-skewed continuous measurements that are always positive.
- Use when log-transforming your data makes it approximately normal, and you want to generate realistic raw values for simulation.
- Use in environmental, pharmaceutical, and financial simulations.
Guidelines for correct usage of Random Lognormal Data
- Parameters are specified on the log scale location is the mean of log(x), not the mean of x.
- All generated values are strictly positive.
- Use a fixed seed for reproducible results.
Alternatives: When not to use Random Lognormal Data
- If data is symmetric and bell-shaped, use Random Normal Data
- For time-to-failure with changing hazard rate, use Random Weibull Data
Example of Random Lognormal Data
The following steps to Generate Random Lognormal Data:
- To Generate Random Lognormal Data need to fill the required options.
- Now analyses the data with the help of https://qtools.zometric.com/ or https://intelliqs.zometric.com/.
- To find Random Lognormal Data choose https://intelliqs.zometric.com/> Statistical module> Random Data > Random Lognormal Data
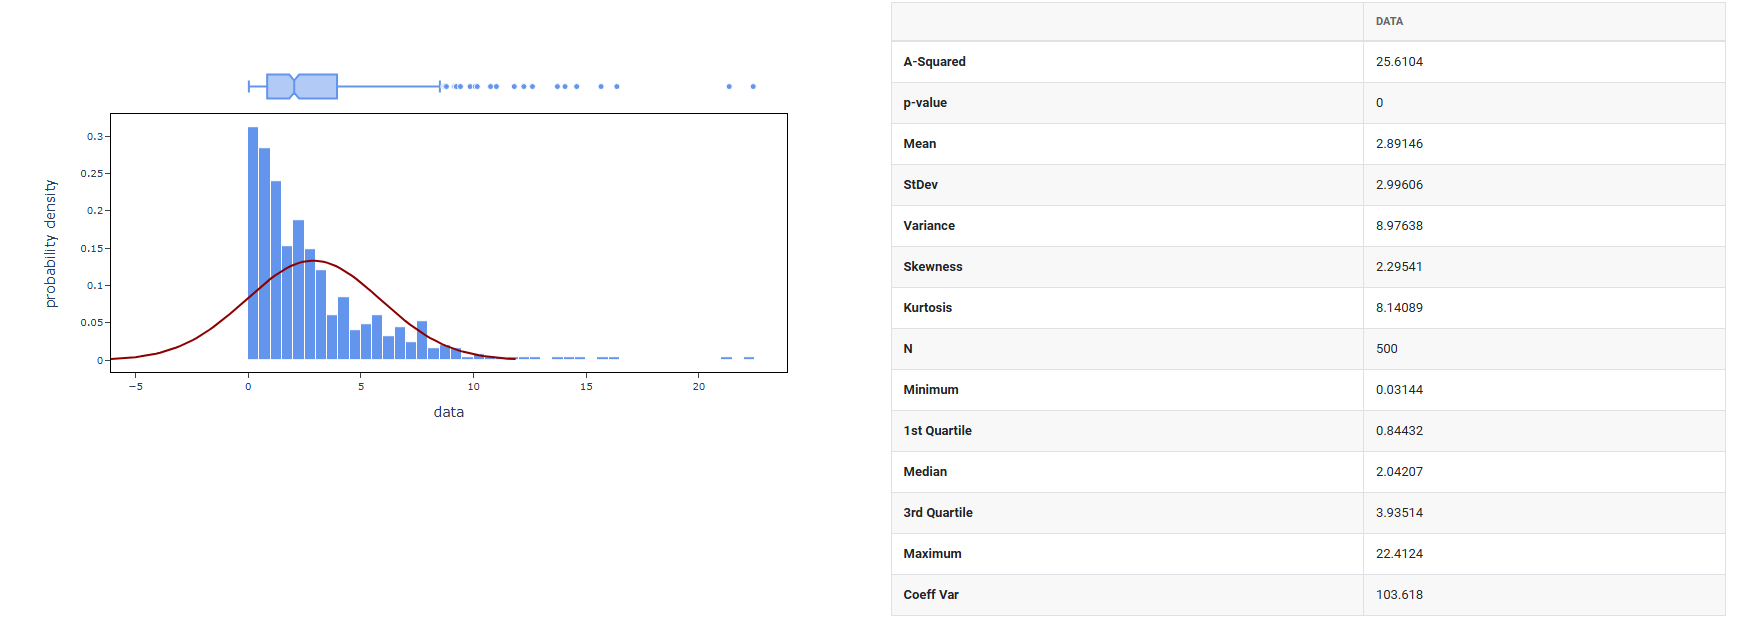
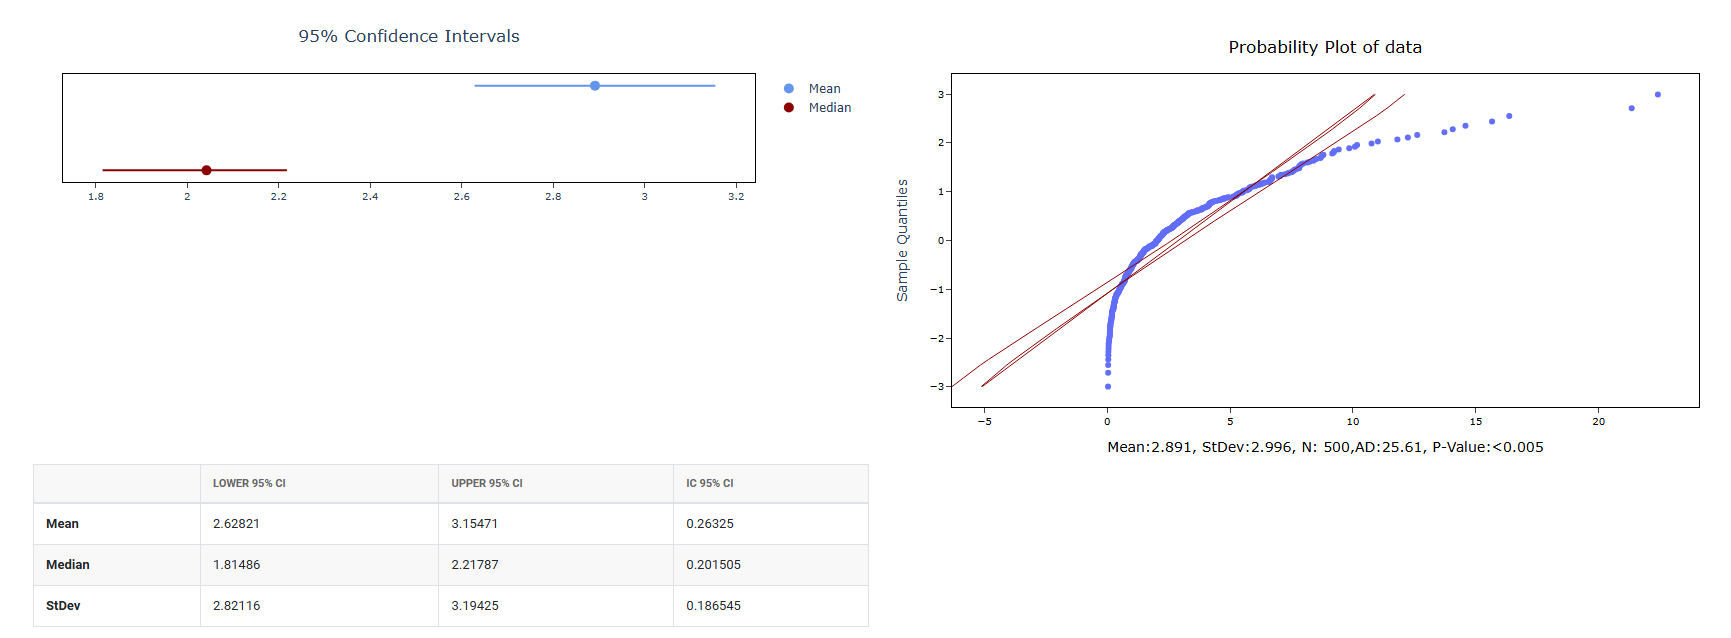
4. After using the above mentioned tool, fetches the output as follows:
How to do Random Lognormal Data
The guide is as follows:
- Login in to QTools account with the help of https://qtools.zometric.com/ or https://intelliqs.zometric.com/
- On the home page, choose Statistical Tool> Random Data>Random Lognormal Data.
- Next, you need to fill the required options.
- Finally, click on calculate at the bottom of the page and you will get desired results.
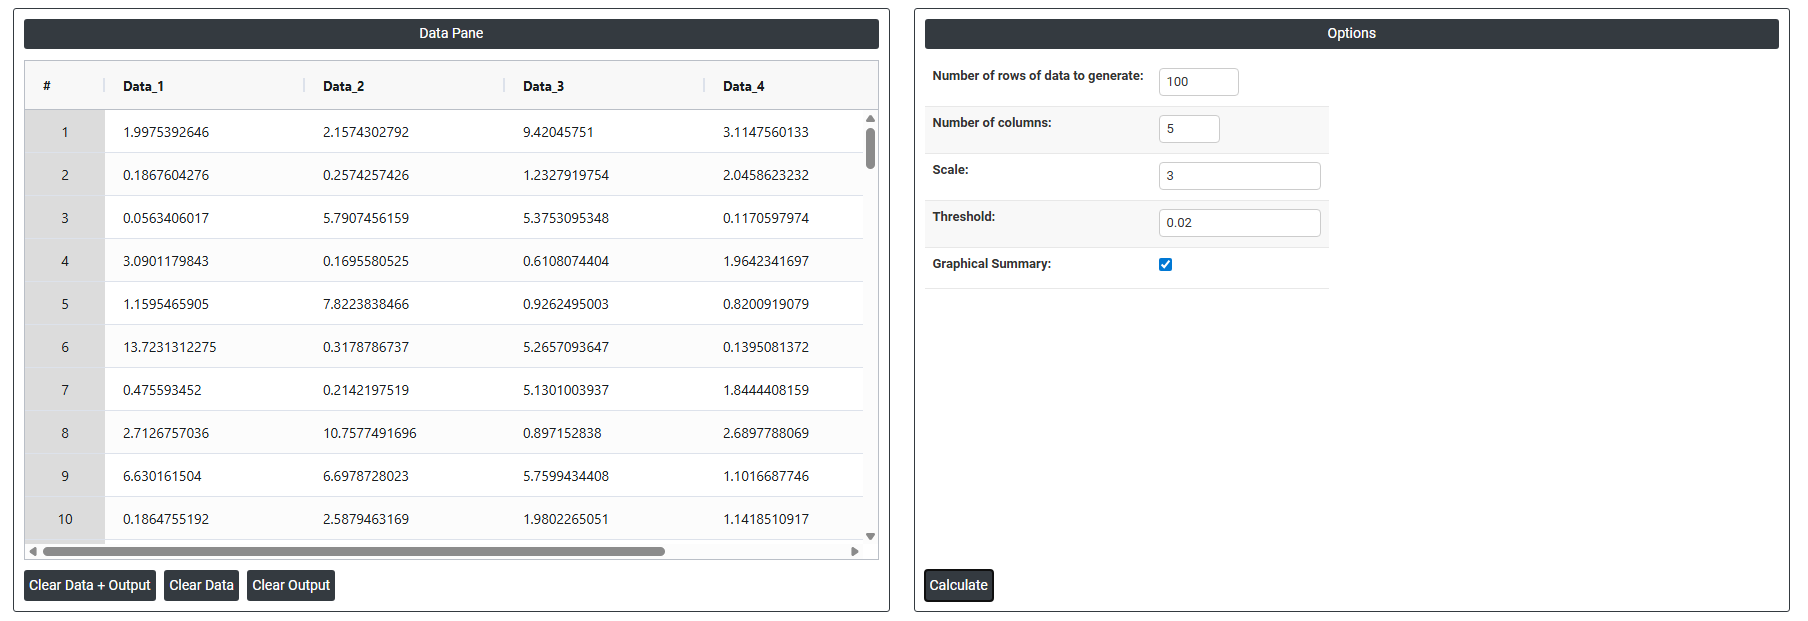
On the dashboard of Random Lognormal Data, the window is separated into two parts.
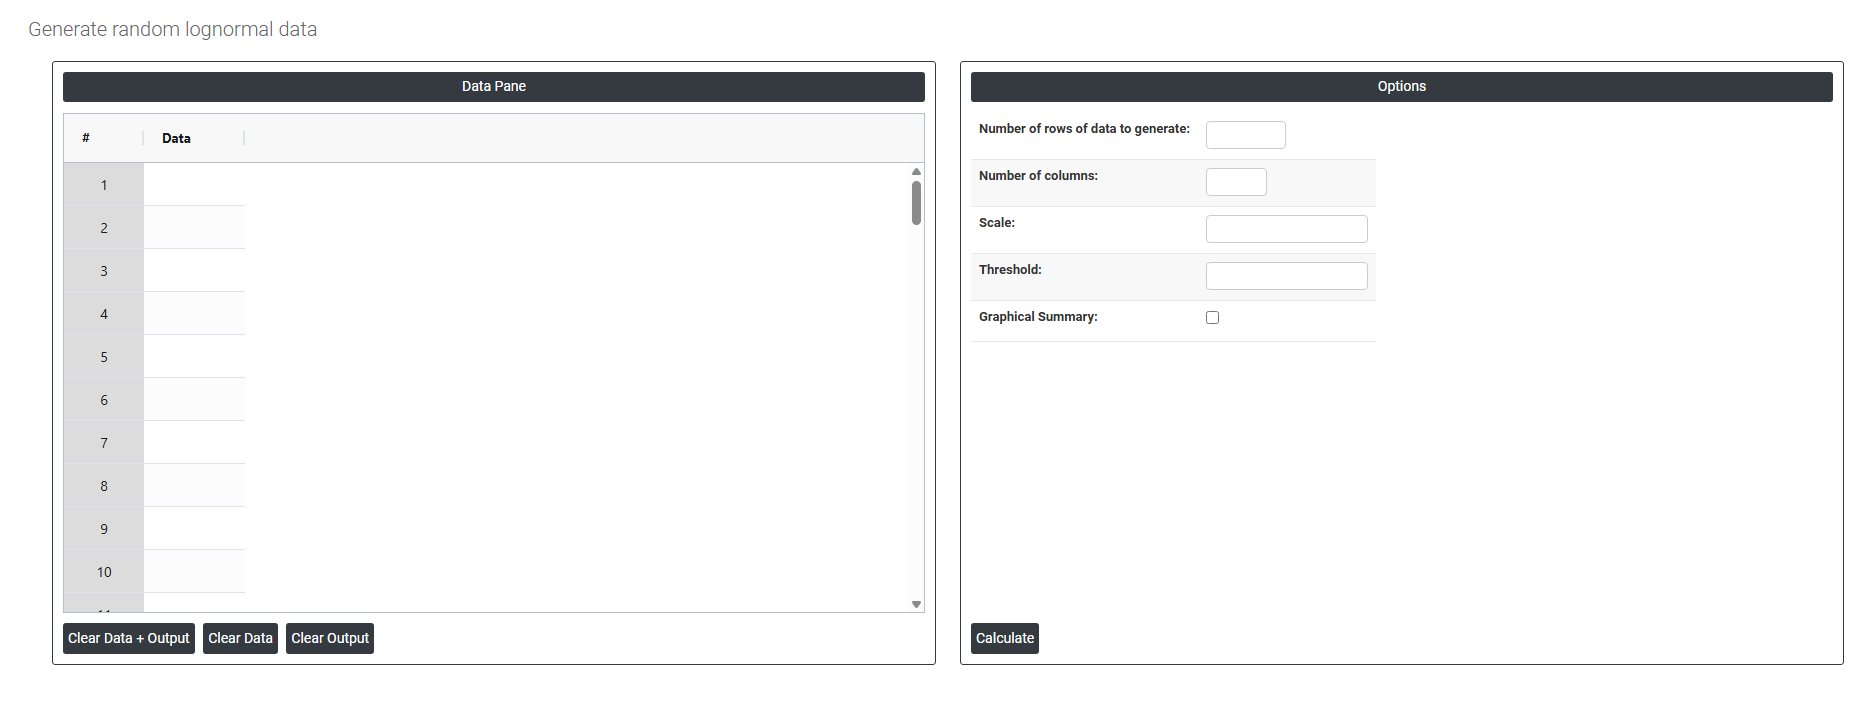
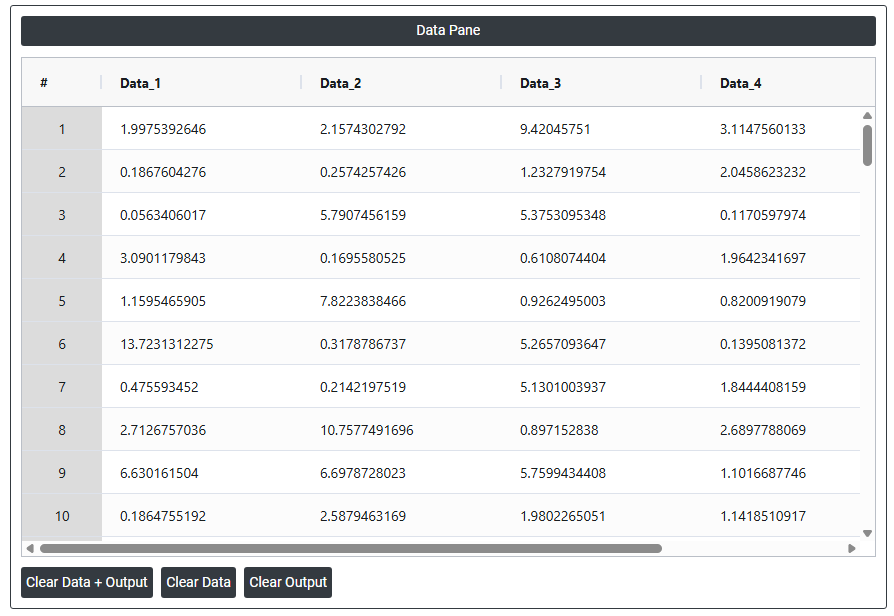
On the left part, Data Pane is present. In the Data Pane, each row makes random data generated. Data will be generated after filling the required options.
On the right part, there are many options present as follows:
- Number of rows of data to generate: Specifies how many random data points to generate. For example, entering 100 will produce exactly 100 rows of random values, all visible in the data pane.
- Number of columns: Specifies how many variables (columns) each row will have. For example, entering 5 will produce 5 columns of randomly generated data side by side in the data pane.
- Scale: Determines the average rate or spread of the exponential distribution used to generate the random data. A larger scale value produces bigger, more spread out numbers; a smaller scale value produces values that cluster closer to zero. All generated data points in the data pane will reflect this spread.
- Threshold: Sets a minimum starting point for the generated data. Instead of the values beginning from zero, the generated numbers will be shifted upward by this amount. For example, setting a threshold of 10 means all generated values will start from 10 and go upward, rather than from 0.
- Graphical summary: After the random data is generated using the mean and standard deviation you specified, this option produces a graphical analysis of that data such as a histogram showing how the generated values are distributed. It is a visual result based on the data that was just created.