What is Compare Variable acceptance sampling?
Compare Variable Acceptance Sampling evaluates and compares multiple sampling plans side by side using their Operating Characteristic (OC) curves. The OC curve shows the probability of accepting a lot at various actual quality levels making it possible to directly compare how protective each plan is across the full range of possible incoming quality.
Simple Definitions: A comparison tool that plots how well different sampling plans perform across all quality levels helping you choose the plan that best balances quality protection with inspection cost.
When to use Compare Variable acceptance sampling?
- Use when selecting from multiple candidate sampling plans and want to compare their protection characteristics objectively.
- Use when negotiating sampling requirements with customers or suppliers and need to demonstrate statistical equivalence or differences.
- Use when reviewing whether an existing plan still meets current quality requirements after a process or product change.
Alternatives: When not to use Compare Variable acceptance sampling
- If you only have one plan to evaluate, use Create Variable Acceptance Sampling to review its OC curve directly.
- If data is attribute-based, use the attribute sampling comparison tools instead.
Example of Compare Variable acceptance sampling
The following steps for Compare Variable acceptance sampling:
- Fill the required options.
2. Now analyses the data with the help of https://qtools.zometric.com/ or https://intelliqs.zometric.com/.
3. To find Compare Variable acceptance sampling choose https://intelliqs.zometric.com/> Statistical module> Sampling >Compare Variable acceptance sampling.
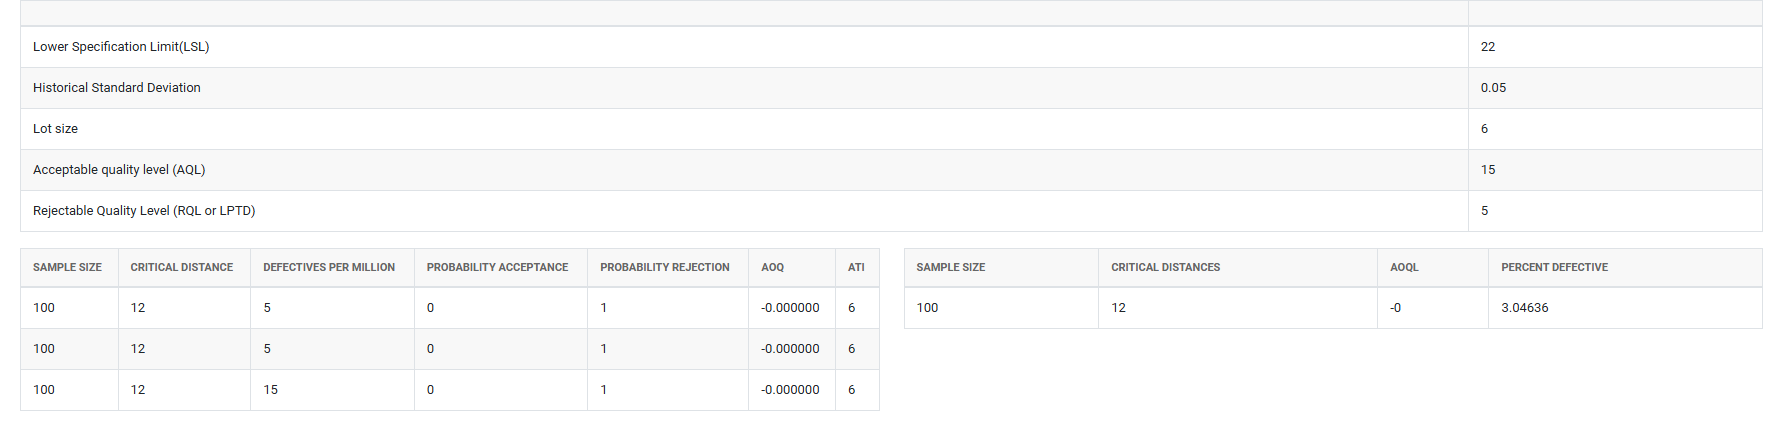
4. After using the above mentioned tool, fetches the output as follows:
How to do Compare Variable acceptance sampling
The guide is as follows:
- Login in to QTools account with the help of https://qtools.zometric.com/ or https://intelliqs.zometric.com/
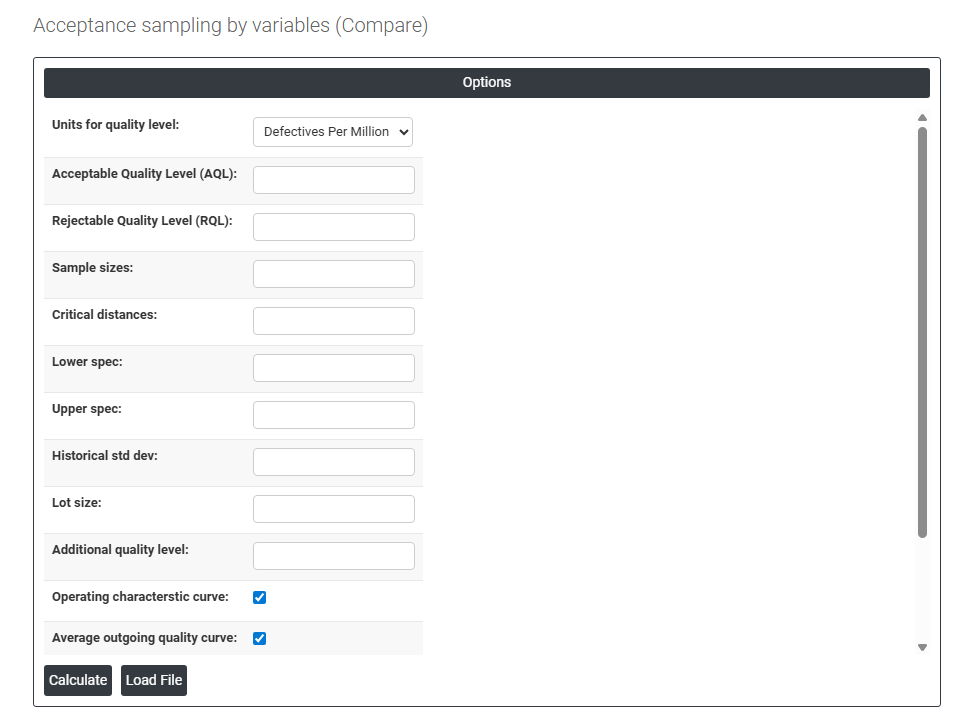
- On the home page, choose Statistical Tool> Sampling>Compare Variable acceptance sampling.
- Next, you need to fill the required options.
- Finally, click on calculate at the bottom of the page and you will get desired results.
On the dashboard of Compare Variable acceptance sampling, the window is separated into two parts.
Load example: Sample data will be loaded.
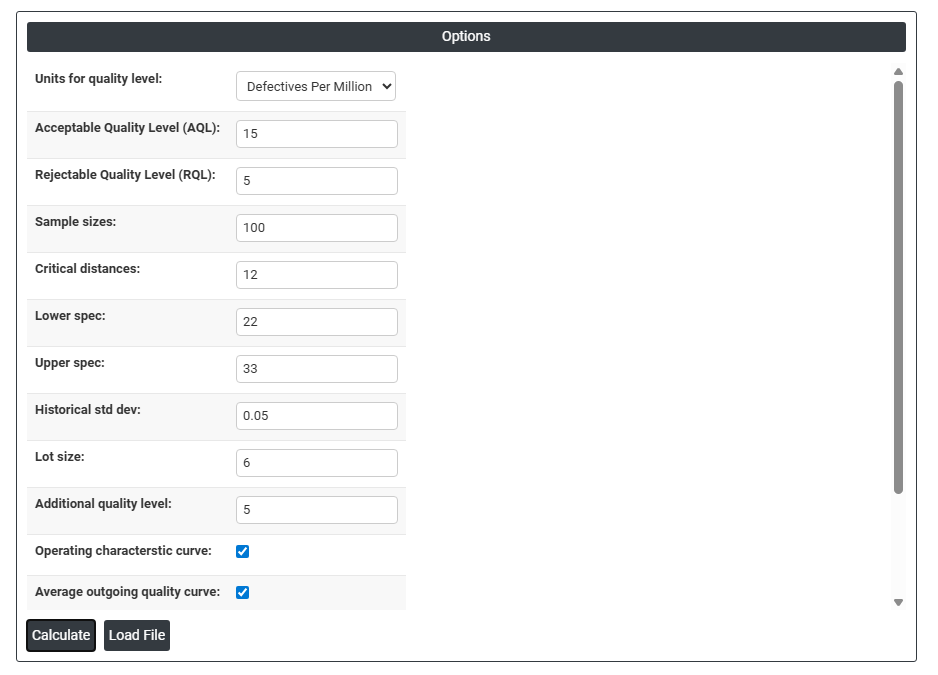
On the right part, there are many options present as follows:
- Acceptable Quality Level (AQL): The quality level at which the plan should have a high probability of accepting the lot representing acceptable producer quality. Lots at this quality level should be accepted most of the time.
- Rejectable Quality Level (RQL): The quality level at which the plan should have a high probability of rejecting the lot representing unacceptably poor quality from the consumer's perspective. Also known as LTPD (Lot Tolerance Percent Defective).
- Sample Sizes: Enter the sample sizes of the plans you want to compare. Multiple sample sizes can be entered to evaluate how increasing or decreasing inspection effort affects plan performance.
- Critical Distances: The acceptance criterion values (k values) associated with each plan being compared. The critical distance defines the minimum standardised distance between the sample mean and the specification limit required to accept the lot.
- Lower Spec / Upper Spec: Specification limits for the characteristic being evaluated used to calculate the proportion non-conforming at each quality level on the comparison curves.
- Historical Std Dev: Known process standard deviation used in the plan calculations. If provided, known-sigma plans are compared; if left blank, unknown-sigma plans are used.
- Lot Size: Total batch size used in AOQ and ATI curve calculations across all plans being compared.
- Additional Quality Level: Enter a specific quality level at which you want to read off and compare the exact probability of acceptance for each plan useful for directly comparing plan performance at a specific quality point of interest.
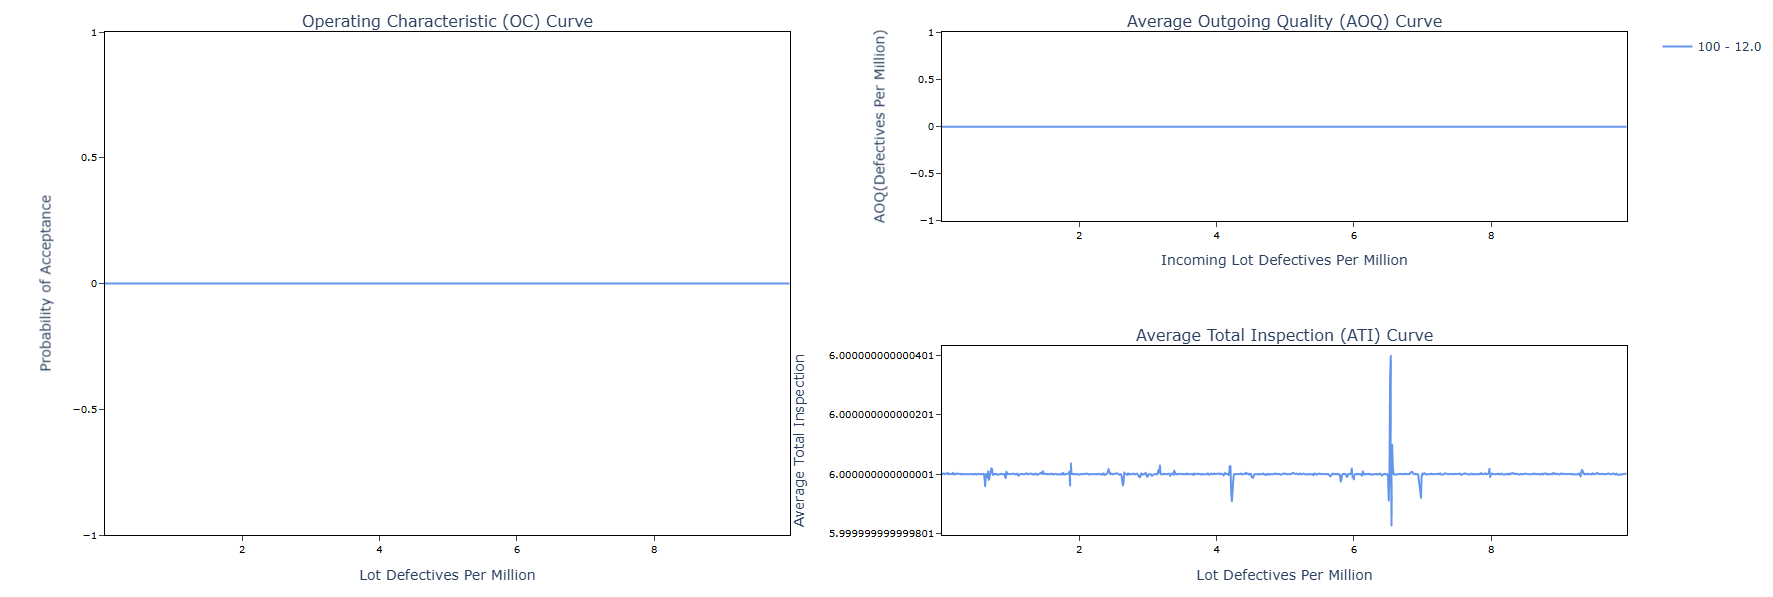
- Operating Characteristic (OC) Curve: When checked, displays the probability of lot acceptance plotted against actual lot quality showing how the plan performs across the full range of possible incoming quality levels.
- Average Outgoing Quality (AOQ) Curve: When checked, displays the average quality of lots leaving the inspection process after rejected lots are 100% inspected and defectives replaced showing the worst-case outgoing quality level (AOQL).
- Average Total Inspection (ATI) Curve: When checked, displays the average number of items inspected per lot across all quality levels combining sampled items from accepted lots with 100% inspected items from rejected lots.
- Plot on One Page: When checked, displays all selected curves together on a single page for easy comparison.
- Download as Excel: This will display the result in an Excel format, which can be easily edited and reloaded for calculations using the load file option.