What is Demonstration Test Plans?
A Demonstration Test Plan determines how many units to test and for how long to prove with a specified confidence level that a product meets a minimum reliability target. The goal is not to estimate the failure rate but to confirm the product survives a defined period without failure, providing statistical evidence of reliability compliance.
Simple Definitions: A test plan that tells you exactly how many units to test and for how long to prove with statistical confidence that your product meets its reliability target before launch or regulatory submission.
When to use Demonstration Test Plans?
• Use to demonstrate compliance with a minimum reliability specification for a new product or component.
• Use when testing must be completed without observing failures — the plan calculates the required sample size for zero-failure demonstration.
• Use during product qualification, regulatory submission, or customer approval where formal reliability evidence is required.
Guidelines for correct usage of Demonstration Test Plans
- Specify the minimum acceptable reliability and confidence level clearly — these directly determine required test size and duration.
- Choose a validated failure time distribution (e.g. Weibull, Exponential) matching the product's known failure behaviour.
- Ensure test conditions accurately represent real-world operating conditions.
Alternatives: When not to use Demonstration Test Plans
- If the goal is to estimate the actual failure rate or MTTF, use Estimation Test Plans
- If failures are observed during testing, use Parametric Distribution Analysis to model the failure distribution from observed data.
Example of Demonstration Test Plans
The following steps for Demonstration Test Plans:
- Fill the required options.
2. Now analyses the data with the help of https://qtools.zometric.com/ or https://intelliqs.zometric.com/.
3. To find Demonstration Test Plans choose https://intelliqs.zometric.com/> Statistical module> Reliability>Demonstration Test Plans.
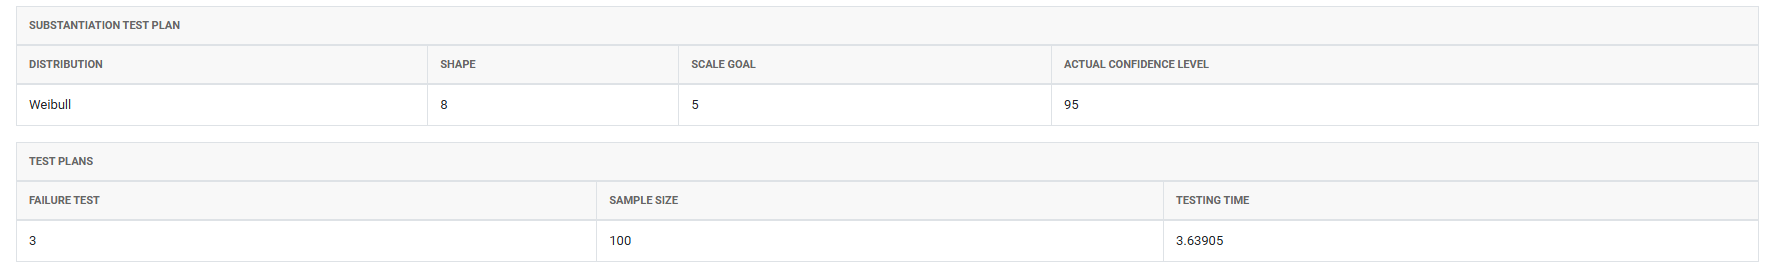
4. After using the above mentioned tool, fetches the output as follows:
How to do Demonstration Test Plans
The guide is as follows:
- Login in to QTools account with the help of https://qtools.zometric.com/ or https://intelliqs.zometric.com/
- On the home page, choose Statistical Tool> Reliability>Demonstration Test Plans.
- Next, you need to fill the required options.
- Finally, click on calculate at the bottom of the page and you will get desired results.
On the dashboard of Demonstration Test Plans, the window is separated into two parts.
Load example: Sample data will be loaded.
Load File: It is used to directly load the excel data.
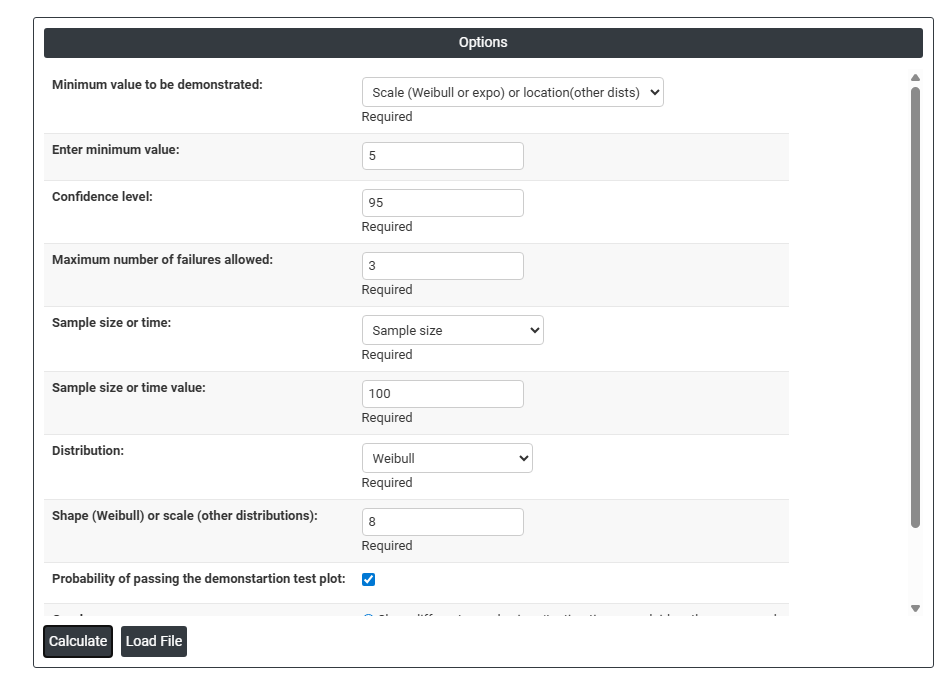
On the right part, there are many options present as follows:
- Minimum Value to Be Demonstrated: Defines what reliability characteristic you are trying to prove meets a minimum acceptable threshold. For Weibull or Exponential distributions, this is the scale parameter (characteristic life); for other distributions, it is the location parameter (e.g. mean life).
- Enter Minimum Value: The actual numeric threshold for the reliability parameter being demonstrated for example, a minimum mean life of 10,000 hours or a minimum B10 life of 5,000 cycles.
- Confidence Level: The statistical certainty with which you want to demonstrate the minimum value is met. A 95% confidence level means that if the product truly meets the minimum requirement, the test will successfully demonstrate this 95% of the time.
- Maximum Number of Failures Allowed: The maximum number of failures permitted during the test while still passing the demonstration. Setting this to zero means the test must be completed with no failures observed requiring a larger sample or longer test duration.
- Sample Size or Testing Time: Choose whether to specify the test plan in terms of a fixed number of units to test (Sample Size) or a fixed duration each unit is tested for (Testing Time per Unit). Both define the total test effort required.
- Sample Size or Time Value: Enter the actual numeric value for the chosen option the number of units to test or the test duration per unit.
- Distribution: Select the statistical model that best represents how your product fails over time Weibull, Exponential, Normal, Lognormal, and others are available. The choice should be based on engineering knowledge or prior failure data.
- Shape (Weibull) or Scale (Other Distributions): For Weibull, enter the assumed shape parameter (beta) that defines the failure rate behaviour less than 1 for early failures, 1 for constant rate, greater than 1 for wear-out. For other distributions, enter the assumed scale parameter.
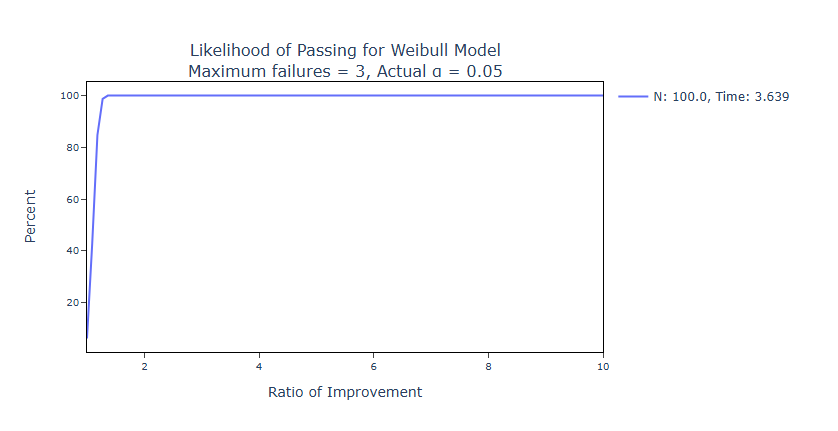
- Probability of Passing the Demonstration Test Plot: When checked, displays a graph showing the probability that the test will be passed as a function of the true underlying reliability helping you understand how the test plan performs across a range of actual product quality levels.
- Graphs — Show Different Sample Sizes / Test Times Overlaid: Displays multiple test plan scenarios on the same graph for example, how the pass probability changes if you test 10, 20, or 30 units making it easy to compare and select the most practical plan.
- Graphs — Show Different Test Plans Overlaid: Displays multiple complete test plan configurations (different combinations of sample size, test time, and allowed failures) on the same graph for direct side-by-side comparison.