What is Warranty Prediction ?
Warranty Prediction uses a fitted reliability model to forecast the number of future warranty returns expected over a specified period. This enables manufacturers to estimate warranty reserve costs, plan service capacity, and detect potential quality problems before they accumulate into significant liabilities.
Simple Definitions: A forecasting tool that uses your product's failure history to predict how many warranty returns to expect in the future enabling proactive cost planning, staffing, and spare parts management.
When to use Warranty Prediction?
- Use when existing warranty return or field failure data is available and you want to project future return volumes.
- Use for financial warranty reserve estimation and quantifying expected liability from units currently in the field.
- Use when new units are being shipped into the field at a known rate and you need to account for the growing at-risk population.
Guidelines for correct usage of Warranty Prediction
- Ensure the underlying reliability model fits the historical data well before generating forecasts a poor-fit model produces unreliable predictions.
- Account accurately for the future shipment plan predictions are highly sensitive to assumed volumes of new units entering the field.
- Update the model regularly as new return data accumulates early field data may not represent long-term behaviour.
Alternatives: When not to use Warranty Prediction
- If no historical failure data exists, run Demonstration or Estimation Test Plans first to generate reliability estimates before attempting predictions.
- If product design has changed significantly since the historical data was collected, past return data may not be representative collect new data for the updated design.
Example of Warranty Prediction
A reliability engineer aims to forecast warranty claims due to defective refrigerator compressors. They gather and assess monthly failure data from the past year. The failure patterns are modeled using a Weibull distribution. By organizing and refining the warranty data, the engineer can predict future warranty claims accurately. The following steps:
- Gathered the necessary data.
2. Now analyses the data with the help of https://qtools.zometric.com/ or https://intelliqs.zometric.com/.
3. To find Warranty Prediction choose https://intelliqs.zometric.com/> Statistical module> Reliability>Warranty Prediction.
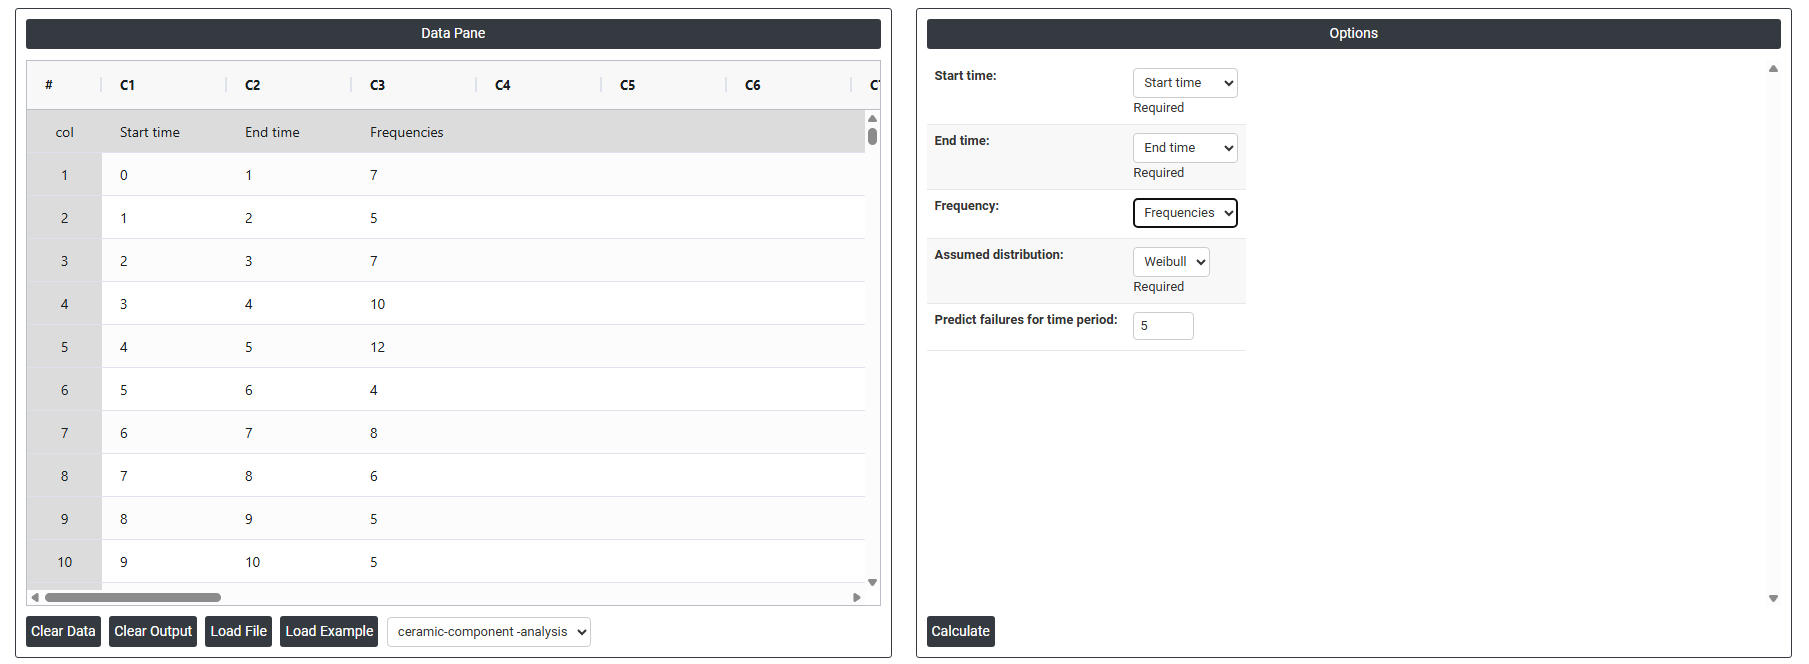
4. Inside the tool, feed the data along with other inputs as follows:
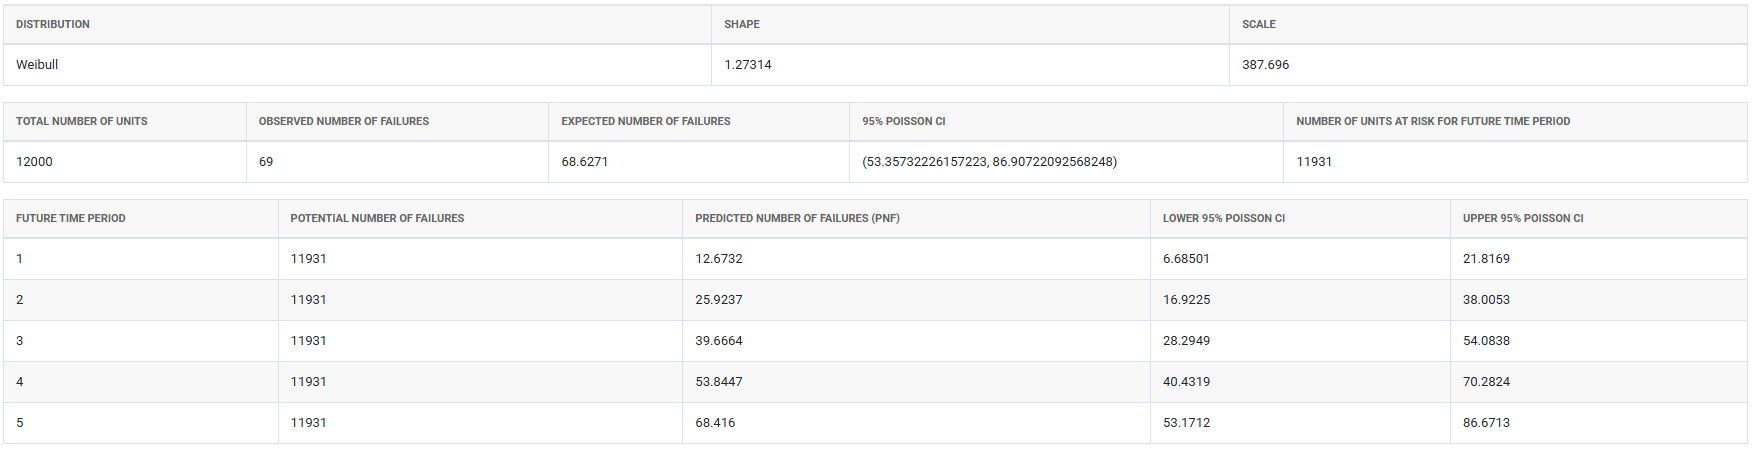
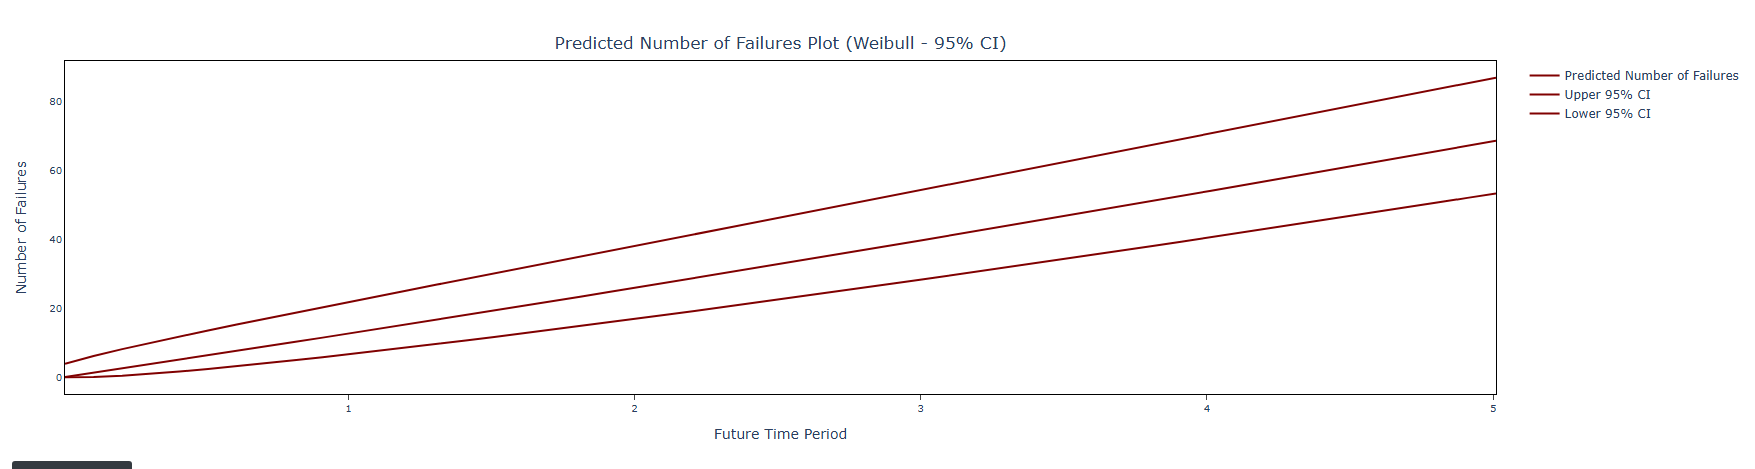
5. After using the above mentioned tool, fetches the output as follows:
How to do Warranty Prediction
The guide is as follows:
- Login in to QTools account with the help of https://qtools.zometric.com/ or https://intelliqs.zometric.com/
- On the home page, choose Statistical Tool> Reliability>Warranty Prediction.
- Next, update the data manually or can completely copy (Ctrl+C) the data from excel sheet or paste (Ctrl+V) it or else there is say option Load Example where the example data will be loaded.
- Next, you need to fill the required options.
- Finally, click on calculate at the bottom of the page and you will get desired results.
On the dashboard of Warranty Prediction, the window is separated into two parts.
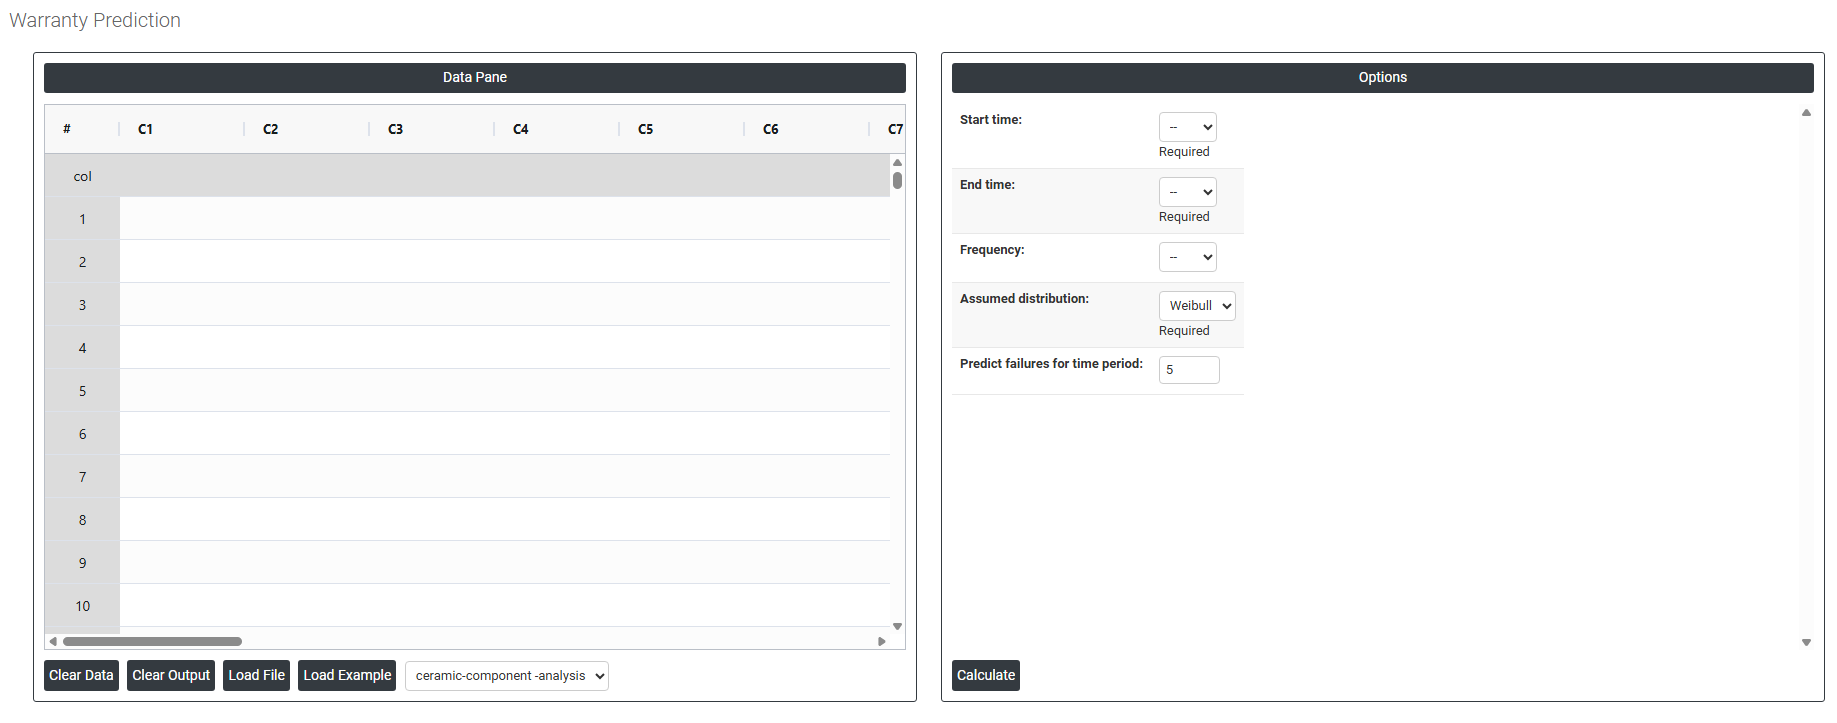
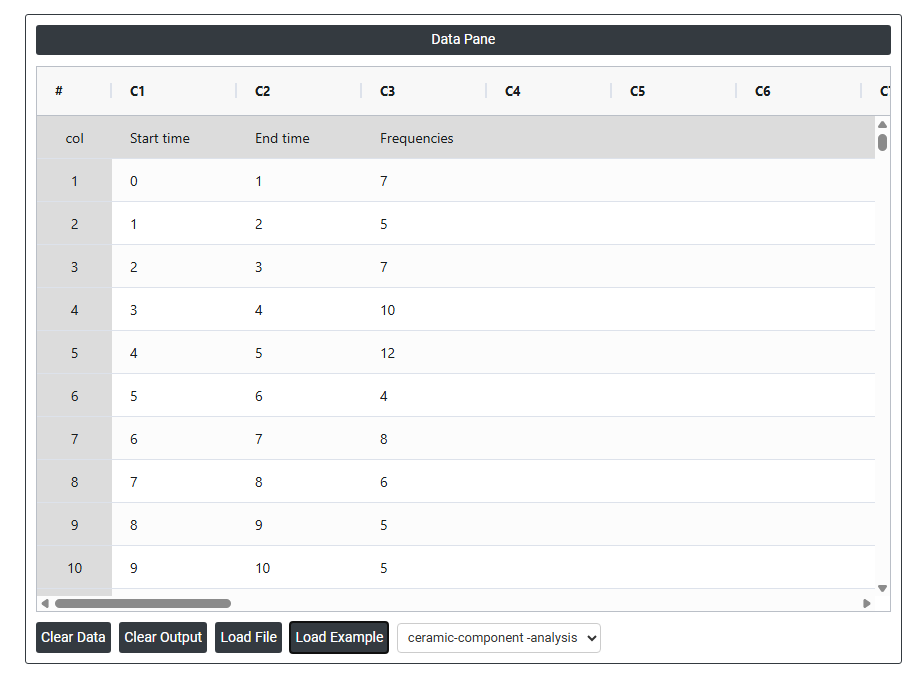
On the left part, Data Pane is present. In the Data Pane, each row makes one subgroup. Data can be fed manually or the one can completely copy (Ctrl+C) the data from excel sheet and paste (Ctrl+V) it here.
Load example: Sample data will be loaded.
On the right part, there are many options present as follows:
- Start Time: Select the column containing the beginning of each time period in the warranty data typically the calendar date or month when units began accumulating time in service.
- End Time: Select the column containing the end of each time period. Together with Start Time, this defines the interval during which returns are counted and the in-service exposure is calculated.
- Frequency: Select the column containing the number of warranty returns (failures) recorded in each start-to-end time interval. This is the count of units that failed and were returned during each period.
- Assumed Distribution: Select the statistical model used to describe the product's failure time behaviour. Weibull is the default and most commonly used distribution for reliability and warranty modelling, as it can represent early-life, random, and wear-out failure modes depending on the shape parameter.
- Predict Failures for Time Period: Enter the future time period over which you want to forecast warranty returns for example, the next 12 months or the next 3 years. The model uses the fitted distribution and the known at-risk population to project how many returns are expected during this future window.