What is Parametric Distribution Analysis- (Right Censoring)?
Parametric Distribution Analysis fits a theoretical statistical distribution — such as Weibull, Lognormal, or Exponential — to failure time data that includes right-censored observations. Right-censored units are items that have not yet failed at the time of data collection. Correctly accounting for these survivors produces unbiased estimates of reliability parameters such as MTTF, B10 life, failure rate, and survival probability.
Simple Definitions: A statistical tool that fits a failure time model to your data even when many units are still running and have not yet failed giving accurate, unbiased estimates of how long your product will last.
When to use Parametric Distribution Analysis- (Right Censoring)?
- Use when failure time data includes both failed units and survivors (right-censored observations) from life testing or field data.
- Use to estimate MTTF, B-life percentiles, failure rate, and reliability at specific times.
- Use to identify the best-fitting failure time distribution use Individual Distribution Identification first if the correct distribution is unknown.
Guidelines for correct usage of Parametric Distribution Analysis- (Right Censoring)
- Always identify right-censored observations explicitly treating surviving units as failures severely underestimates reliability.
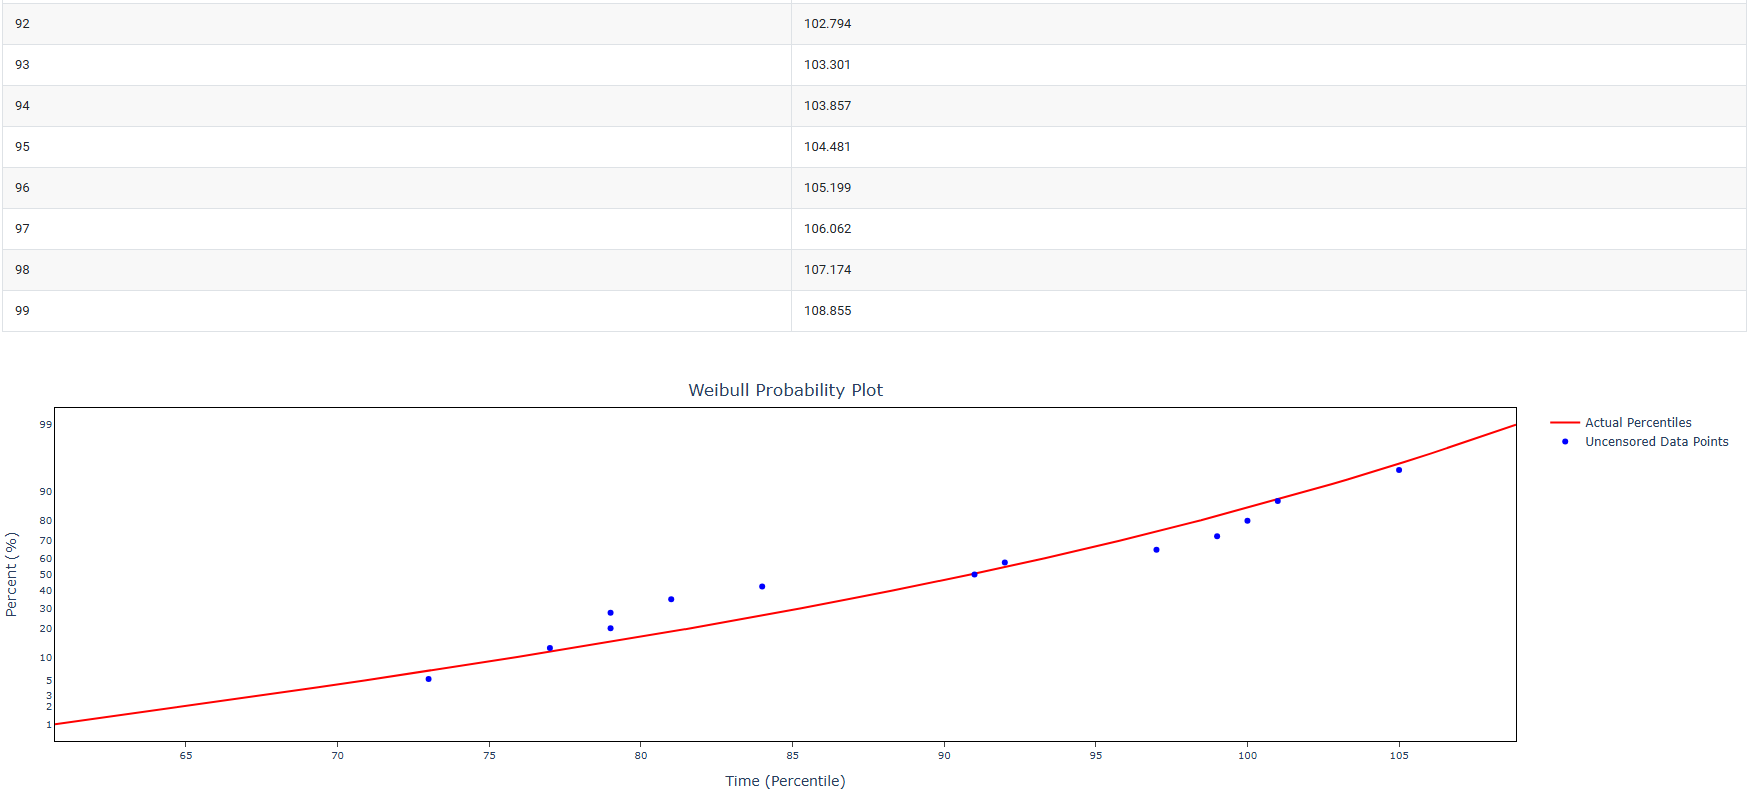
- Use probability plots and goodness-of-fit statistics to verify the chosen distribution fits the data well before interpreting estimates.
- Ensure test conditions represent actual use conditions if accelerated testing was used, apply the appropriate acceleration factor.
Alternatives: When not to use Parametric Distribution Analysis- (Right Censoring)
- If the system is repairable and fails multiple times, use Parametric Growth Curve
- If no distributional assumption can be justified, use Nonparametric Distribution Analysis
- If all units have failed with no censoring, standard distribution fitting without censoring is sufficient and simpler.
Example of Parametric Distribution Analysis- (Right Censoring)
A reliability engineer examines the failure rates of engine windings in turbine assemblies to determine the times at which the windings fail. At elevated temperatures, the windings may degrade more quickly. The engineer records failure times for the engine windings at both 80°C and 100°C, though some units need to be removed from the test before they fail, resulting in right-censored data. The following steps:
- Gathered the necessary data.
2. Now analyses the data with the help of https://qtools.zometric.com/ or https://intelliqs.zometric.com/.
3. To find Parametric Distribution Analysis- (Right Censoring) choose https://intelliqs.zometric.com/> Statistical module> Reliability>Parametric Distribution Analysis- (Right Censoring).
4. Inside the tool, feed the data along with other inputs as follows:
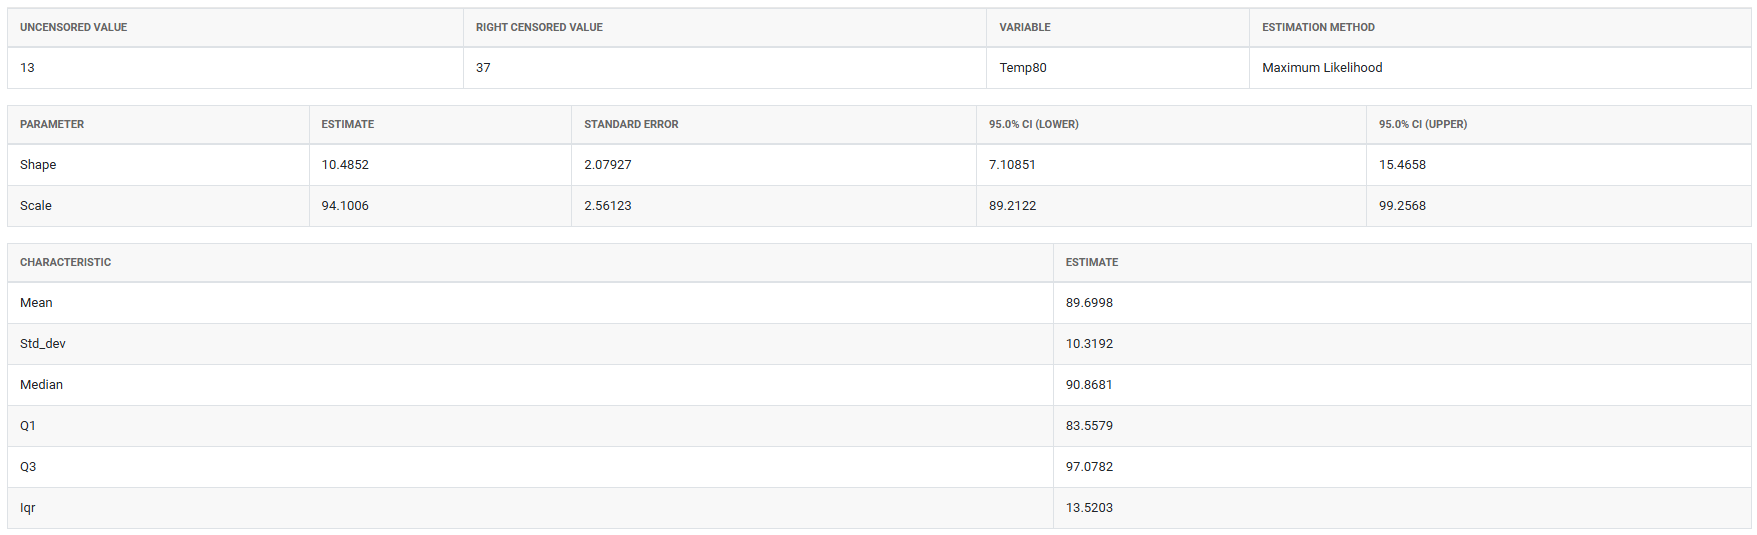
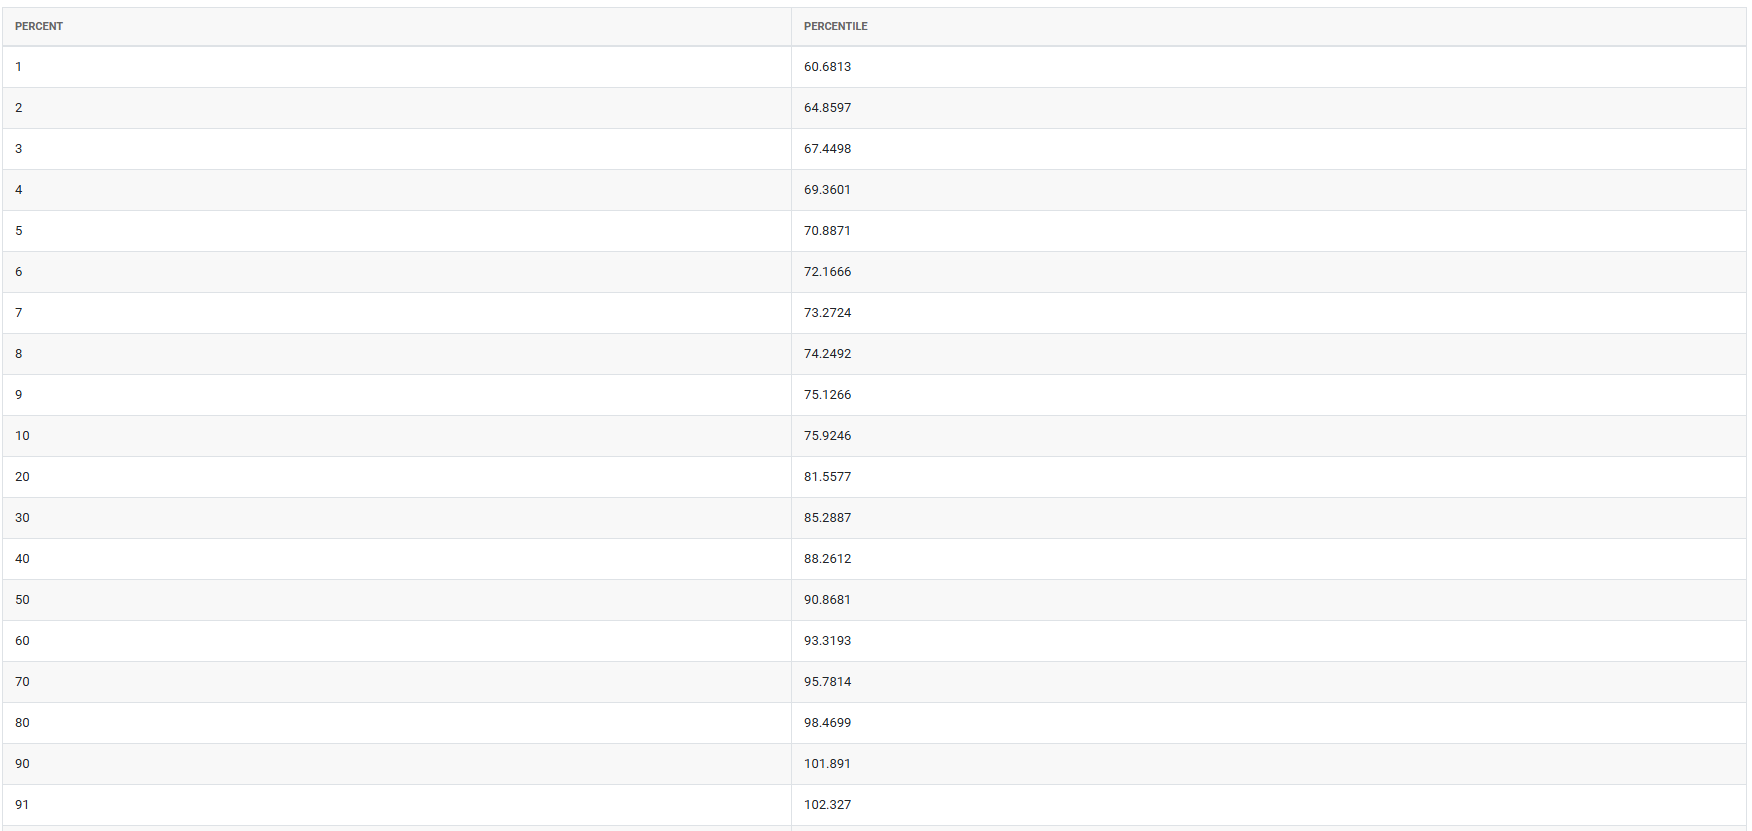
5. After using the above mentioned tool, fetches the output as follows:
How to do Parametric Distribution Analysis- (Right Censoring)
The guide is as follows:
- Login in to QTools account with the help of https://qtools.zometric.com/ or https://intelliqs.zometric.com/
- On the home page, choose Statistical Tool> Reliability>Parametric Distribution Analysis- (Right Censoring).
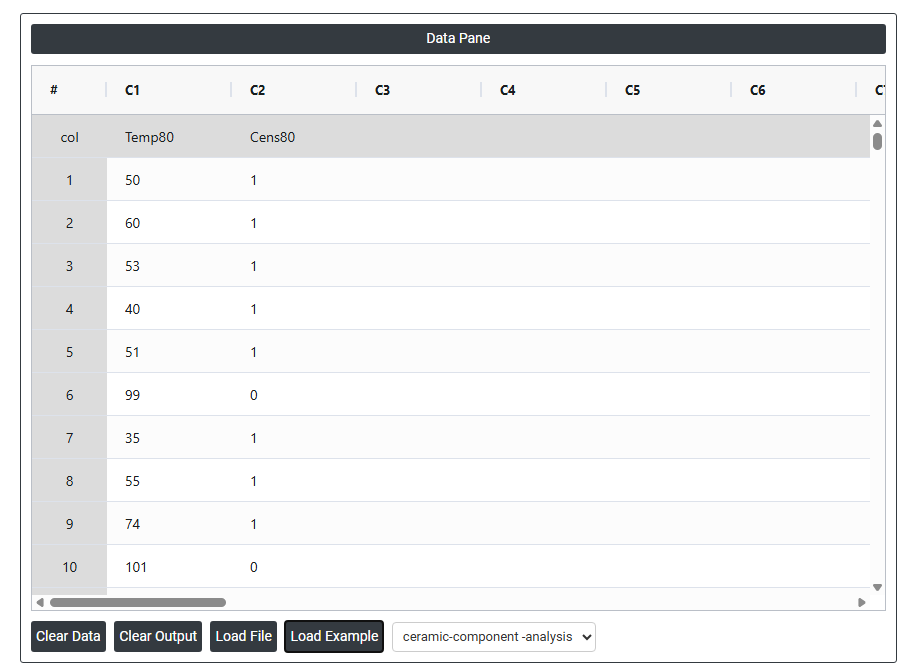
- Next, update the data manually or can completely copy (Ctrl+C) the data from excel sheet or paste (Ctrl+V) it or else there is say option Load Example where the example data will be loaded.
- Next, you need to fill the required options.
- Finally, click on calculate at the bottom of the page and you will get desired results.
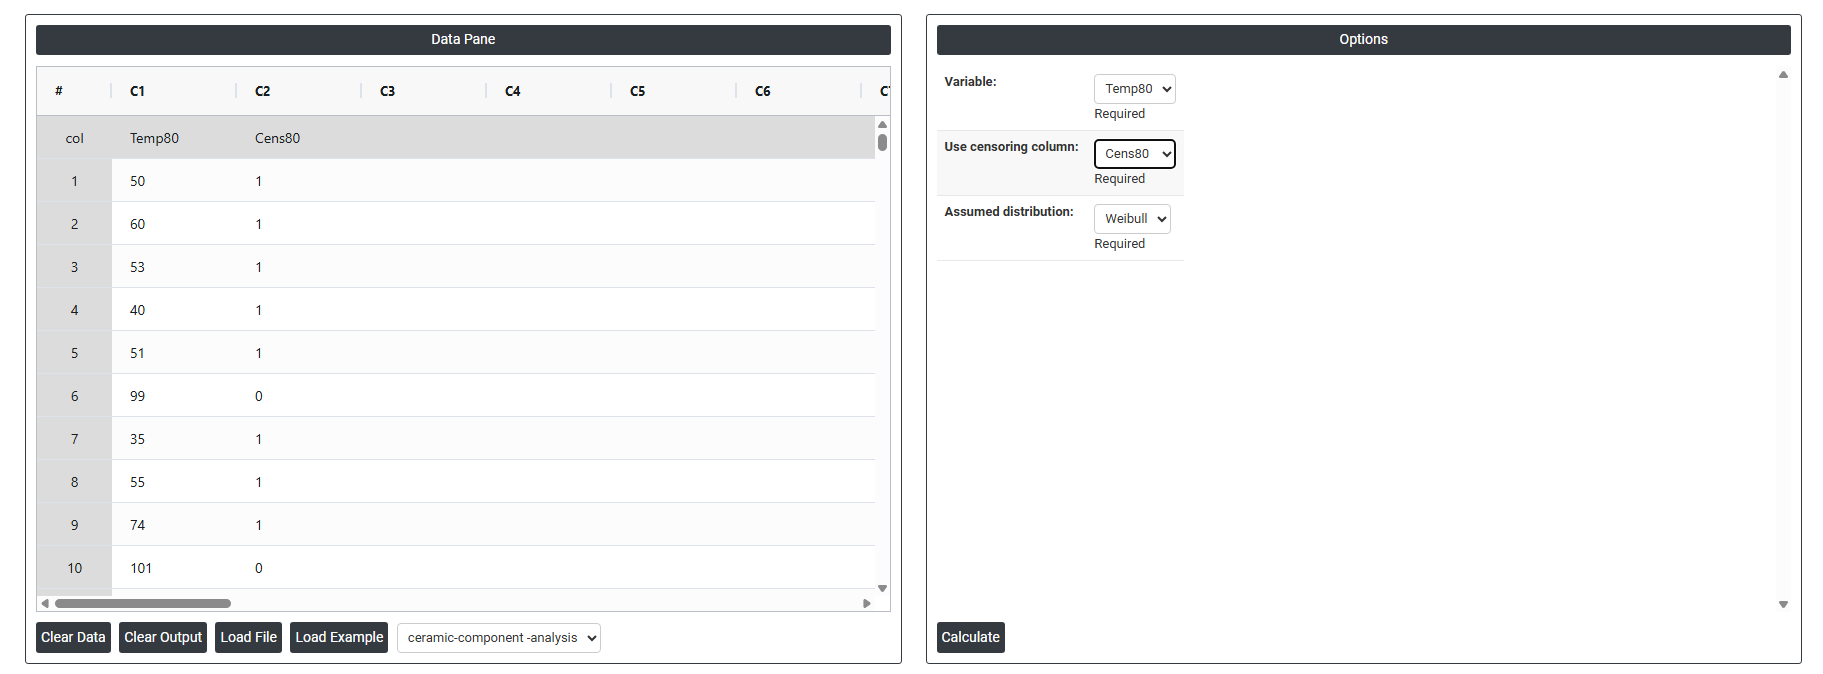
On the dashboard of Parametric Distribution Analysis- (Right Censoring), the window is separated into two parts.
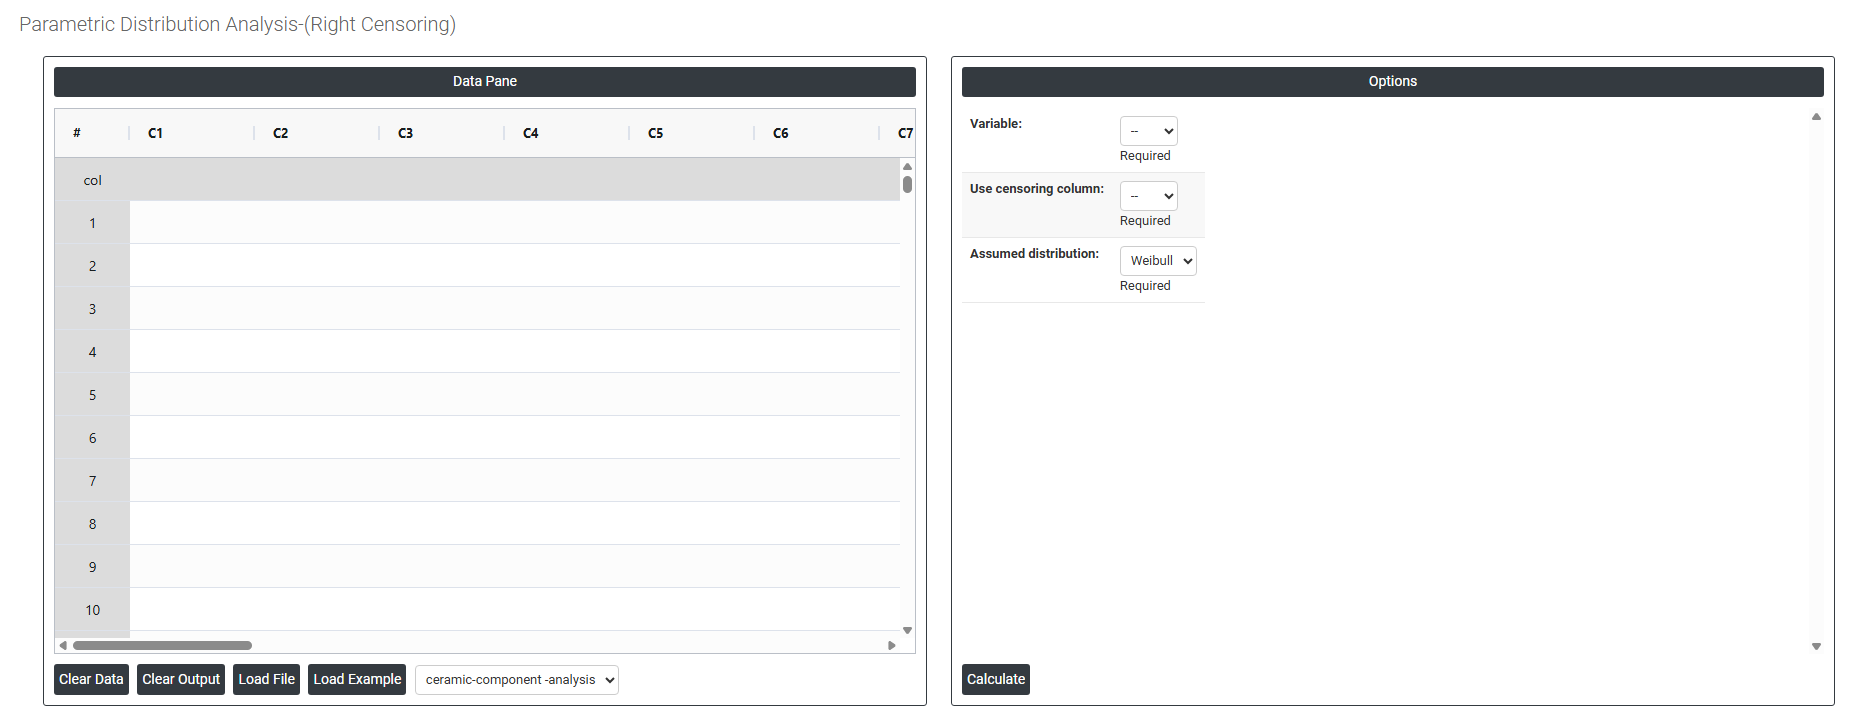
On the left part, Data Pane is present. In the Data Pane, each row makes one subgroup. Data can be fed manually or the one can completely copy (Ctrl+C) the data from excel sheet and paste (Ctrl+V) it here.
Load example: Sample data will be loaded.
On the right part, there are many options present as follows:
- Variable: Select the column containing the failure times or survival times for each unit in the dataset the actual observed time at which each unit failed, or the time at which observation ended for units that had not yet failed.
- Use Censoring Column: Select the column that indicates the censoring status of each observation. A common coding is 1 = failed (exact failure time known) and 0 = censored (unit still running at the observation end time). This column is essential for correctly distinguishing failed units from survivors without it, all observations would be incorrectly treated as failures.
- Assumed Distribution: Select the theoretical failure time distribution to fit to the data. Weibull is the default and most widely used for reliability analysis. The choice should be guided by engineering knowledge, historical data, or the output of an Individual Distribution Identification analysis. The fitted distribution determines all downstream reliability estimates including MTTF, B-life, and survival probability.