What is Orthogonal Regression?
Orthogonal Regression (also known as Deming Regression or Errors-in-Variables Regression) is a statistical method used to determine the relationship between two measurement systems or two continuous variables when both variables contain measurement error — not just the response variable. Unlike standard regression, which assumes only the Y variable has error, orthogonal regression accounts for uncertainty in both the X and Y measurements simultaneously, producing a more accurate and unbiased line of best fit.
It is most commonly used to assess whether two measurement methods, instruments, or laboratories produce equivalent results — for example, comparing a new test method against an established reference method to determine if they can be used interchangeably.
When to use Orthogonal Regression?
- Use when you want to compare two measurement methods to determine whether they produce equivalent results on the same set of items.
- Use when both variables being compared contain measurement error — if only the Y variable has error, use standard Fit Line Model instead.
- Use when the goal is to establish method equivalence or interchangeability — for example, validating a faster or cheaper test method against an accepted reference standard.
- Use when you need to estimate the true relationship between two variables that are both measured imprecisely, rather than using a relationship distorted by ignoring X-variable error.
- Use in laboratory, clinical, manufacturing, and calibration studies where measurement system comparison is a core requirement.
Guidelines for correct usage of Orthogonal Regression
- Both variables must be continuous — orthogonal regression is not appropriate for categorical or attribute data.
- The error variance ratio (the ratio of X measurement error variance to Y measurement error variance) must be specified or estimated — the default assumption is that both variables have equal measurement error (ratio = 1), but this should be verified or adjusted based on known measurement system capability.
- Collect sufficient data pairs — measure the same set of items with both methods. A minimum of 30 to 50 paired observations is recommended to produce stable and reliable estimates of the regression line.
- Ensure that the range of items measured covers the full operational range of interest — a narrow measurement range will produce unreliable slope and intercept estimates and make method equivalence conclusions difficult to support.
- After fitting, examine the confidence interval for the slope — if the interval contains 1.0, the two methods have proportionally equivalent responses. Examine the confidence interval for the intercept — if it contains 0, there is no fixed systematic bias between the methods.
- Check residual plots to verify that the model assumptions are met and that no unusual observations are disproportionately influencing the fitted line.
- Do not extrapolate conclusions beyond the range of items tested — the equivalence of the two methods is only demonstrated within the measured range.
Alternatives: When not to use Orthogonal Regression
- If only the response variable (Y) contains measurement error and the predictor (X) is measured with negligible error or is a controlled, exact value, use Fit Line Model or Fit Regression Model instead — orthogonal regression would overcorrect and produce a biased slope estimate.
- If the goal is to predict a response from predictors rather than compare two measurement systems, use Fit Regression Model instead — orthogonal regression is specifically designed for method comparison, not prediction.
- If the error variance ratio is completely unknown and cannot be estimated from a measurement system study, the results of orthogonal regression will be unreliable — conduct a Gauge R&R or measurement system analysis first to quantify the error in each variable before proceeding.
- If you have more than two variables to compare or model simultaneously, use Fit Regression Model or Multivariate analysis instead.
- If the two variables being compared are on different scales or measuring fundamentally different characteristics, a method comparison study is not appropriate — orthogonal regression requires both variables to measure the same underlying quantity.
- If the response variable is categorical or binary, use Logistic Regression instead.
Example of Orthogonal Regression
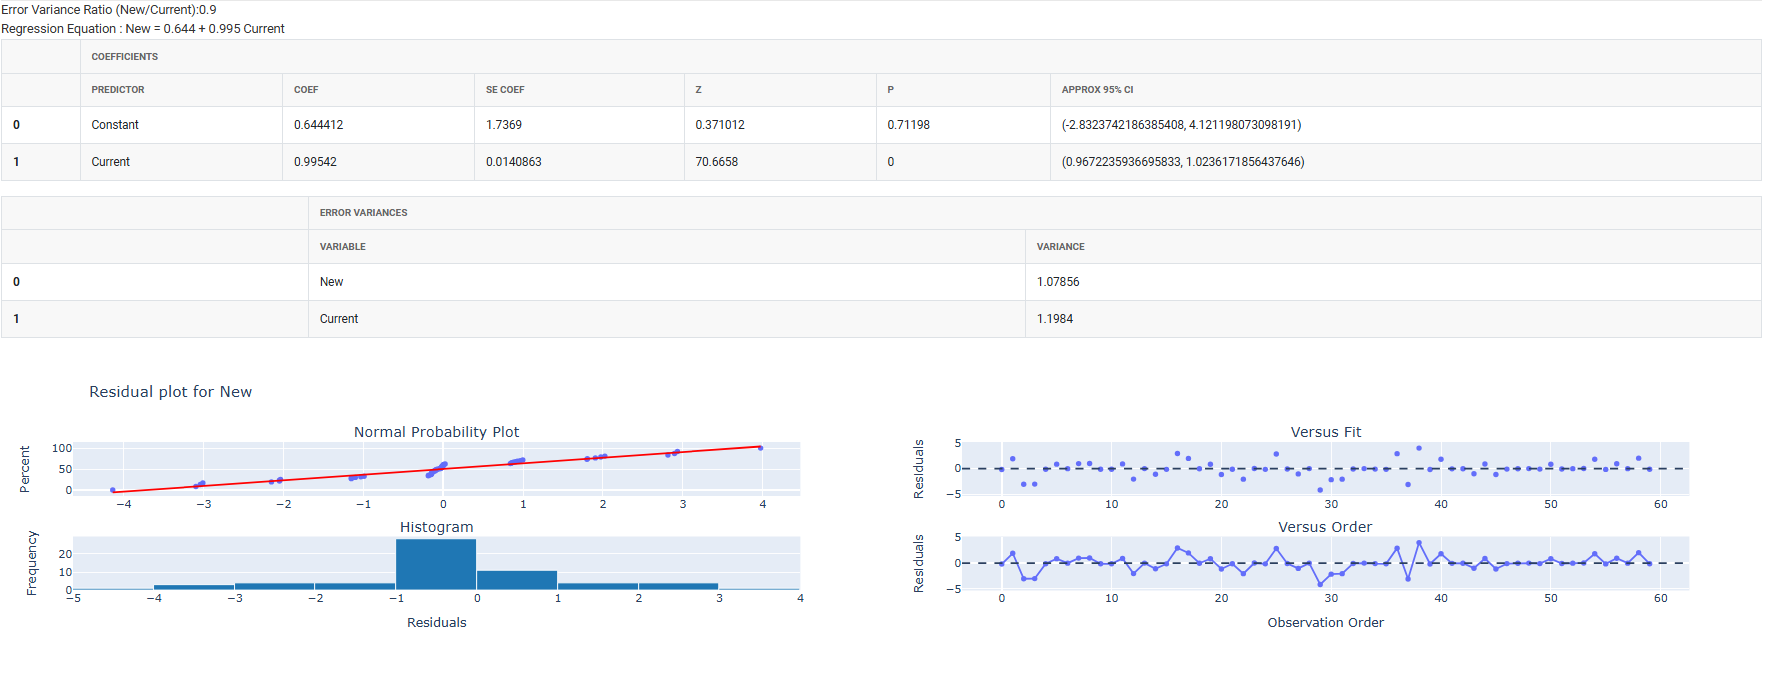
An engineer compares a new blood pressure monitor with an existing device by measuring systolic blood pressure for 60 individuals using both instruments. To assess equivalence, orthogonal regression is used since both devices have measurement error.From prior studies, the variance of the new monitor is 1.08 and that of the existing monitor is 1.20. The new monitor is treated as the response and the existing device as the predictor, giving an error variance ratio of 0.90 for the analysis. The following steps:
- Gathered the necessary data.
- Now analyses the data with the help of https://qtools.zometric.com/ or https://intelliqs.zometric.com/.
- To find Orthogonal Regression choose https://intelliqs.zometric.com/> Statistical module> Regression>Orthogonal Regression.
- Inside the tool, feed the data along with other inputs as follows:
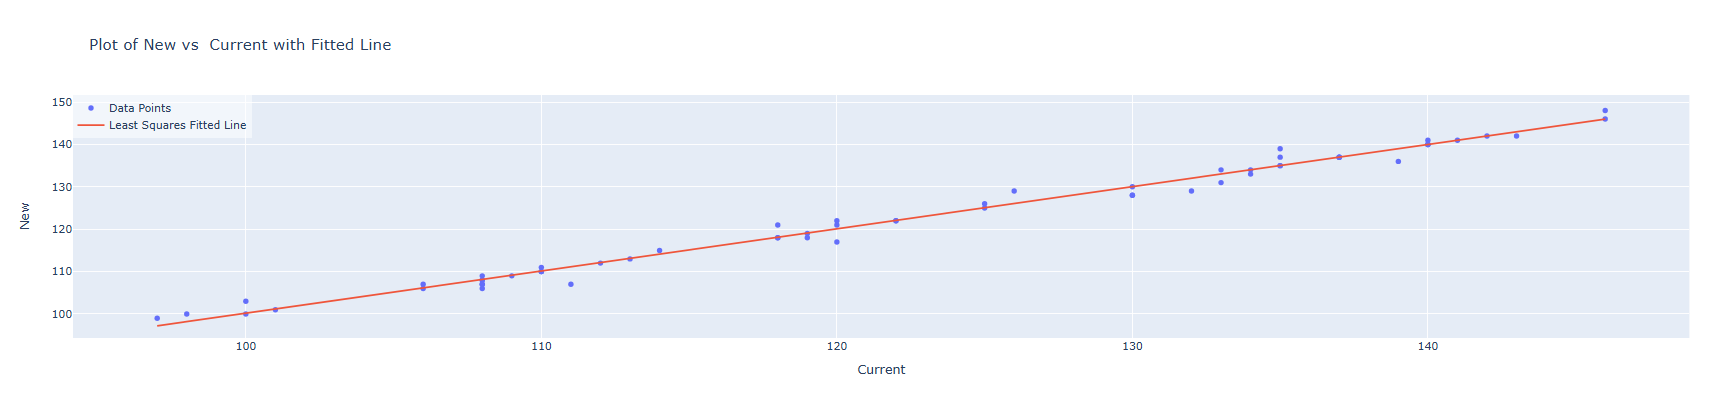
5. After using the above mentioned tool, fetches the output as follows
How to do Orthogonal Regression
The guide is as follows:
- Login in to QTools account with the help of https://qtools.zometric.com/ or https://intelliqs.zometric.com/
- On the home page, choose Statistical Tool> Regression > Orthogonal Regression.
- Next, update the data manually or can completely copy (Ctrl+C) the data from excel sheet or paste (Ctrl+V) it or else there is say option Load Example where the example data will be loaded.
- Next, you need to fill the required options .
- Finally, click on calculate at the bottom of the page and you will get desired results.
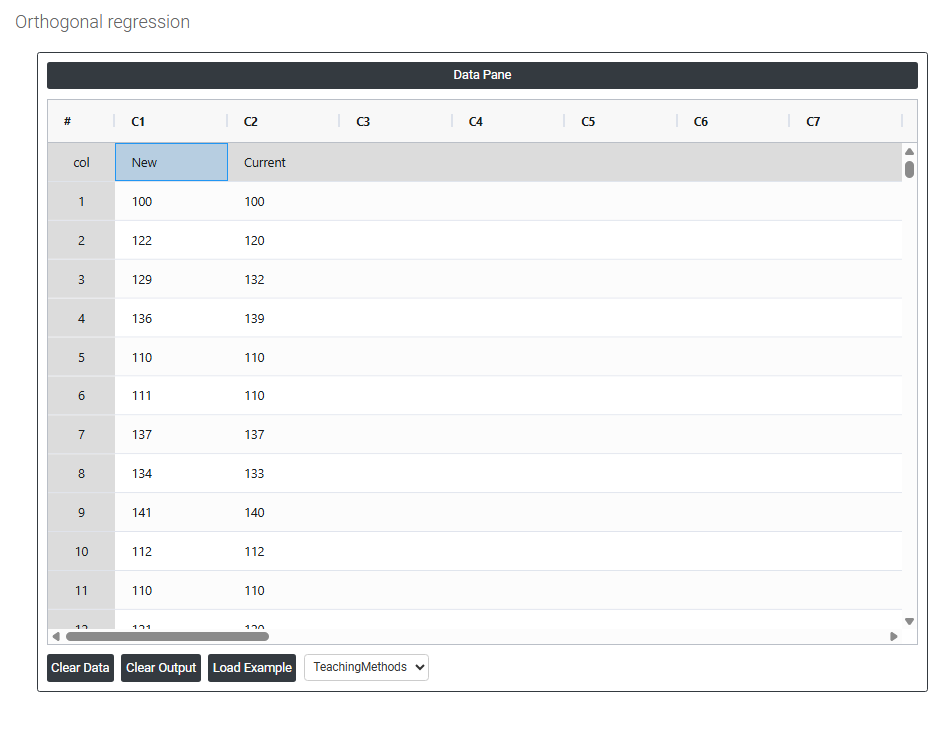
On the dashboard of Orthogonal Regression, the window is separated into two parts.
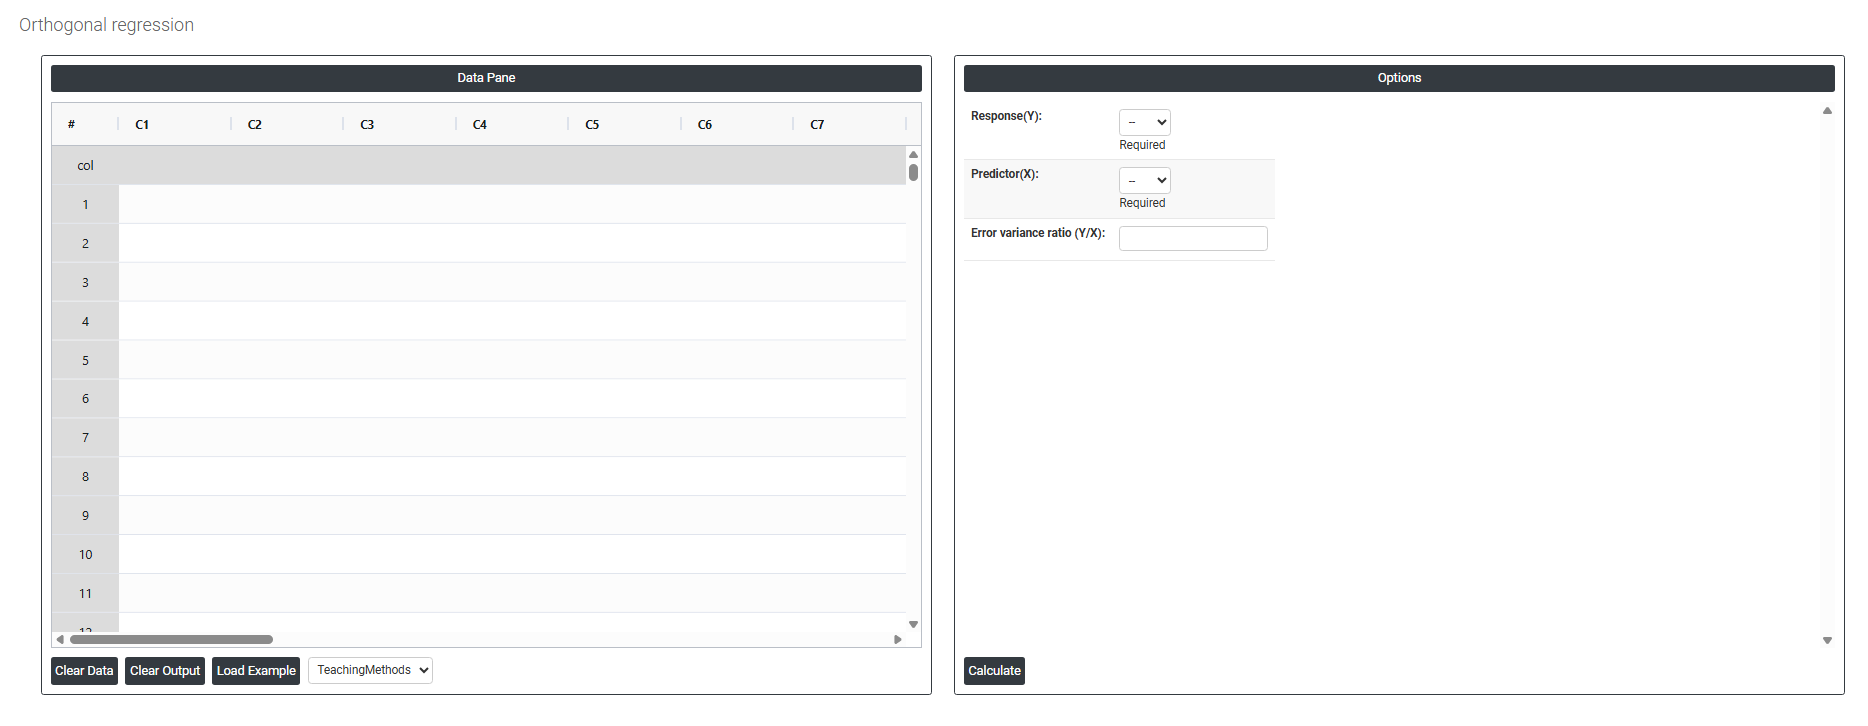
On the left part, Data Pane is present. In the Data Pane, each row makes one subgroup. Data can be fed manually or the one can completely copy (Ctrl+C) the data from excel sheet and paste (Ctrl+V) it here.
Load example: Sample data will be loaded.
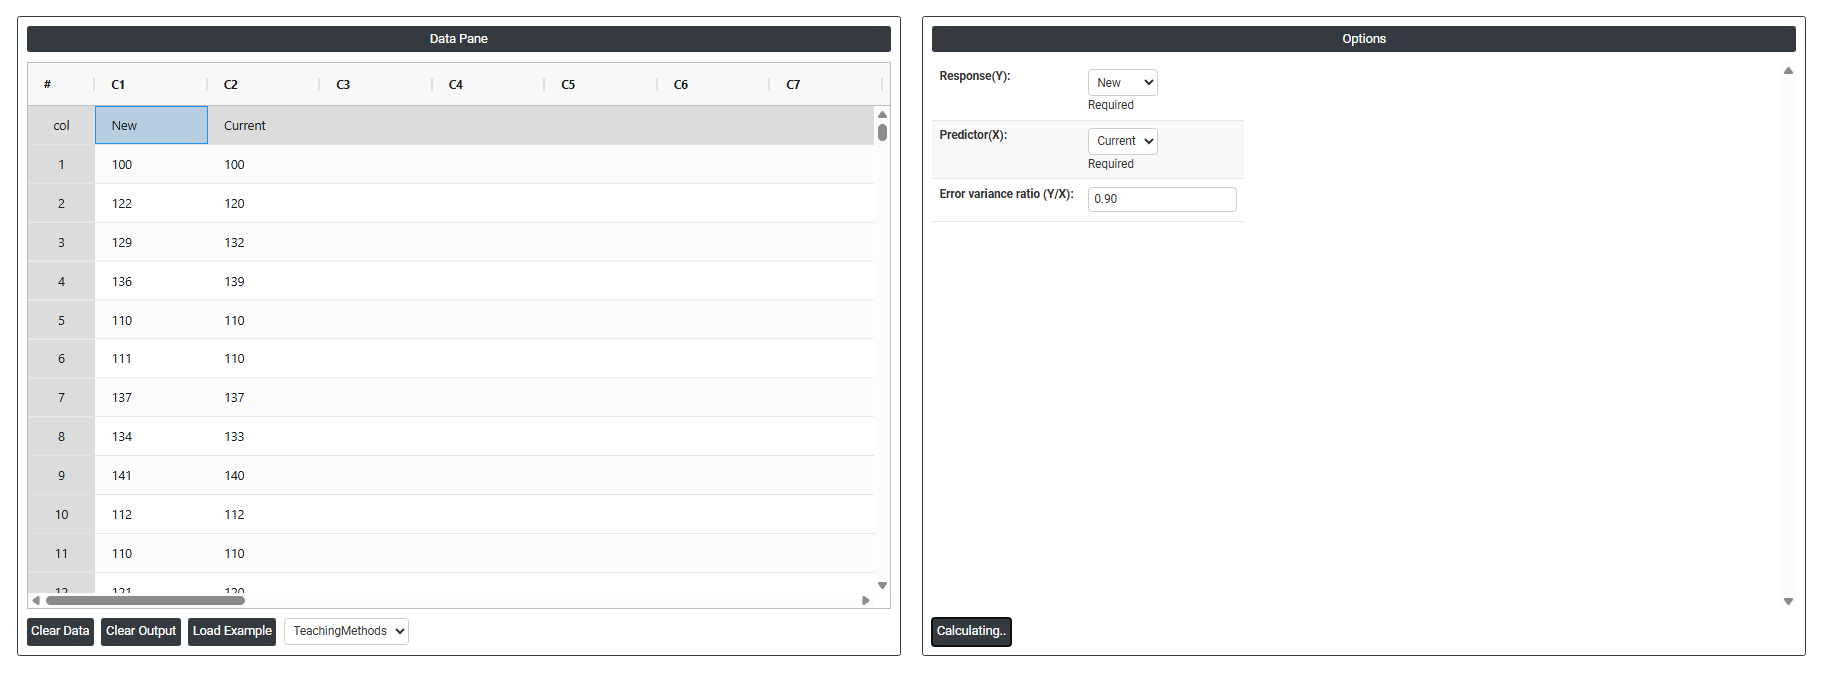
On the right part, there are many options present as follows:
-
Response(Y): Select the column containing the measurements from the method or instrument you want to evaluate typically the new, alternative, or test method being assessed against an established reference. This is the variable plotted on the vertical axis. In a method comparison study, this is usually the newer, faster, or less expensive measurement system whose equivalence to the reference needs to be demonstrated.
-
Predictor (X): Select the column containing the measurements from the reference, established, or standard method the measurement system already accepted as reliable and accurate. This is the variable plotted on the horizontal axis. Both the Response and Predictor columns must contain measurements taken on the same set of items or samples each row represents one item measured by both methods.
-
Error Variance Ratio (Y/X): Defines the assumed ratio between the measurement error variance of the Y variable and the measurement error variance of the X variable. This is the most critical and unique input in orthogonal regression it tells the model how much error exists in each variable relative to the other, so the fitted line correctly accounts for imprecision in both measurements.