In this article we will explore in brief about IMR control charts used in Statistical Process Control, and the formulas used in statistical software.
What is IMR Control Chart?
IMR, or Individual moving range control charts are used to monitor the mean and variation of a process when the following conditions exists:
- Continuous (numeric / decimal) data is collected over a period.
- The data is for an individual observation (not for a subgroup of size > 1)
- The date is moderately normally distributed
- Each data point is independent of the other date points (non-corelated data)
IMR chart includes two charts, i.e individual chart & moving range chart.
Formula for calculation of I Chart control limits
Each data point, xi, is an observation.
I Chart center line
The center line represents the process mean, μ. If you do not specify a historical value for the process mean, we use the mean of the observations.
I Chart control limits
If historical value for the process standard deviation, σ, is not specified, then σ is estimated from the data using the specified method.
![]()
![]()
Notation
| Term | Description |
| μ | process mean |
| k | parameter for Test 1. The default is 3. Usually, additional limits are specified at k = 1 and K =2 |
Estimation of sigma
Average moving range method
The average moving range, ![]() , of length w is given by the following formula:
, of length w is given by the following formula:
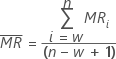
where MRi is the moving range for observation i, calculated as follows:
![]()
![]() is used to calculate Smr, which is an unbiased estimate of σ:
is used to calculate Smr, which is an unbiased estimate of σ:
![]()
Notation
| Term | Description |
| N | number of observations |
| w | length of the moving range. The default is 2. |
| d2() | value of unbiasing constant d2 that corresponds to the value specified in parentheses. |
Note: Zometric Qtools and Zometric IntelliQS products uses w =2 by default. Therefore, d2(2) = 1.128 is used by default.
Moving Range Chart Control limit formula
Moving Range plotted points
Each data point, MRi, is the moving range of the x values in each group. MRiis not plotted for i < w because it is undefined.
| Term | Description |
| MR | moving range |
| w | Number of observations in the moving range. By default, w = 2. |
| d2(w) | Unbiasing constant given in this table later |
Moving Range center line formula
The center line is the unbiased estimate of the average of the moving range.
center line = MR * d2(w)
Moving Range Lower control limit (LCL) formula
The LCL is the greater of the following:
![]()
or
![]()
Moving Range Upper control limit (UCL) formula
![]()
Notation
| Term | Description |
| d2() | a constant used to estimate the standard deviation |
| w | number of observations in the moving range. By default, w = 2. |
| σ | process standard deviation |
| k | parameter for Test 1 (default is 3) |
| d3() | A constant used to estimate LCL and UCL. |
Zometric Qtools and Zometric IntelliQS products uses w =2 by default. Therefore, d2(2) = 1.128 & d3(2) = 0.8525 is used by default.
Unbiasing constants d2(), d3(), and d4()
- d2(N) is the expected value of the range of N observations from a normal population with standard deviation = 1. Thus, if r is the range of a sample of N observations from a normal distribution with standard deviation = σ, then E(r) = d2(N)σ.
- d3(N) is the standard deviation of the range of N observations from a normal population with σ = 1. Thus, if r is the range of a sample of N observations from a normal distribution with standard deviation = σ, then stdev(r) = d3(N)σ.
- Use the following table to find an unbiasing constant for a given value, N. (To determine the value of N, consult the formula for the statistic of interest.)
| N | d2(N) | d3(N) | d4(N) |
| 2 | 1.128 | 0.8525 | 0.954 |
| 3 | 1.693 | 0.8884 | 1.588 |
| 4 | 2.059 | 0.8798 | 1.978 |
| 5 | 2.326 | 0.8641 | 2.257 |
| 6 | 2.534 | 0.848 | 2.472 |
| 7 | 2.704 | 0.8332 | 2.645 |
| 8 | 2.847 | 0.8198 | 2.791 |
| 9 | 2.97 | 0.8078 | 2.915 |
| 10 | 3.078 | 0.7971 | 3.024 |
| 11 | 3.173 | 0.7873 | 3.121 |
| 12 | 3.258 | 0.7785 | 3.207 |
| 13 | 3.336 | 0.7704 | 3.285 |
| 14 | 3.407 | 0.763 | 3.356 |
| 15 | 3.472 | 0.7562 | 3.422 |
| 16 | 3.532 | 0.7499 | 3.482 |
| 17 | 3.588 | 0.7441 | 3.538 |
| 18 | 3.64 | 0.7386 | 3.591 |
| 19 | 3.689 | 0.7335 | 3.64 |
| 20 | 3.735 | 0.7287 | 3.686 |
| 21 | 3.778 | 0.7242 | 3.73 |
| 22 | 3.819 | 0.7199 | 3.771 |
| 23 | 3.858 | 0.7159 | 3.811 |
| 24 | 3.895 | 0.7121 | 3.847 |
| 25 | 3.931 | 0.7084 | 3.883 |
For values of N from 26 to 100, use the following approximations for d3(N) and d4(N):
![]()
![]()
For values of N from 51 to 100, use the following approximation for d2(N):
![]()