In this article we will explore in brief about normal process capability indices used in Statistical Process Control, and the formulas used in popular statistical software.
What is normal process capability?
Normal process capability analysis is used to evaluate the potential and overall capability of manufacturing processes, assuming the data in the processes are normally distributed. The goals are primarily:
- To determine how well process outputs meet your customer or internal specifications.
- To identify improvement opportunity, i.e:
- Stability: The difference between process performance (Pp, Ppk) vs process potential (Cp, Cpk) is small for stable processes, and high for processes with too much of adjustments(scope of improvement).
- Centring: The difference between Pp vs Ppk, or between Cp vs Cpk is small for centred processes.
Data requirements & recommendations
- Required: You need at least one of the specification limits, i.e a lower specification limit (LSL) or a upper specification limit (USL), or both.
- The data collected should be continuous (numeric / decimal) in nature.
- Each subgroup should be collected as a rational subgroup if possible.
- A rational subgroup consists of samples produced over a short enough time window / sequence such that the chances of external factors (special causes) are low.
- Multiple subgroups can be spaced apart in time.
- Data should be approximately normal. If the data is non-normal, then:
- Subgroup size should be increased, as that way distribution of means tends to become normal
- Or use a transformation like box-cox transformation.
- 100 or more data points is recommended. If data is collected in subgroups, enough subgroups to sum-up 100 data points; say 25 subgroups of subgroup size 4.
Potential capability indices formulae
![]()
![]()
![]()
![]()
Apart from above, CCpk is calculated based on the "known" values of the LSL, USL or the Target.
| Known value | CCpk |
| USL only | 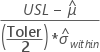 |
| LSL only | 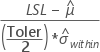 |
| LSL and USL | 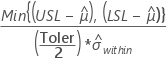 |
Performance capability indices formulae.
![]()
![]()
![]()
![]()
Apart from above, Cpm is calculated when a target is specified.
| Known value | Cpm |
|---|---|
| LSL and USL only | * |
| LSL, USL, and T = m | 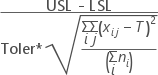 |
| LSL, USL, and T ≠ m | 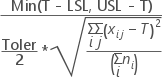 |
| USL and T only | 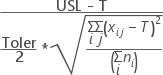 |
| LSL and T only | 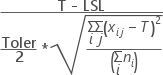 |
| Either LSL or USL only | * |
Notation
| Term | Description | |
| USL | Upper specification limit | |
| LSL | Lower specification limit | |
| Toler | Multiplier of the sigma tolerance (6 is the default value) | |
| m | Midpoint between USL and LSL | |
| T | Target value | |
|
|
Within-subgroup standard deviation | |
|
|
Overall standard deviation | |
|
|
Process means (estimated from the sample data or a historical value) | |
|
|
Estimator for the population mean. T if T is specified. If T is not specified, but LSL and USL are specified, then m. Otherwise process mean. | |
| * | Missing value | |
| Xij | jth observation in the ith subgroup | |
| ni | Number of observations in the ith subgroup |
What is the difference between within and overall standard deviation?
For normal process capability estimation, two "estimated" standard deviations are used.
- Within standard deviation is estimated as a measure of variation /spread by trying to filter out external influences to the process. It can be assumed as the inherent "natural" variation of a process. The estimation methods uses the variation / spread of data within subgroups or between consecutive readings.
- Overall standard deviation is estimated as a measure of variation / spread as-is, including any external influences and instabilities in the process.
Formulas for estimation of within and overall standard deviations.
Depending on the subgroup size, within standard deviation can be estimated with either of the options below:
- When subgroup size > 1, estimation can be done using either of the following methods:
- Using pooled standard deviation (Pooled sd)
- Using average subgroup range (Rbar)
- Using average of subgroup standard deviation (Sbar)
- When subgroup size = 1, estimation can be done using either of the following methods:
Using pooled sd method(n>1):
![]()
Where,
Using Rbar method(n>1):
![]()
Where,
![]()
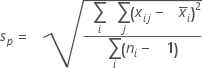
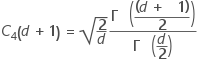
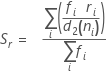
Using Sbar method(n>1):
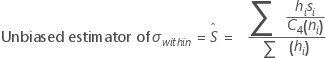
where:
![]()
Using average moving range method(n=1):
![]()
Where,
![]()
![]()
Using median moving range method(n=1):
![]()
where:
![]()