What is Analyse Definitive Screening?
Analyse Definitive Screening Design processes the results from a DOE experiment, fits a statistical model to your response data, and identifies which factors including linear, quadratic, and interaction effects are statistically significant drivers of the response.
Simple Definitions: The analysis step that takes your DSD experimental results and reveals which factors truly drive the response, how strongly, and whether any curved or combined effects are present.
When to use Analyse Definitive Screening?
- Use after completing a Definitive Screening experiment and collecting all response measurements.
- Use to identify which factors matter and understand both their individual effects and curved relationships with the response.
Guidelines for correct usage of Analyse Definitive Screening
- Ensure all planned runs are completed before analysis missing runs reduce the ability to estimate effects correctly.
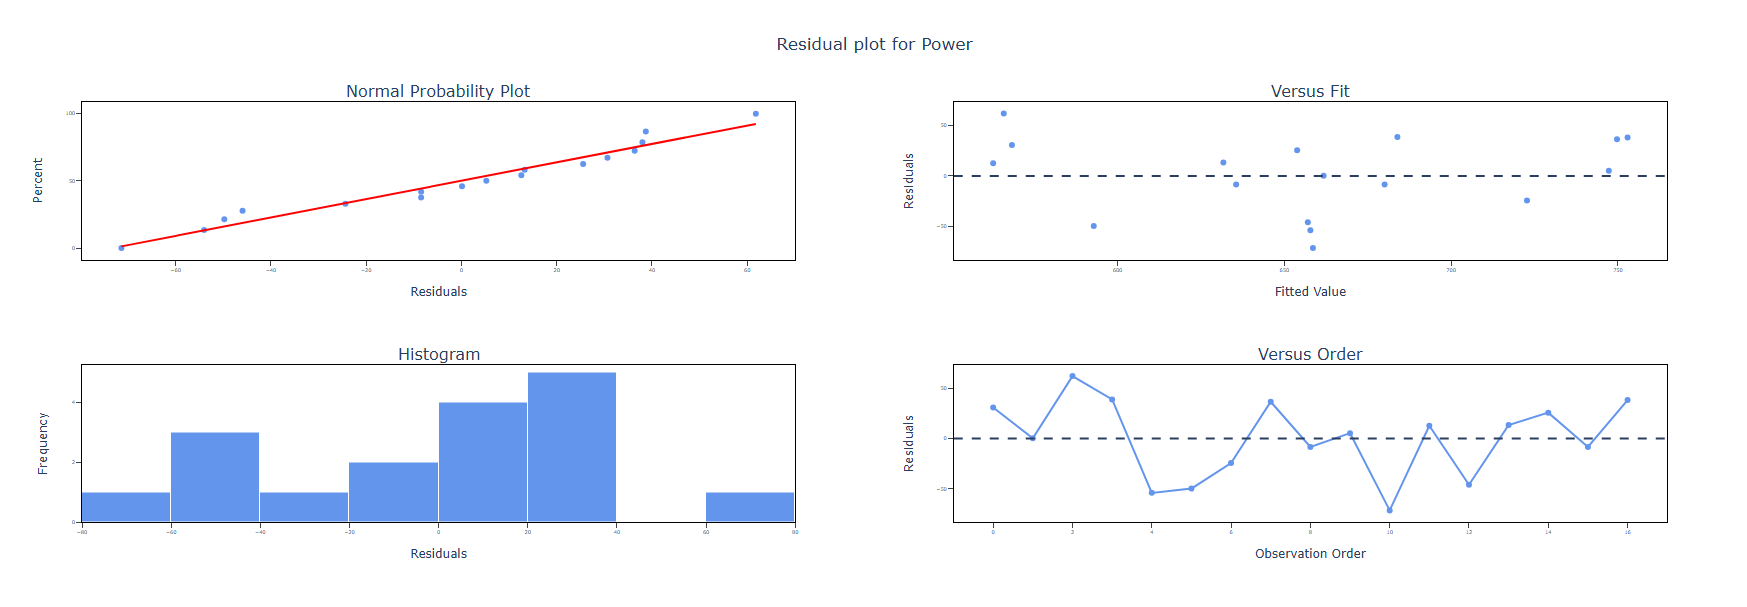
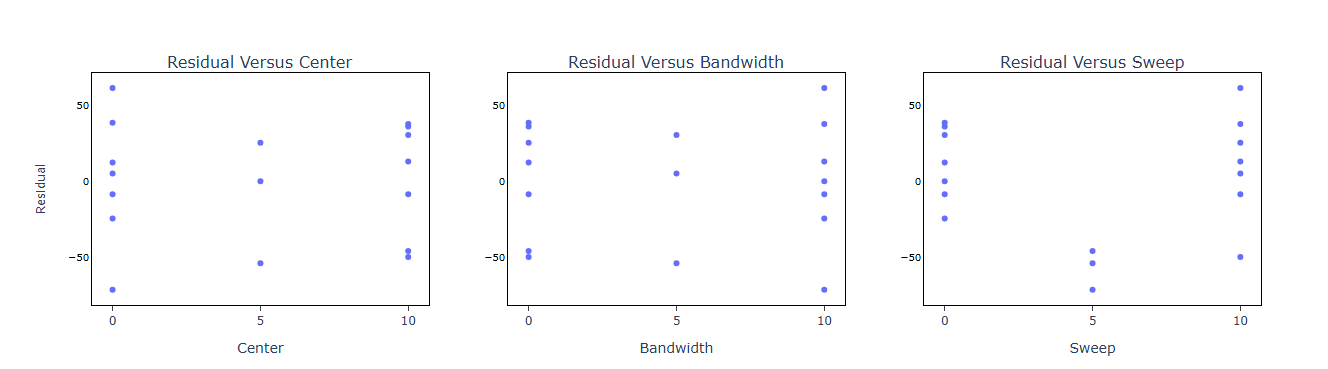
- Check residual plots after fitting residuals should appear random with no patterns.
- Use stepwise model selection to retain only significant terms and avoid inflating model variance.
- Validate the final model with confirmation runs before making process changes.
Alternatives: When not to use Analyse Definitive Screening
- If the experiment was not created as a DSD, use the analysis tool that matches the design type used.
- If severe outliers cannot be resolved, consider transforming the response or using robust methods before proceeding.
Example of Analyse Definitive Screening
Engineers are working on the development of a new ultrasonic cleaner. They apply a screening design to identify which factors may influence the cleaner’s output power. One of the engineers reviews a definitive screening design to determine which of the seven potential factors has the most significant impact on power output. The goal is to achieve a power level that is strong enough to clean effectively while remaining gentle enough to avoid damaging the items being cleaned. The following steps:
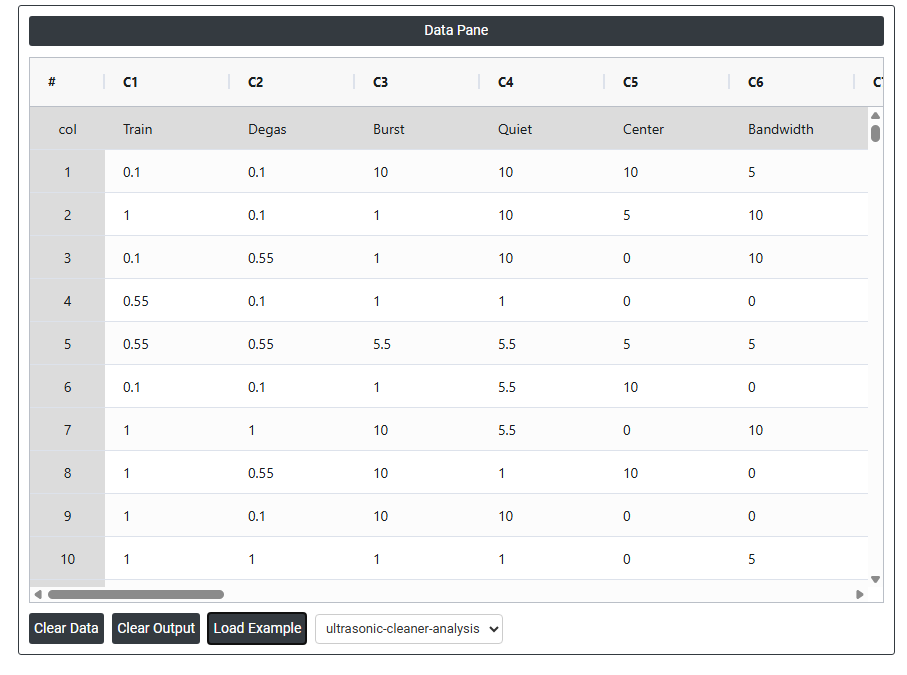
- Gathered the necessary data.
- Now analyses the data with the help of https://qtools.zometric.com/ or https://intelliqs.zometric.com/.
- To find Analyse Definitive Screening choose https://intelliqs.zometric.com/> Statistical module> DOE> Analyse Definitive Screening.
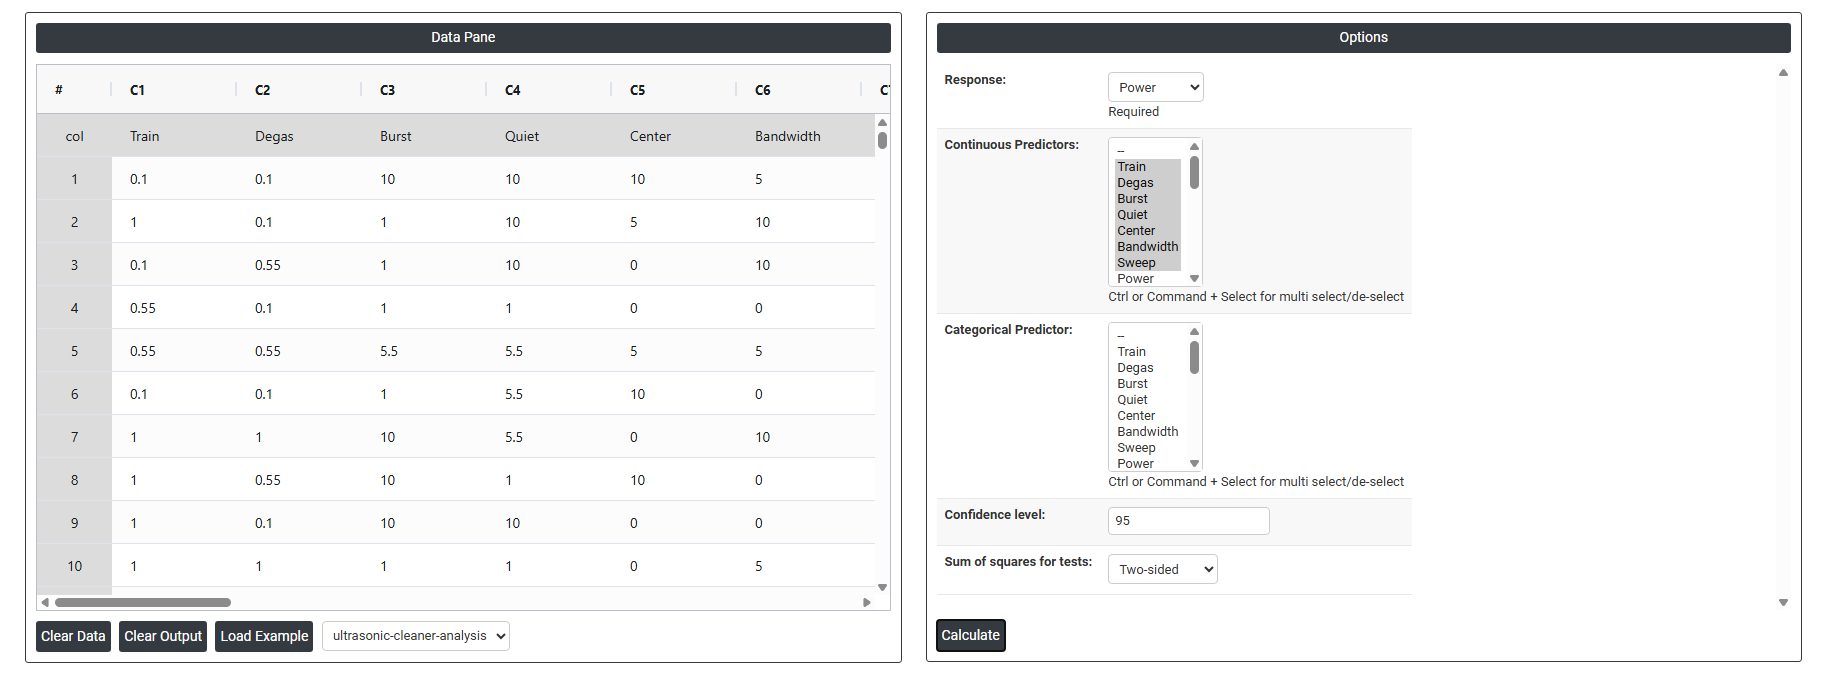
- Inside the tool, feeds the data along with other inputs as follows:
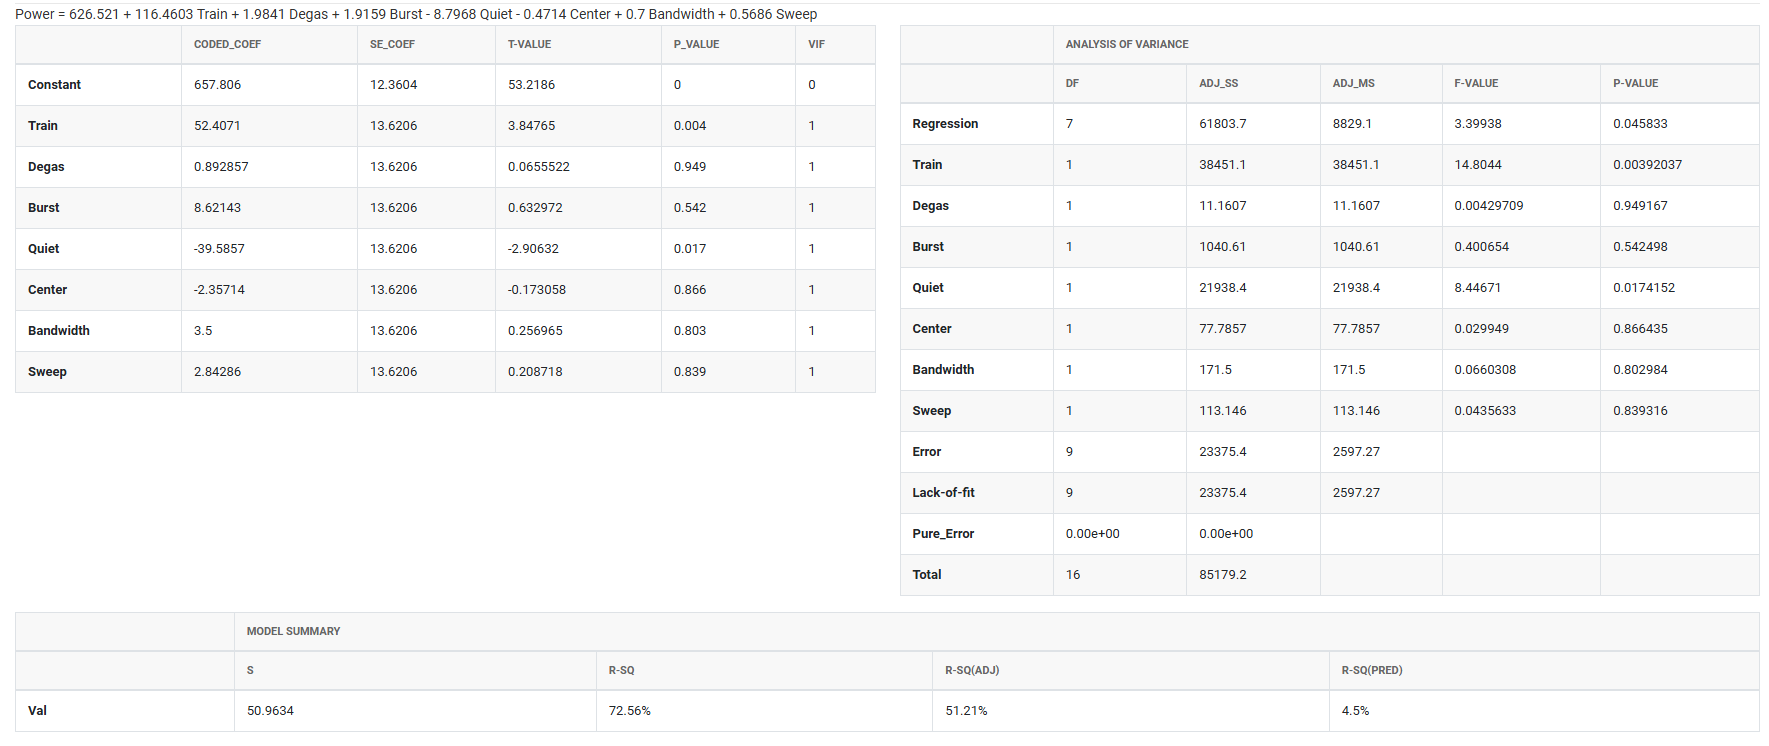
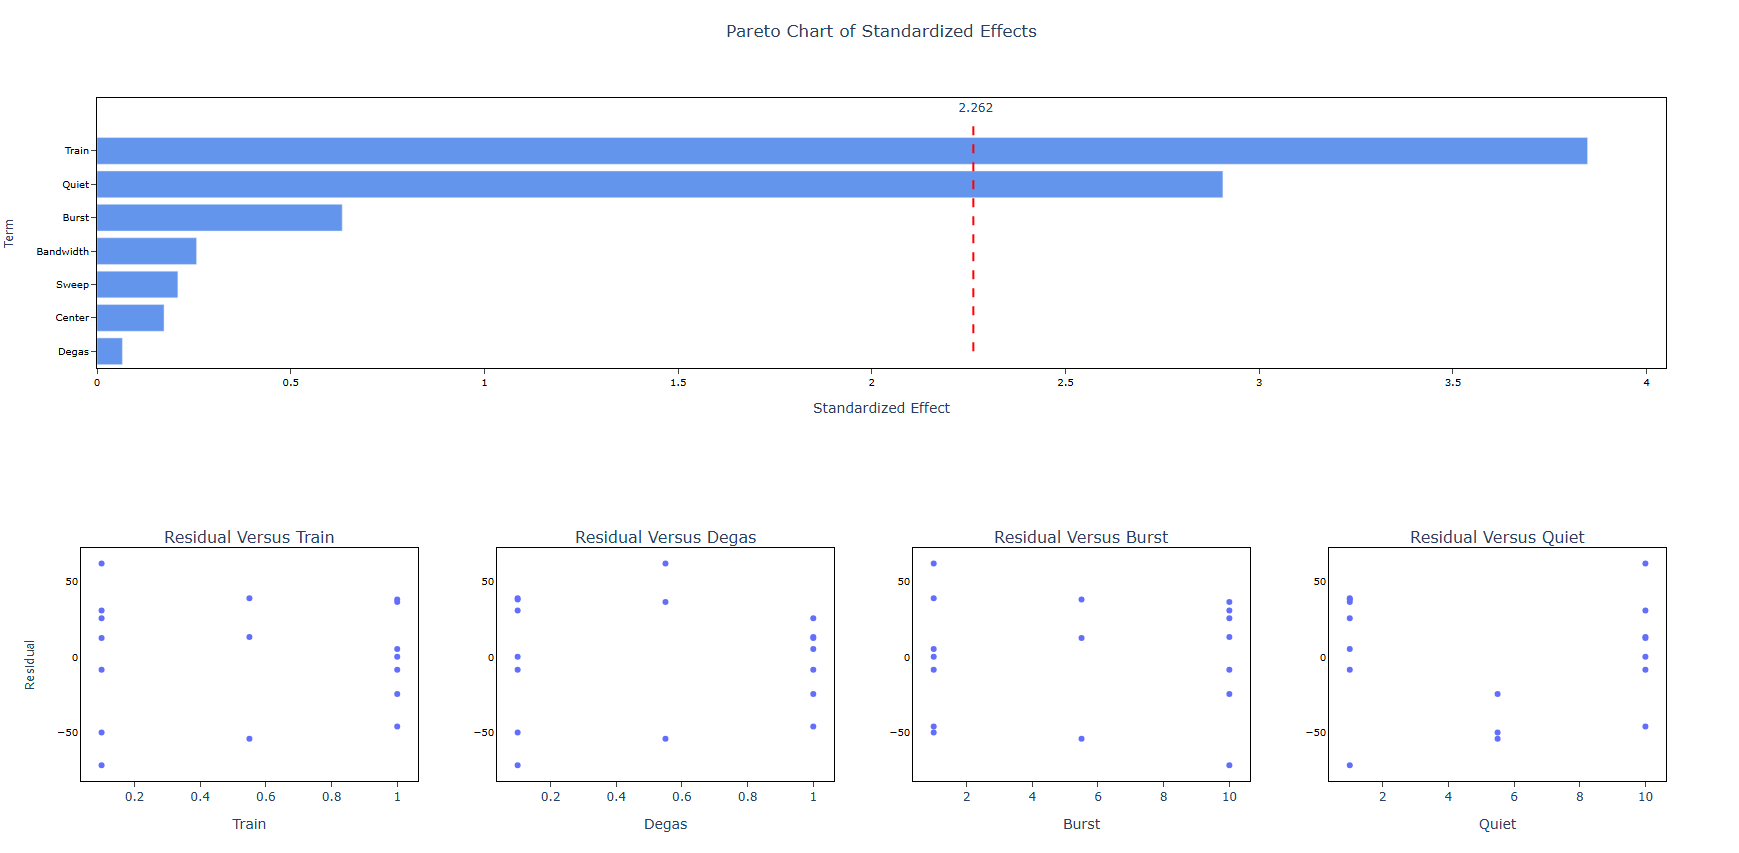
5. After using the above mentioned tool, fetches the output as follows:
How to do Analyse Definitive Screening
The guide is as follows:
- Login in to QTools account with the help of https://qtools.zometric.com/ or https://intelliqs.zometric.com/
- On the home page, choose Statistical Tool> DOE>Analyse Definitive Screening.
- Next, update the data manually or can completely copy (Ctrl+C) the data from excel sheet and paste (Ctrl+V) it here.
- Next, you need to fill the required options.
- Finally, click on calculate at the bottom of the page and you will get desired results.
On the dashboard of Analyse Definitive Screening, the window is separated into two parts.
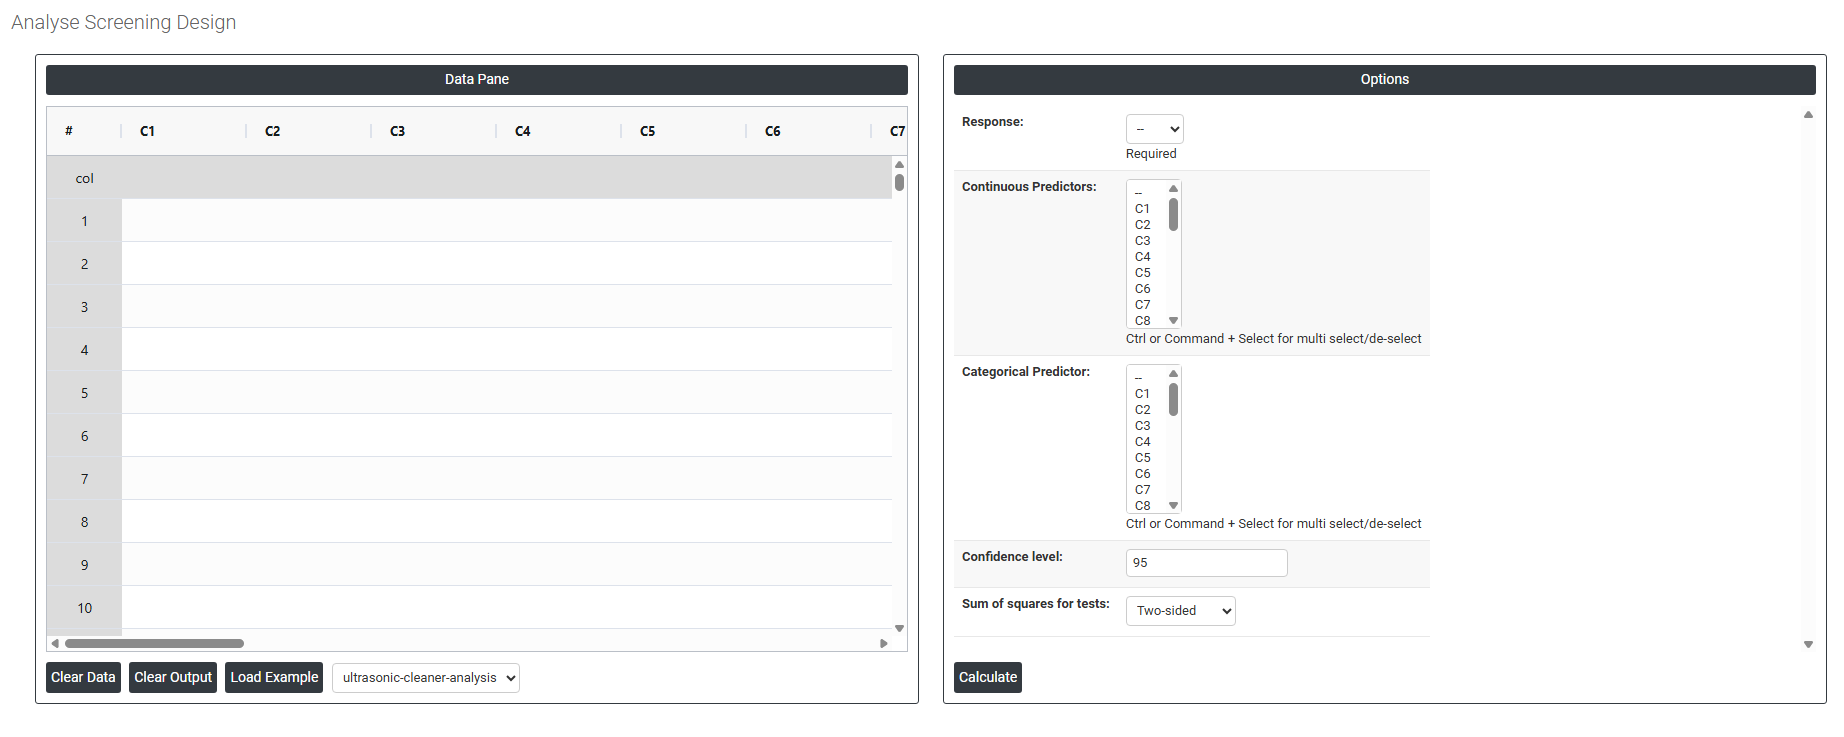
On the left part, Data Pane is present. In the Data Pane, each row makes one subgroup. Data can be fed manually or the one can completely copy (Ctrl+C) the data from excel sheet and paste (Ctrl+V) it here.
Load example: Sample data will be loaded.
On the right part, there are many options present as follows:
- Response Select the column containing the output variable you measured during the experiment such as Power, strength, or purity. This is the value the model will attempt to explain and predict based on the predictor settings.
- Continuous Predictors Select all columns that represent continuous (numeric) factors used in the experiment such as temperature, pressure, or time. Use Ctrl or Command + Click to select multiple columns. These are the variables the model will use to estimate linear, quadratic, and interaction effects.
- Categorical Predictor Select the column representing any categorical factor included in the design such as machine type, supplier, or material grade. Categorical predictors are treated as distinct groups rather than numeric values, and the model estimates a separate effect for each category level.
- Confidence Level Sets the certainty level for all confidence intervals and significance tests in the output. The standard default is 95%, meaning there is a 5% chance that a truly non-significant effect is incorrectly flagged as significant. Increase to 99% for more conservative testing; decrease to 90% for exploratory work where more sensitivity is preferred.
- Sum of Squares for Tests Controls how the statistical significance of each term in the model is assessed. Three options are available:
-
- Two-sided — tests whether each effect is significantly different from zero in either direction (positive or negative). This is the standard default and is appropriate for most analyses where you do not have a directional hypothesis.
- Lower bound — a one-sided test checking whether the effect is significantly less than zero. Use when you are specifically interested in whether a factor decreases the response.
- Upper bound — a one-sided test checking whether the effect is significantly greater than zero. Use when you are specifically interested in whether a factor increases the response.