What is Attribute Gauge Study?
An Attribute Gauge Study also called Attribute Agreement Analysis evaluates the reliability and consistency of an inspection or classification process where outcomes are categorical rather than measured. It answers two fundamental questions: Can each appraiser agree with themselves when inspecting the same item more than once? And do all appraisers agree with each other and with a known correct standard?
The study uses Kappa statistics to quantify the level of agreement a Kappa of 1.0 represents perfect agreement, while a Kappa of 0 means agreement is no better than random chance. In addition to within-appraiser and between-appraiser agreement, the study also measures how well each appraiser agrees with the known reference or expert standard, giving a complete picture of the measurement system's effectiveness.
Simple Definitions: A study that measures how consistently and accurately appraisers classify items into categories checking whether they agree with themselves, with each other, and with the correct known answer.
When to use Attribute Gauge Study?
- Use when your inspection process produces categorical outcomes — such as pass/fail, accept/reject, conforming/nonconforming, or any classification-based result.
- Use when validating or qualifying an inspection process before deploying it in full production.
- Use when there are concerns about inspector inconsistency — for example, if different operators are making different accept/reject decisions on the same parts.
- Use as part of a quality management system audit or regulatory submission where documented evidence of inspection system capability is required.
Understanding Kappa
Kappa measures agreement while accounting for the agreement that would occur by chance alone. Use the following benchmarks to interpret your results:
| Kappa Value | Interpretation |
| < 0.40 | Poor agreement — inspection system needs significant improvement |
| 0.40 – 0.59 | Moderate agreement — improvement is recommended |
| 0.60 – 0.74 | Good agreement — acceptable for many applications |
| 0.75 – 0.90 | Strong agreement — inspection system is reliable |
| > 0.90 | Excellent agreement — inspection system is highly capable |
Guidelines for correct usage of Attribute Gauge Study
- Include borderline and ambiguous items in the sample these are the most revealing cases for understanding where appraisers disagree.
- Use at least 3 appraisers, 20 to 30 samples, and 2 to 3 trials per appraiser per sample for statistically meaningful Kappa estimates.
- Ensure a known reference standard is established before the study without a reference, you can only measure appraiser-to-appraiser agreement, not accuracy.
- Appraisers must work independently and blind to each other's results during the study any communication between appraisers invalidates the results.
- If Kappa is below 0.70, investigate and address root causes before relying on the inspection process common causes include poorly defined acceptance criteria, inadequate training, or genuinely ambiguous parts.
Alternatives: When not to use Attribute Gauge Study
- If the measurement outcome is continuous and numeric, use Crossed Gage R&R instead it provides a more complete and quantitative assessment of measurement system capability.
- If only one appraiser is involved, between-appraiser agreement cannot be assessed you can only evaluate within-appraiser repeatability, which gives an incomplete picture of the inspection system.
- If you need to quantify the magnitude of measurement error numerically (e.g. in millimetres or grams), use Gage R&R with continuous data
Example of Attribute Gauge Study
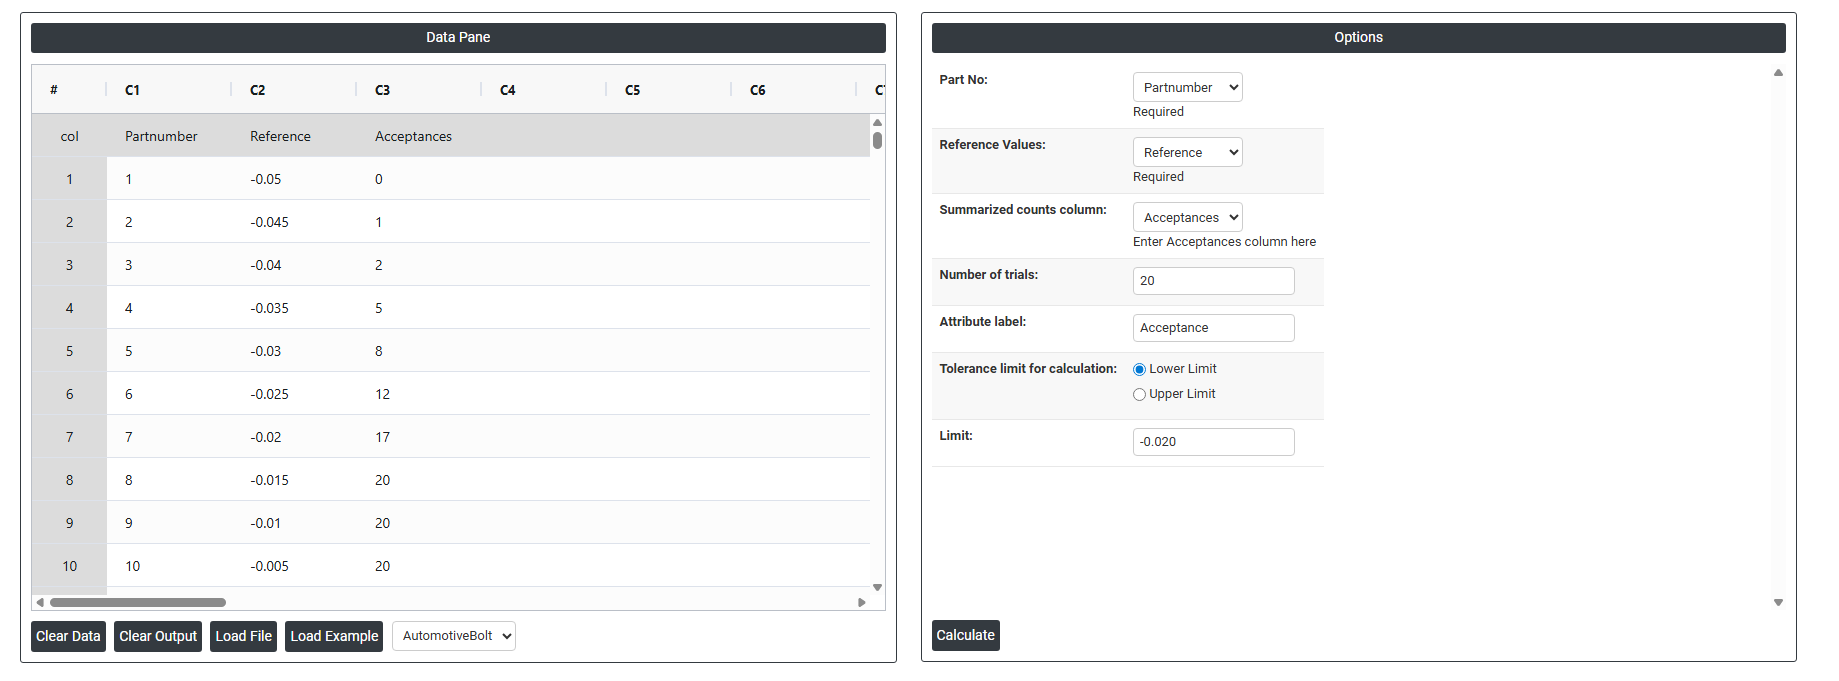
A manufacturing engineer evaluates an automated attribute measurement system used to accept or reject bolts. The engineer selects 10 parts with known reference values and tests each part on a go/no-go gage 20 times, recording the number of acceptances for each part. The engineer performs an attribute gage study to analyze the system's bias and repeatability and to decide whether improvements to the measurement system are needed. The system's specified tolerance limits are set at a lower tolerance of -0.020 and an upper tolerance of 0.020. The following steps:
- Gathered the necessary data.

- Now analyses the data with the help of https://qtools.zometric.com/ or https://intelliqs.zometric.com/.
- To find Attribute Gauge Study choose https://intelliqs.zometric.com/> Statistical module> Measurement System Analysis>Attribute Gauge Study.
- Inside the tool, feeds the data along with other inputs as follows:
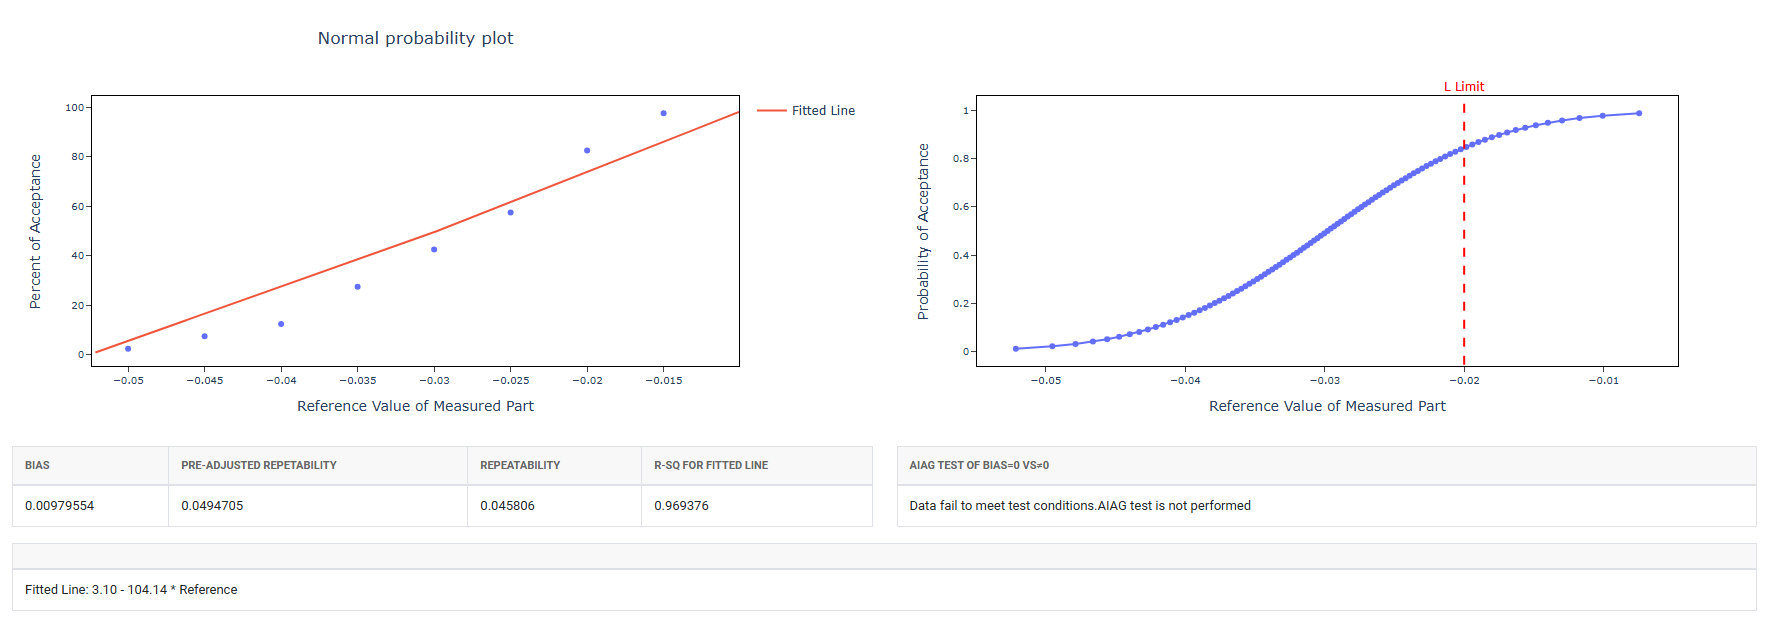
5. After using the above mentioned tool, fetches the output as follows:
How to do Attribute Gauge Study
The guide is as follows:
- Login in to QTools account with the help of https://qtools.zometric.com/ or https://intelliqs.zometric.com/
- On the home page, choose Statistical Tool> Measurement System Analysis >Attribute Gauge Study
- Next, update the data manually or can completely copy (Ctrl+C) the data from excel sheet and paste (Ctrl+V) it here.
- Fill the required options.
- Finally, click on calculate at the bottom of the page and you will get desired results.
On the dashboard of Attribute Gauge Study, the window is separated into two parts.
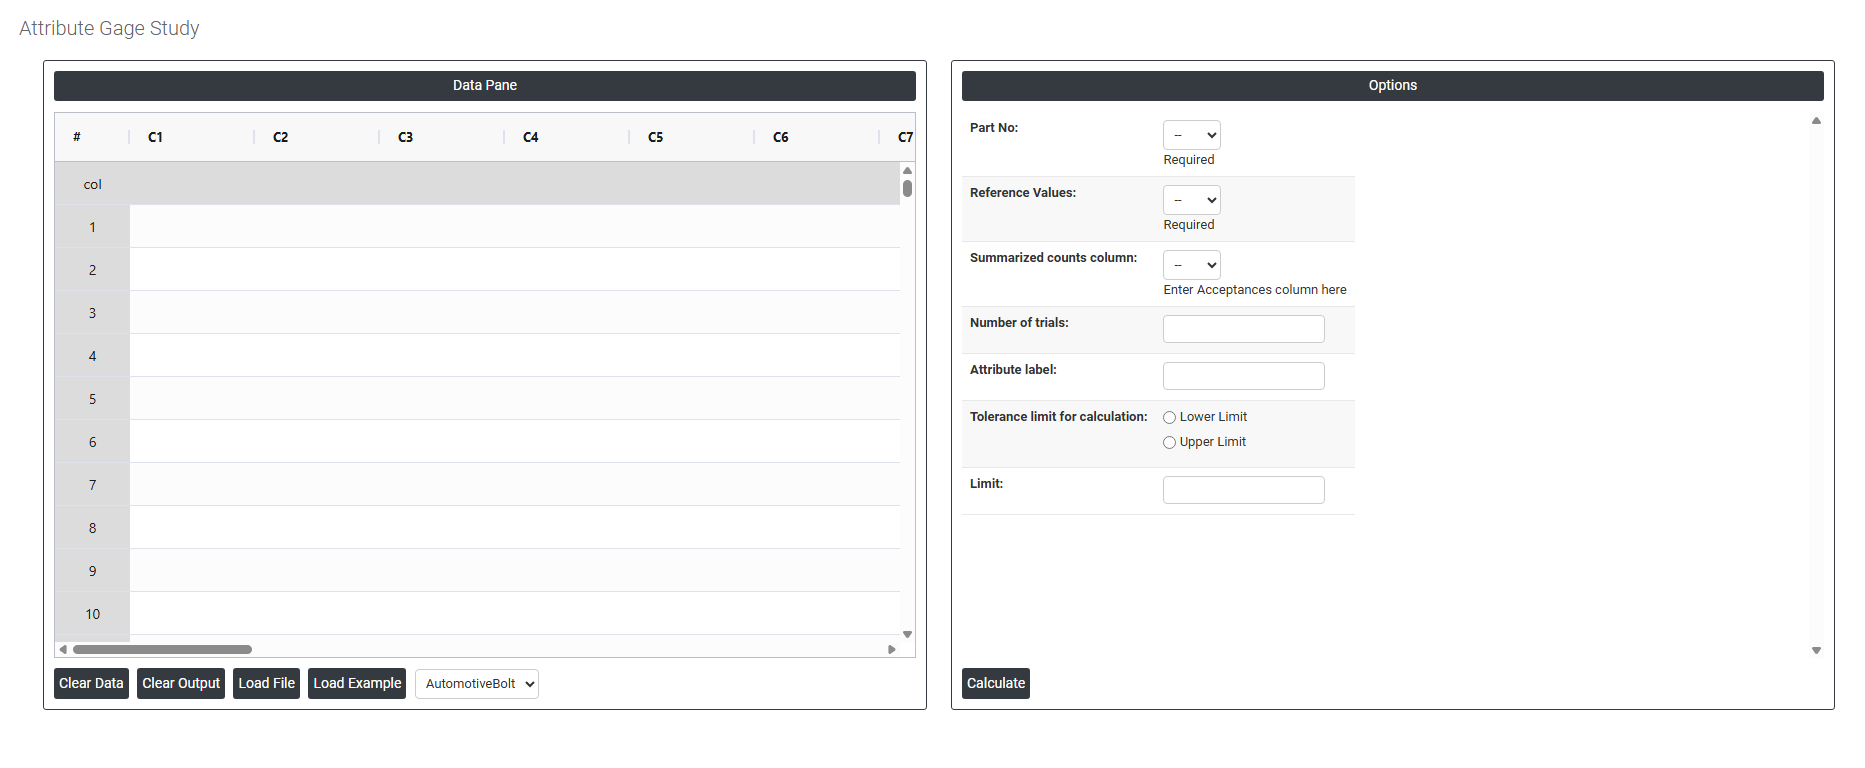
On the left part, Data Pane is present. In the Data Pane, each row makes one subgroup. Data can be fed manually or the one can completely copy (Ctrl+C) the data from excel sheet and paste (Ctrl+V) it here.
Load example: Sample data will be loaded.
Load File: It is used to directly load the excel data.
On the right part, there are many options present as follows:
- Part No: Select the column that contains the unique identifier for each part or sample included in the study such as a part number, serial number, or sample code. This is a required field. It is used to link each measurement result back to the specific part it belongs to, enabling the analysis to track how consistently each part is classified across multiple trials and appraisers.
- Reference Values: Select the column that contains the known correct classification for each part the accepted standard or expert decision that serves as the benchmark for the study. This is a required field. Reference values are typically determined by an expert, a senior quality engineer, or a certified measurement method before the study begins. The analysis compares each appraiser's decisions against these reference values to assess accuracy not just consistency between appraisers.
- Summarized Counts Column (Acceptances): Select the column that contains the number of times each part was accepted across all trials by each appraiser. Rather than entering every individual trial decision as a separate row, this summarised format records the total acceptance count per part per appraiser for example, a value of 3 means the appraiser accepted that part in all 3 trials, while a value of 1 means they accepted it only once out of 3 trials. Enter the acceptances column here to define which column holds these summarised counts.
- Number of Trials: Enter the total number of times each appraiser evaluated each part during the study. This value is used alongside the acceptances count to calculate the proportion of times each part was accepted and to assess within-appraiser consistency. A minimum of 2 trials is required; 3 trials is the recommended standard as it provides a more reliable measure of repeatability and gives better visibility into borderline or inconsistent decisions.
- Attribute Label: Enter a descriptive label for the attribute outcome being inspected for example, "Accept", "Pass", "Conforming", or "Good". This label appears in the analysis output and charts, making the results easier to read and interpret. Using a meaningful label rather than leaving it as a default number ensures the report is clear and self-explanatory to anyone reviewing it.
- Tolerance Limit for Calculation: Defines whether one or both specification boundaries are used to determine the reference classification of each part. This setting directly affects how borderline parts near the specification edge are handled in the analysis. Two options are available:
- Lower Limit : only the lower specification boundary is used to classify parts. Select this when the quality concern is that measurements should not fall below a minimum acceptable value for example, minimum strength, minimum coating thickness, or minimum fill weight.
- Upper Limit : only the upper specification boundary is used to classify parts. Select this when the quality concern is that measurements should not exceed a maximum acceptable value for example, maximum contamination level, maximum dimension, or maximum weight.
- Limit: Enter the numeric value of the specification limit selected above either the lower or upper boundary depending on your selection. This value defines the exact cut-off point used to determine whether each part should be classified as acceptable or not acceptable in the reference standard. Entering an accurate limit is critical because the entire accuracy assessment of the attribute gauge study is based on comparing appraiser decisions against this boundary.