Bar Chart
A bar chart, or bar graph, is a graphical representation of categorical or discrete data using rectangular bars, where the length or height of each bar is proportional to the value it represents. It features two axes: the vertical (y-axis) displaying the values and the horizontal (x-axis) listing the categories being compared.
Last reviewed
Key takeaway
A bar chart, or bar graph, is a graphical representation of categorical or discrete data using rectangular bars, where the length or height of each bar is proportional…
On this page
What is Bar Chart?
A bar chart, or bar graph, is a graphical representation of categorical or discrete data using rectangular bars, where the length or height of each bar is proportional to the value it represents. It features two axes: the vertical (y-axis) displaying the values and the horizontal (x-axis) listing the categories being compared. This chart type effectively reveals patterns and facilitates quick comparisons across various categories, with variants including stacked, horizontal, and grouped formats for diverse analytical applications.
When to use Bar Chart?
These charts are commonly used to display and compare categorical data, making them a useful tool in various situations. Here are some instances when you might want to use a bar chart:
- It is used when you want to show a distribution of data points or perform a comparison of metric values across different subgroups of your data.
- Comparisons between categories: Bar charts are ideally suited to making comparisons between categories because our visual perception is excellent at interpreting the lengths of bars that have a common baseline.
- Ranking: Bar charts are well suited to show rankings where the categories can be sorted from highest to lowest to emphasize the largest value, and from lowest to highest to emphasize the smallest value. The following chart sorts greenhouse gas emissions from food sources from highest to lowest and particularly draws attention to how beef contributes the highest emissions across the various sources.
- Showing frequency or count: When you have data that represents the frequency or count of certain categories or groups, a bar chart can effectively display the distribution and make it easy to understand. Each bar represents a category, and its height represents the frequency or count associated with that category.
- Tracking changes over time: If you want to track changes in values over time for different categories, a grouped bar chart or a stacked bar chart can be useful. The categories are represented on the x-axis, and the height of each bar represents the value. By using different colors or patterns, you can represent different time periods and compare the values between them.
- Ranking or sorting data: It can be used to display the ranking or sorting of data points. You can order the bars based on a specific criterion, such as descending order of values, and clearly show which categories or groups have the highest or lowest values.
- Making comparisons between different groups: These are effective for comparing data across different groups or subcategories. You can use grouped or clustered bar charts to show the values for each group side by side, making it easy to compare and identify patterns or differences.
- Visualizing survey results: They are commonly used to present the results of surveys or questionnaires, where the options or responses are categorical. Each bar represents a response option, and the height of the bar indicates the frequency or percentage of respondents who chose that option.
Remember that bar charts are best suited for categorical or discrete data, where the categories are distinct and non-overlapping. If you have continuous data, such as measurements or ranges, other chart types like histograms or line graphs may be more appropriate.
Guidelines for correct usage of Bar Chart
When creating and using bar charts, it's important to follow certain guidelines to ensure their correct usage and effective communication of data. Here are some guidelines for the correct usage of bar charts:
- Collect summary data or raw data: Either raw data or summarized data can be used to produce the graphic. Every observation in summarized data describes a category. A computed value, such a mean, or a count might be used to summarize data. Every observation in raw data represents an event or a flaw. Each observation is listed in a distinct row of the worksheet, which has all of the raw data in one column.
- Randomly select sample data: To draw conclusions or generalizations about a population, random samples are utilized. Your results might not accurately represent the population if your data were not gathered at random.
Remember that the guidelines above are general recommendations, and the specific requirements for a bar chart may vary depending on the purpose, audience, and nature of the data being presented.
Alternatives: When not to use Bar Chart
- Summarizing continuous data: Bar charts can obscure the nature of the underlying data when it comes to summarizing continuous distributions. Distributions with different shapes can result in the same summary bar chart.
- Long time series: For extremely long time series where showing the overall trend is important, consider using a line or an area chart instead. The continuous nature of these charts draws the eye to the overall shape of the trend, while the bars in a column chart instead lend themselves to comparisons between individual values.
- Correlation: Bar charts are not ideal to show correlations between two series. Use a scatterplot where the overall form of the underlying data is visible.
- Geospatial information: Avoid using bar graphs overlayed on a map to show geospatial information, unless the chart has enough space to show the entire bar for all bars. Otherwise, this can lead to occlusion, where some bars hide shorter bars behind them.
- Histogram or Box Plot: If you want to show the distribution of data, a histogram or a box plot may be a better option than a bar chart. A histogram can show the frequency distribution of data, whereas a box plot can show the median, quartiles, and outliers.
- Scatter Plots: If you want to compare multiple variables or dimensions, a scatter plot may be a better option than a bar chart. Scatter plots can show the relationship between two or more variables, whereas a bar chart can only show one variable at a time.
Example of Bar Chart
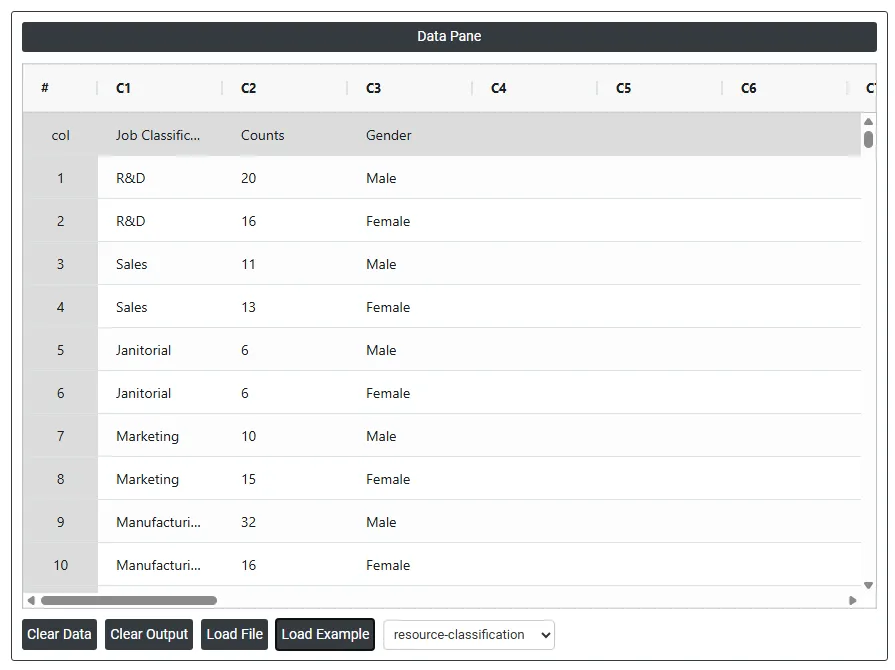
A human resources manager classifies all a company's jobs and tallies the number of employees who belong to each job class.
- Gathered the necessary data.
- Now analyses the data with the help of https://qtools.zometric.com/ or https://intelliqs.zometric.com/.
- To find Bar Chart choose https://intelliqs.zometric.com/> Statistical module> Graphical analysis> Bar Chart.
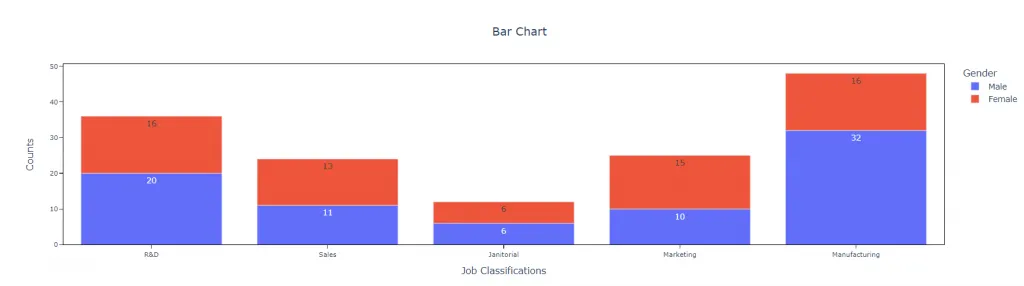
- Inside the tool, feed the data along with other inputs as follows:6. After using the above mentioned tool, fetches the output as follows:
How to do Bar Chart
The guide is as follows:
- Login in to QTools account with the help of https://qtools.zometric.com/ or https://intelliqs.zometric.com/
- On the home page, choose Statistical Tool> Graphical analysis >Bar Chart.
- Next, update the data manually or can completely copy (Ctrl+C) the data from excel sheet or paste (Ctrl+V) it or else there is say option Load Example where the example data will be loaded.
- Next, you need to map the columns with the parameters.
- Finally, click on calculate at the bottom of the page and you will get desired results.
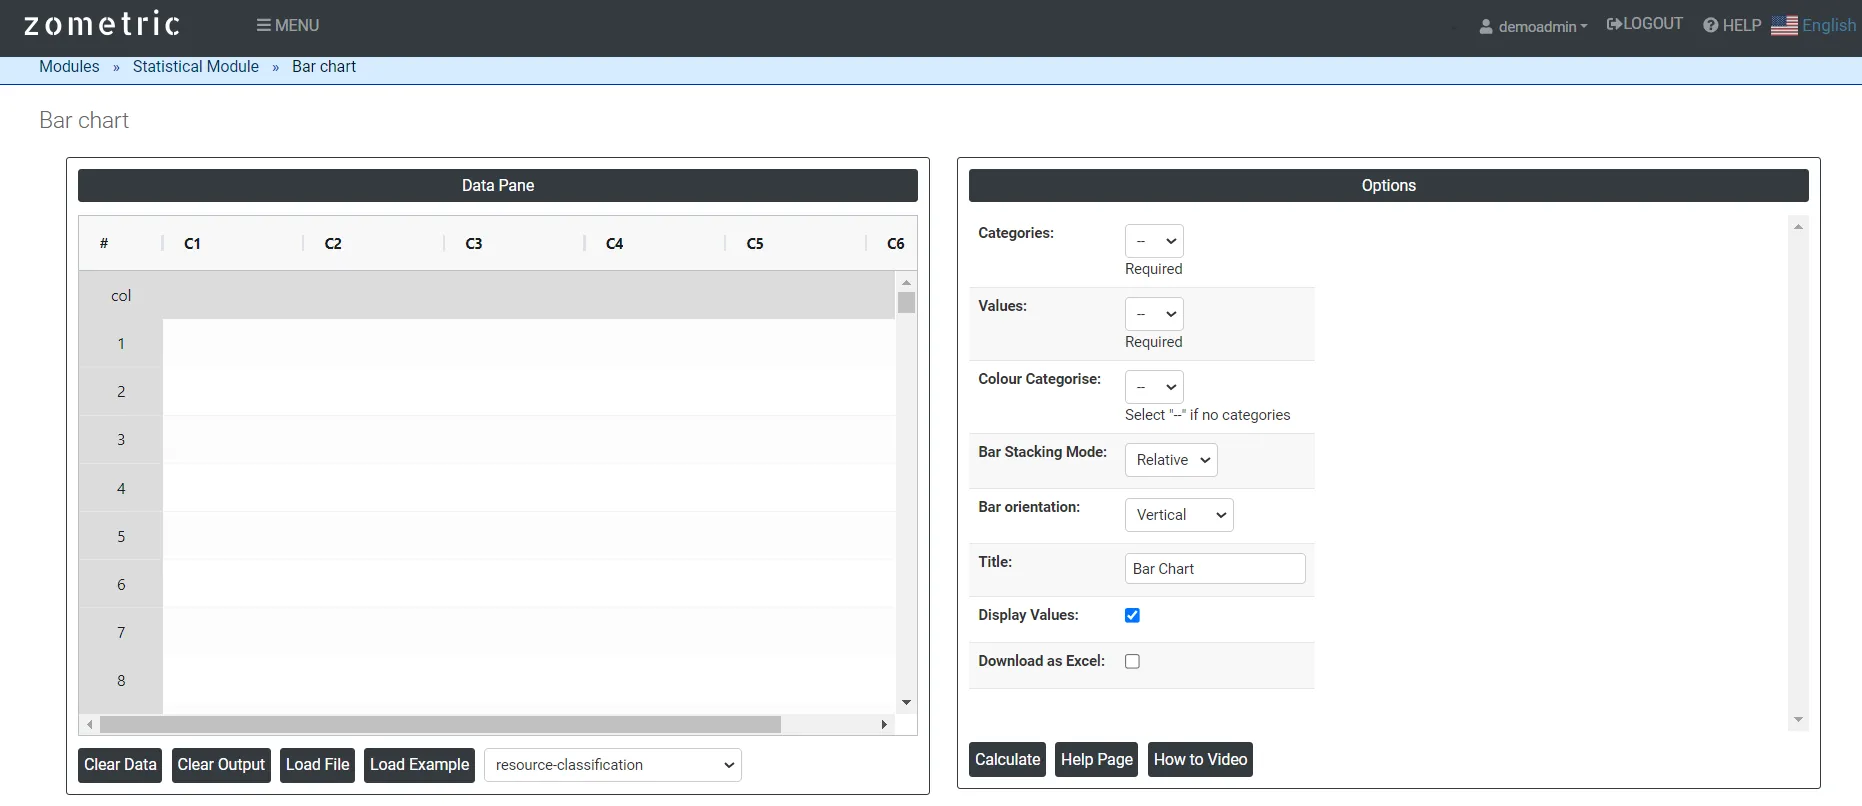
On the dashboard of Bar Chart, the window is separated into two parts.
On the left part, Data Pane is present. In the Data Pane, each row makes one subgroup. Data can be fed manually or the one can completely copy (Ctrl+C) the data from excel sheet and paste (Ctrl+V) it here.
Load example: Sample data will be loaded.
Load File: It is used to directly load the excel data.
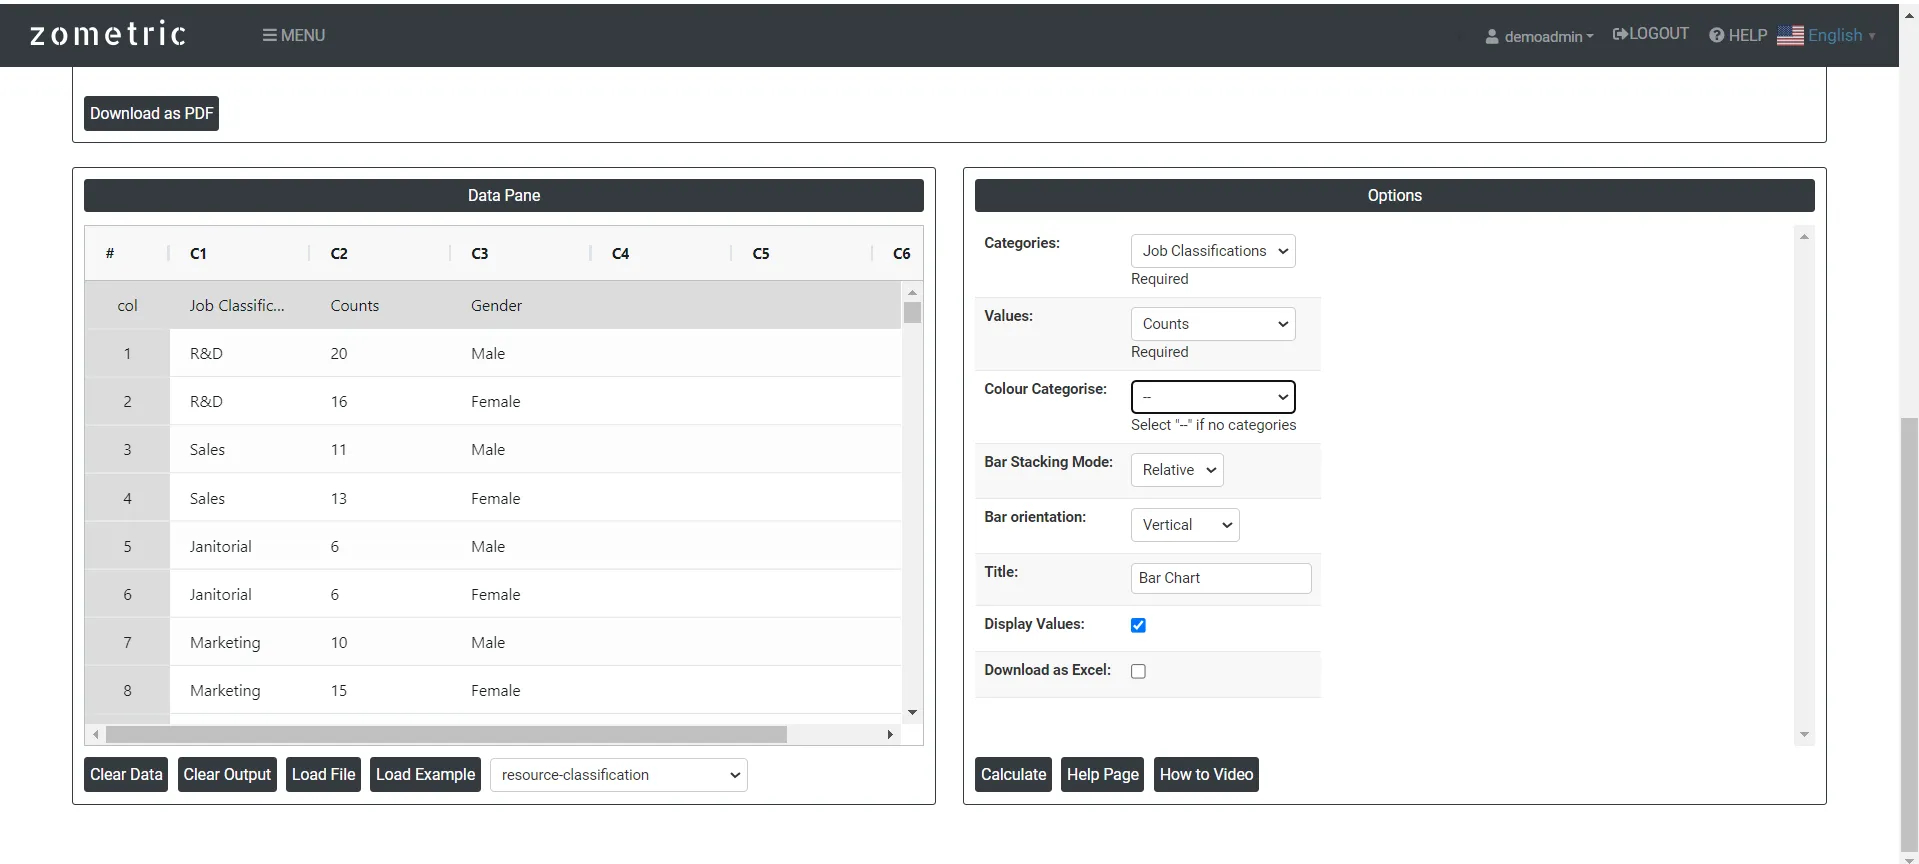
On the right part, there are many options present as follows:
- Categories: Each bar in the chart represents a specific category or group.
- Values: The length or height of the bar corresponds to the value or frequency associated with that category.
- Color Categories: Color categorization refers to the use of different colors to visually differentiate and categorize the bars based on additional variables or subgroups within the data.
- Bar Stacking Mode:
- Group: This is particularly useful when you want to compare multiple categories or subcategories within a larger data set. By using group bar mode, you can visually compare the values of different groups and subgroups more easily.
- Relative: In this mode, the height of each bar represents the relative proportion or percentage of the data point it represents.
- Overlay: By overlaying the bars, it becomes easier to see the overall composition and the relationship between the different categories.
- Bar Orientation: It refers to the direction in which the bars are displayed. Bar charts can have two main orientations: horizontal and vertical.
- Vertical Bar Chart: The bars are displayed vertically along the y-axis. The length or height of each bar represents the value it represents. The x-axis typically represents the categories or data points being compared. Vertical bar charts are commonly used when the labels or categories have longer names or when there is a large number of categories to display.
- Horizontal Bar Chart: The bars are displayed horizontally along the x-axis. The length or width of each bar represents the value it represents. The y-axis represents the categories or data points being compared. Horizontal bar charts are often used when the labels or categories have shorter names and when it is important to emphasize the comparison of values.
- Download as Excel: This will display the result in an Excel format, which can be easily edited and reloaded for calculations using the load file option.