What is Binary Logistic Regression?
When to use Binary Logistic Regression?
Predictor Variables
- Predictors can be continuous, categorical, or a mix of both
- Discrete variables can be treated as continuous or categorical depending on the number of levels and the goal of the analysis
- Only one continuous predictor with a continuous response → use Fit Line Model
- Multiple predictors with a continuous response → use Fit Regression Model
Response Variable
- The response must have exactly two categories (e.g. pass/fail, yes/no, good/bad)
- If the response is continuous → use Fit Regression Model
- If the response has three or more unordered categories → use Nominal Logistic Regression
- If the response has three or more ordered categories → use Ordinal Logistic Regression
Guidelines for correct usage of Binary Logistic Regression
- The response variable must have exactly two categories; if it has more, use Ordinal or Nominal Logistic Regression instead.
- Predictors can be continuous or categorical; ensure each variable is correctly classified before running the analysis.
- Ensure the data accurately represents the target population; biased or incomplete data produces unreliable predictions.
- Collect sufficient data points for both categories — having very few observations in one category makes the model unstable and predictions untrustworthy.
- Measure all variables as accurately as possible; errors in input data directly reduce the accuracy of the predicted probabilities.
- Record data in the order it is collected to help identify any time-based patterns that could affect results.
- After fitting, validate the model using goodness-of-fit statistics and residual diagnostics; a poorly fitting model produces misleading predictions.
- Avoid perfect separation — where one predictor completely separates the two categories — as this causes estimation problems in the model.
Alternatives: When not to use Binary Logistic Regression
- If the response variable is continuous, use Fit Regression Model instead.
- If you have only one continuous predictor with a continuous response, use Fit Line Model instead.
- If the response has three or more unordered categories, use Nominal Logistic Regression instead.
- If the response has three or more ordered categories, use Ordinal Logistic Regression instead.
- If you have one categorical predictor with a continuous response, use One-Way ANOVA instead.
Example of Binary Logistic Regression
A materials engineer at a furniture manufacturing site wants to determine if there is a relationship between the density and stiffness of particle board. To investigate this, the engineer collects measurements of stiffness and density from a sample of board pieces and applies simple linear regression to analyze the association. To evaluate this, the engineer performs the following steps:
- Gathered the necessary data.
- Now analyses the data with the help of https://qtools.zometric.com/ or https://intelliqs.zometric.com/.
- To find Binary Logistic Regression choose https://intelliqs.zometric.com/> Statistical module> Regression>Binary Logistic Regression.
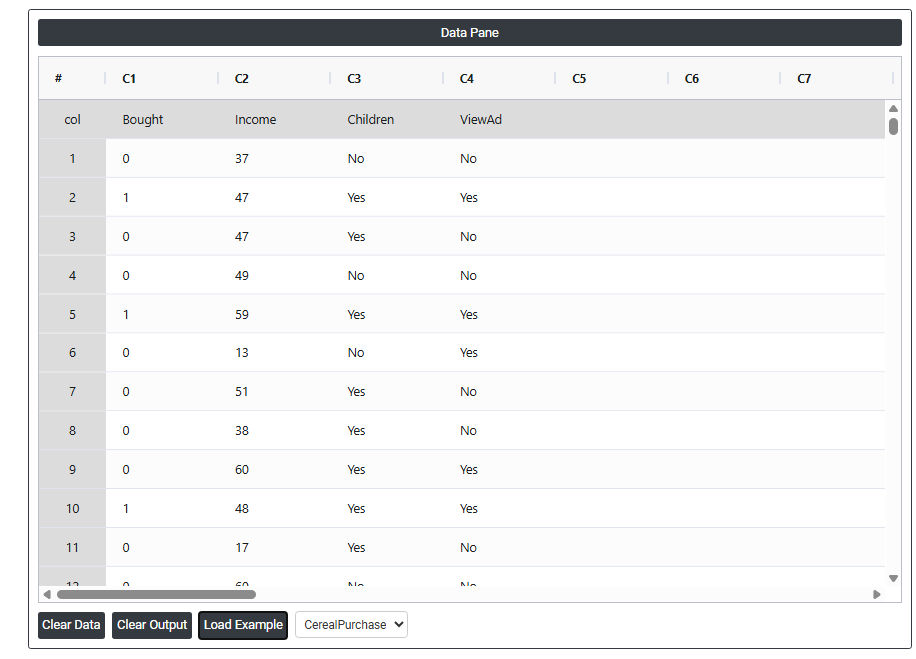
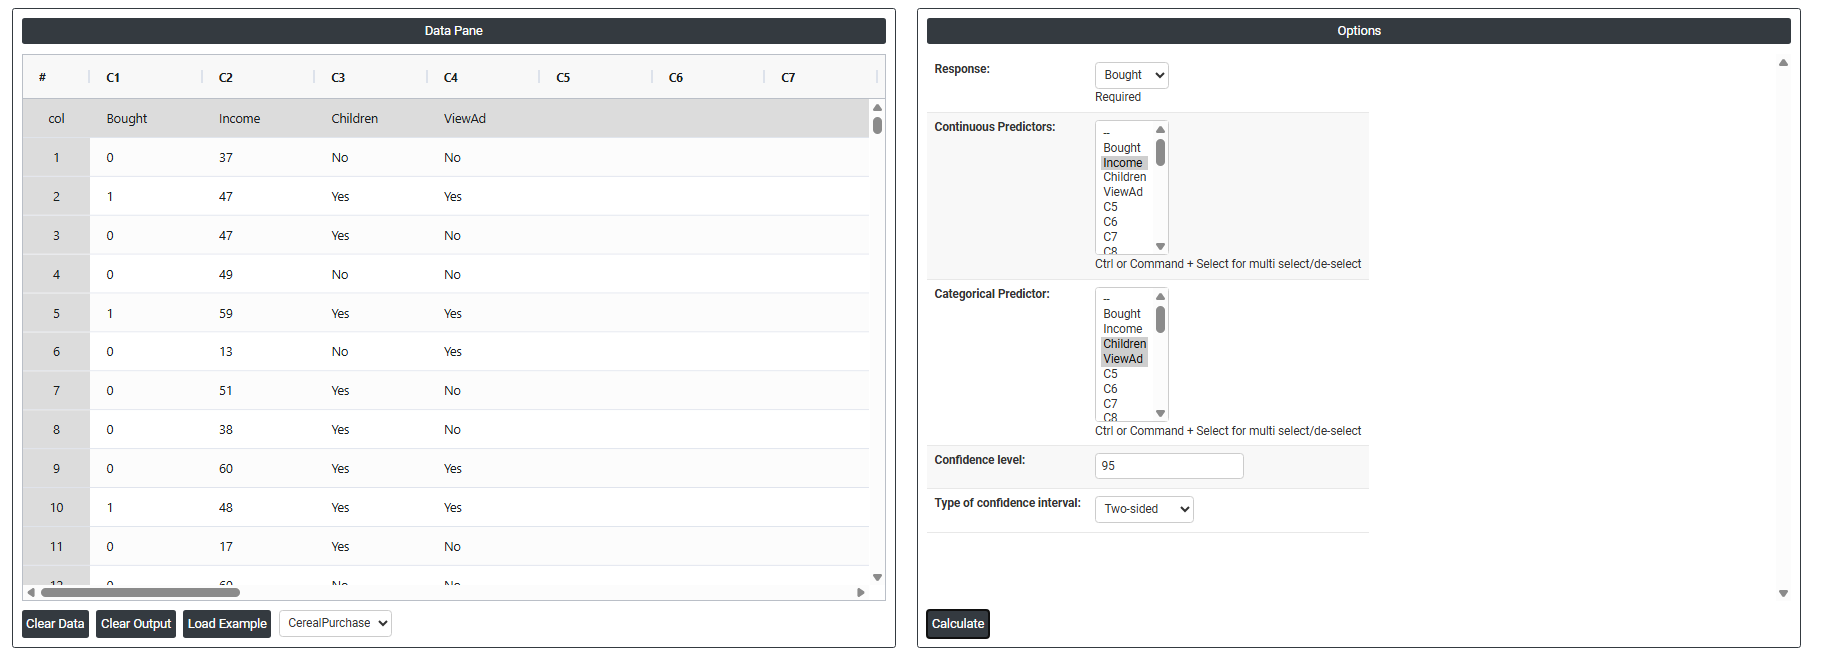
- Inside the tool, feeds the data along with other inputs as follows:
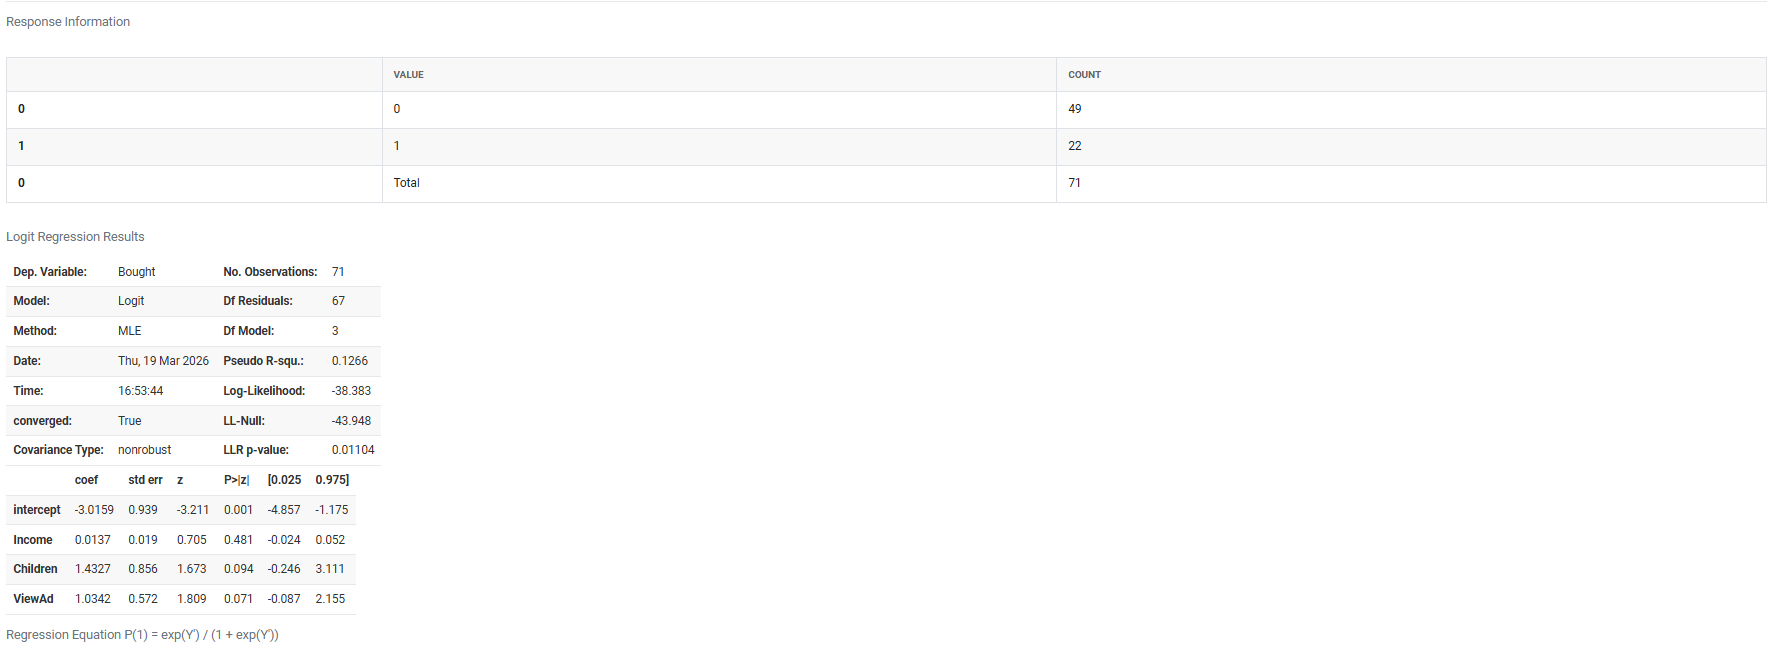
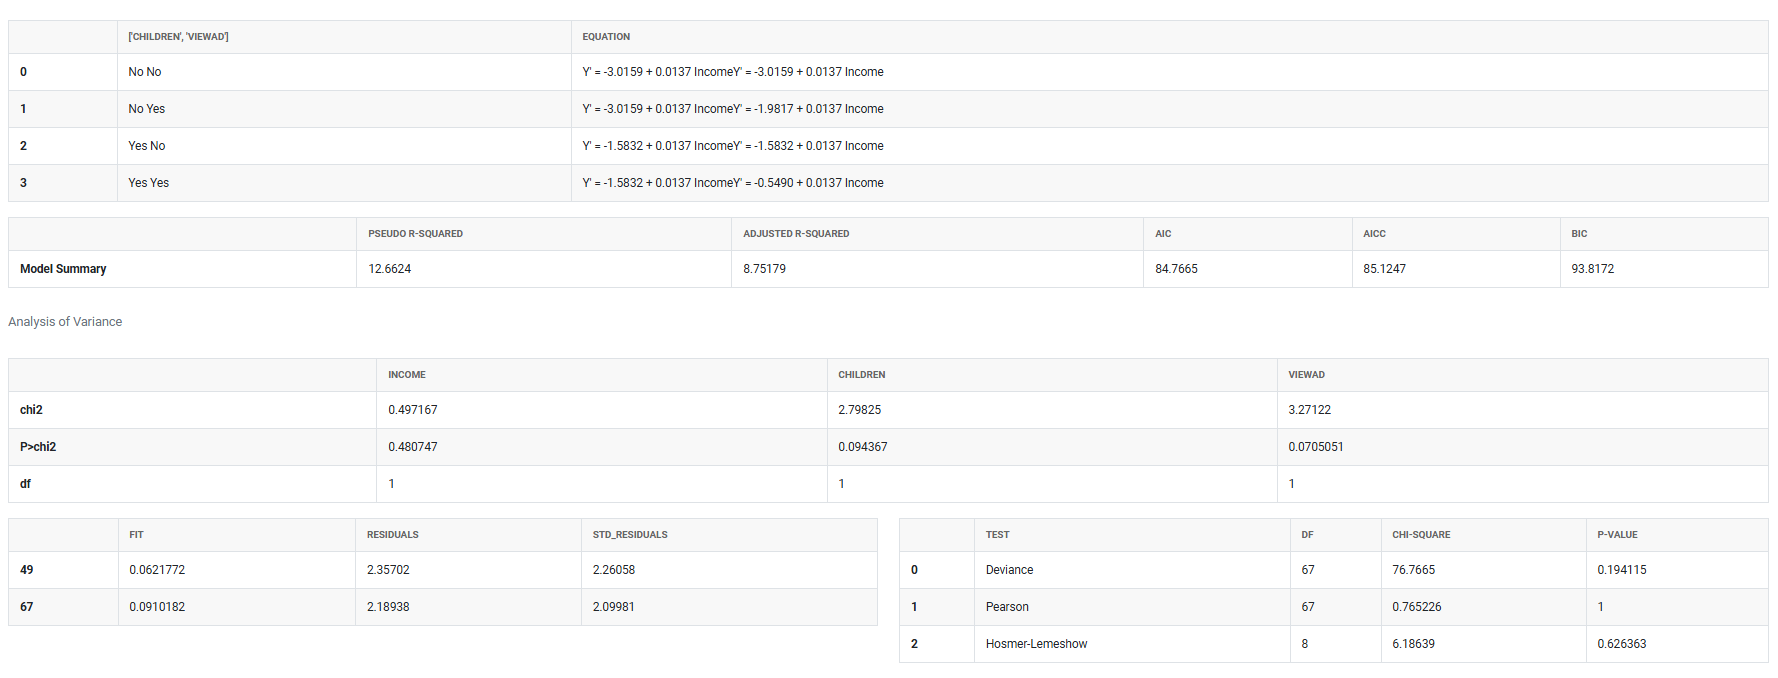
5. After using the above mentioned tool, fetches the output as follows:
How to do Fit Line Model
The guide is as follows:
- Login in to QTools account with the help of https://qtools.zometric.com/ or https://intelliqs.zometric.com/
- On the home page, choose Statistical Tool>Regression >Binary Logistic Regression .
- Click on Binary Logistic Regression and reach the dashboard.
- Next, update the data manually or can completely copy (Ctrl+C) the data from excel sheet and paste (Ctrl+V) it here.
- Fill the required options given on the left side.
- Finally, click on calculate at the bottom of the page and you will get desired results.
On the dashboard of Binary Logistic Regression, the window is separated into two parts.
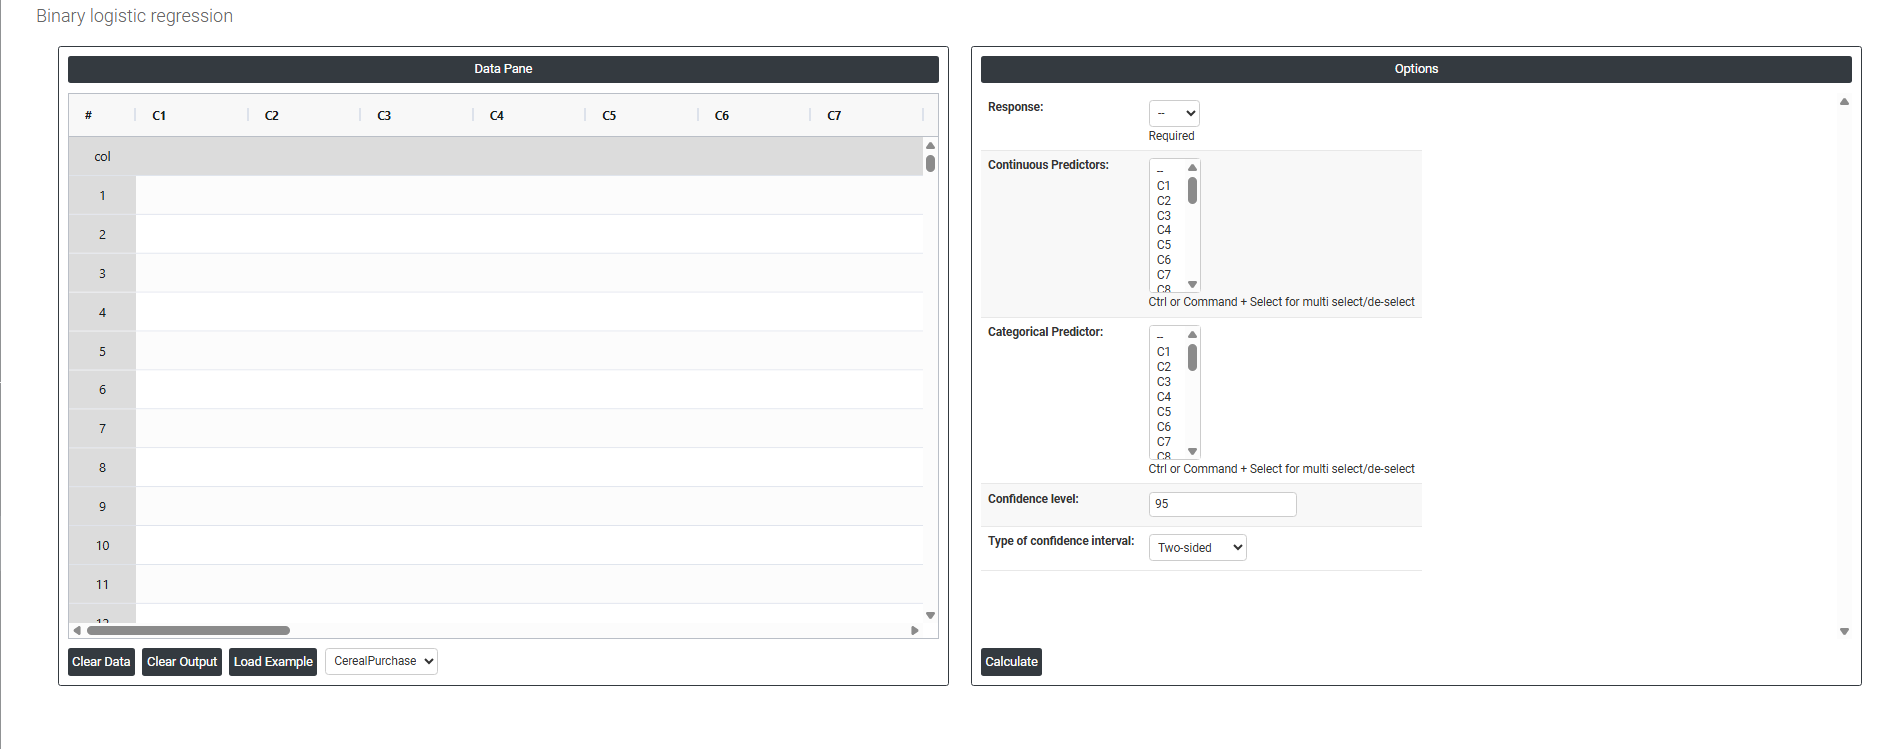
On the left part, Data Pane is present. In the Data Pane, each row makes one subgroup. Data can be fed manually or the one can completely copy (Ctrl+C) the data from excel sheet and paste (Ctrl+V) it here.
Load example: Sample data will be loaded.
Load File: It is used to directly load the excel data.
On the right part, there are many options present as follows:
-
Response The outcome variable you are trying to predict it must contain exactly two categories, such as pass/fail, yes/no, or defective/non-defective. The model calculates the probability of one category occurring over the other based on the predictor values entered.
-
Categorical Predictor A predictor variable that contains a fixed set of distinct groups or labels, such as shift, machine type, or supplier. The model estimates how belonging to each group changes the probability of the response falling into one category versus the other.
-
Continuous Predictor A predictor variable that holds measurable numeric values, such as temperature, speed, or weight. The model estimates how a unit increase in this variable increases or decreases the probability of the response outcome occurring.
-
Confidence Interval A range of values within which the true result is likely to fall. The default is 95%, meaning you are 95% confident the true probability or coefficient lies within that range. It is set at 95% by default as it is the widely accepted standard that balances statistical reliability with practical usability — narrow enough to be useful, wide enough to account for uncertainty.
-
Type of Confidence Interval
- Two-Sided — provides both a lower and upper boundary, showing the range where the true value is likely to fall on both ends. Use this when you want to detect any difference, either above or below. This is the default and most commonly used option.
- Upper Bound — provides only the maximum limit, showing the highest value the true result is likely to reach. Use this when you are only concerned about whether the value exceeds a certain threshold.
- Lower Bound — provides only the minimum limit, showing the lowest value the true result is likely to be. Use this when you are only concerned about whether the value falls below a certain threshold.