What is Box-Cox Transformation?
When to use Box-Cox Transformation?
- Use when your data is continuous but not normally distributed — for example, heavily skewed process measurements.
- Apply before running capability analysis, control charts, or regression that assume normality.
- Do not use on data that is already normally distributed — applying an unnecessary transformation can distort results.
How Lambda (λ) Works
Lambda is the key parameter that controls the shape of the transformation. The tool automatically finds the best lambda value for your data.
| Lambda Value | Effect on Data |
| λ = 2 | Square transformation — compresses right skew |
| λ = 1 | No transformation — data is used as-is |
| λ = 0.5 | Square root transformation — mild skew correction |
| λ = 0 | Natural log transformation — moderate skew correction |
| λ = −1 | Inverse transformation — strong skew correction |
Guidelines for correct usage of Box-Cox Transformation
- All data values must be positive — Box-Cox cannot handle zero or negative values.
- Collect at least 20 to 30 data points for the transformation to estimate lambda reliably.
- After transformation, always verify normality using a probability plot or normality test before proceeding.
- Use the rounded lambda value provided in the output for practical interpretation — it is easier to communicate.
- Remember that all capability statistics (Cp, Cpk) are reported in the transformed scale, not the original data scale.
Alternatives: When not to use Box-Cox Transformation
- If your data is already normally distributed, no transformation is needed — applying Box-Cox unnecessarily can distort results.
- If your data contains zero or negative values, use Johnson Transformation instead, which handles the full range of values.
- If your data is attribute-based (pass/fail, counts), use Binomial or Poisson Capability Analysis
- If the data follows a known non-normal distribution (e.g. Weibull, Exponential), use Nonnormal Capability Analysis with that specific distribution instead.
- If you have fewer than 20 data points, the lambda estimate may be unreliable — collect more data before applying any transformation.
- If your data is already normally distributed, no transformation is needed — applying Box-Cox unnecessarily can distort results.
- If your data contains zero or negative values, use Johnson Transformation instead, which handles the full range of values.
- If the data follows a known non-normal distribution (e.g. Weibull, Exponential), use Nonnormal Capability Analysis with that specific distribution instead.
- If you have fewer than 20 data points, the lambda estimate may be unreliable — collect more data before applying any transformation.
Example of Box-Cox Transformation
A quality engineer at a nutritional supplement company aims to evaluate the calcium content in vitamin capsules. The engineer gathers a random sample of capsules and measures their calcium levels. Based on previous observations, the engineer is aware that the data distribution is right-skewed.
To address this, the engineer applies the Johnson transformation to normalize the data and saves the transformed values in the worksheet for additional analysis. It performs the following steps:
- Gathered the necessary data.
- Now analyses the data with the help of https://qtools.zometric.com/ or https://intelliqs.zometric.com/.
- To find Box-Cox Transformation choose https://intelliqs.zometric.com/> Statistical module> Control Charts>Box-Cox Transformation.
- Inside the tool, feeds the data along with other inputs as follows:
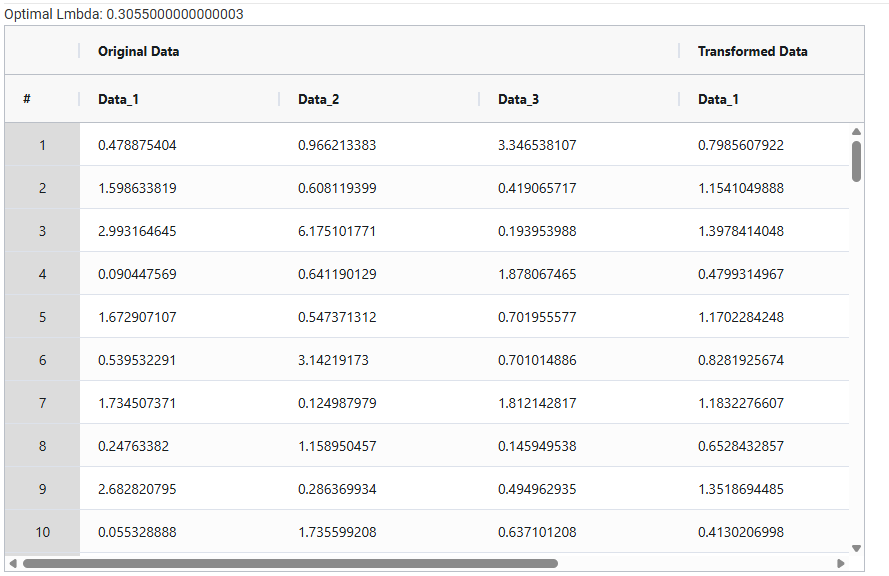
5. After using the above mentioned tool, fetches the output as follows:
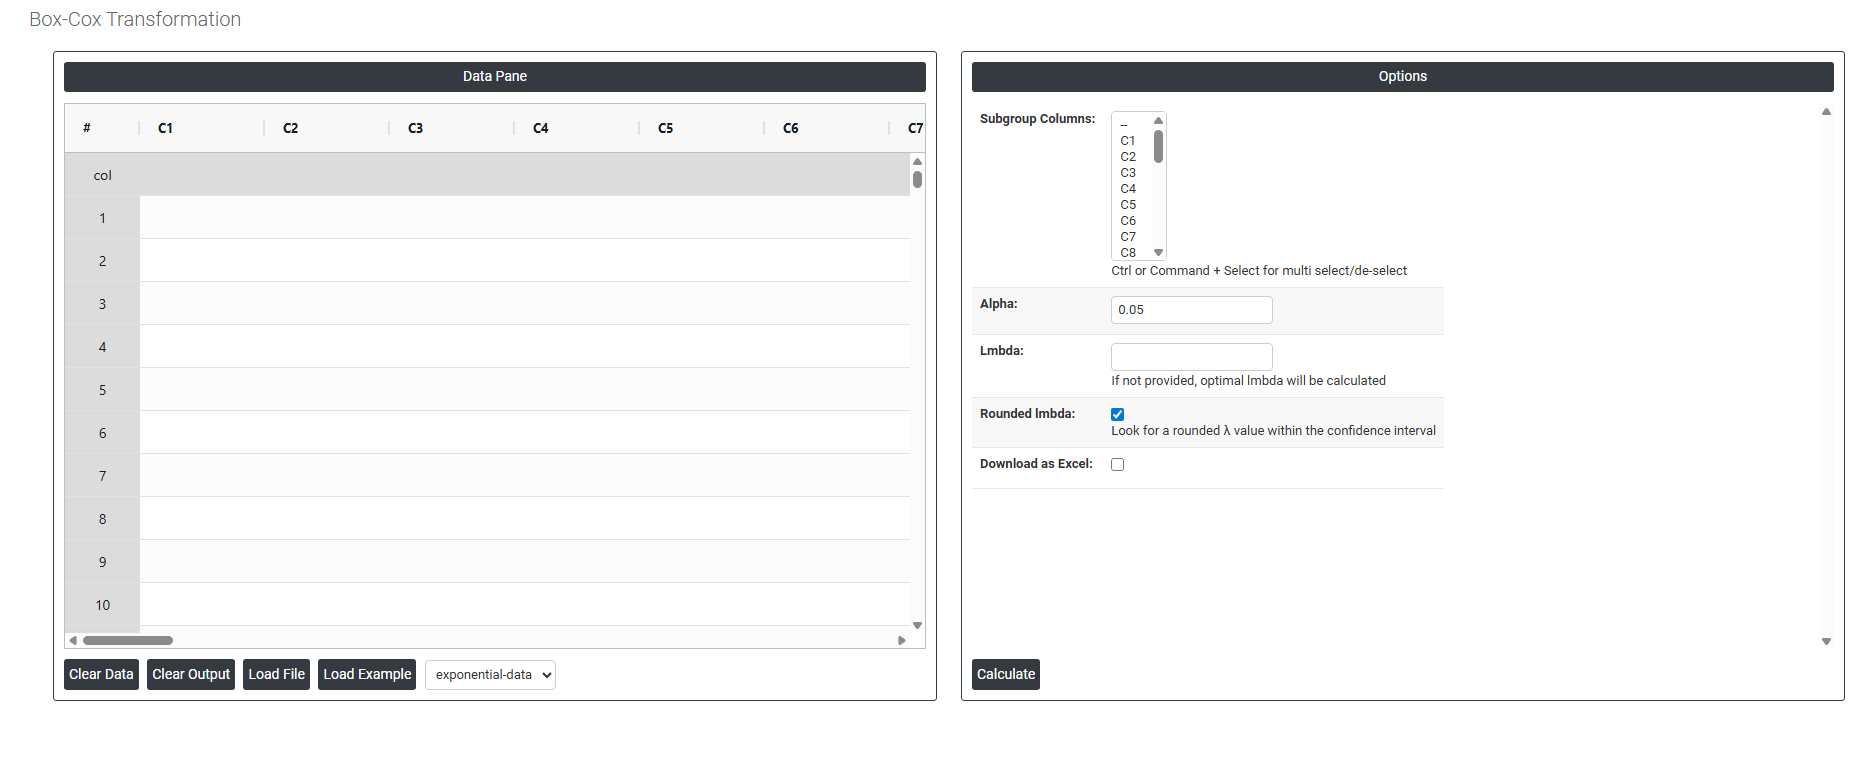
How to do Box-Cox Transformation
The guide is as follows:
- Login in to QTools account with the help of https://qtools.zometric.com/ or https://intelliqs.zometric.com/
- On the home page, choose Statistical Tool> Control Charts >Box-Cox Transformation.
- Click on Box-Cox Transformation and reach the dashboard.
- Next, update the data manually or can completely copy (Ctrl+C) the data from excel sheet and paste (Ctrl+V) it here.
- Next, you need to fill the required options .
- Finally, click on calculate at the bottom of the page and you will get desired results.
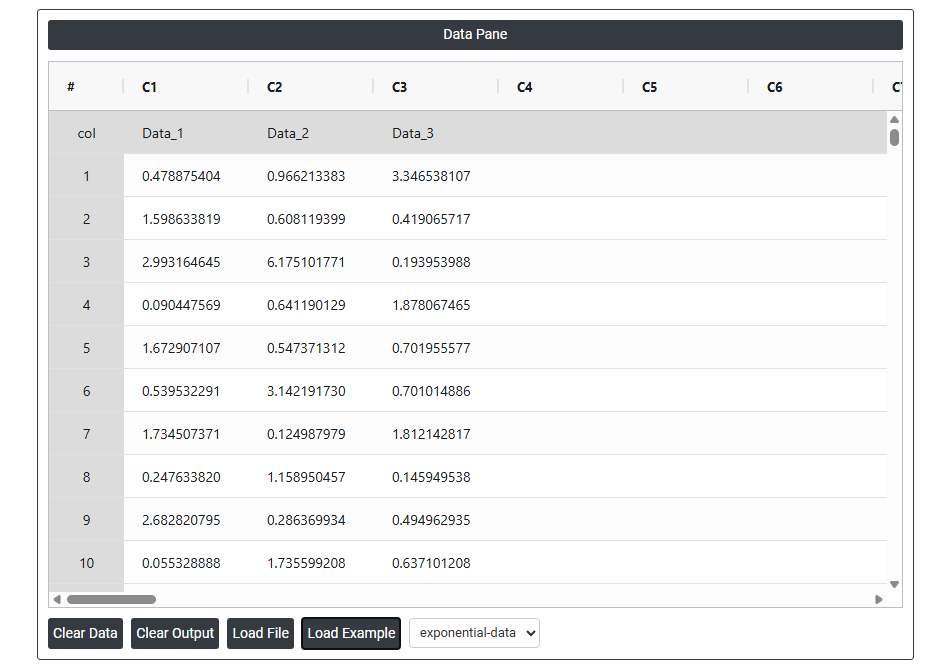
On the dashboard of Box-Cox Transformation, the window is separated into two parts.
On the left part, Data Pane is present. In the Data Pane, each row makes one subgroup. Data can be fed manually or the one can completely copy (Ctrl+C) the data from excel sheet and paste (Ctrl+V) it here.
Load example: Sample data will be loaded.
Load File: It is used to directly load the excel data.
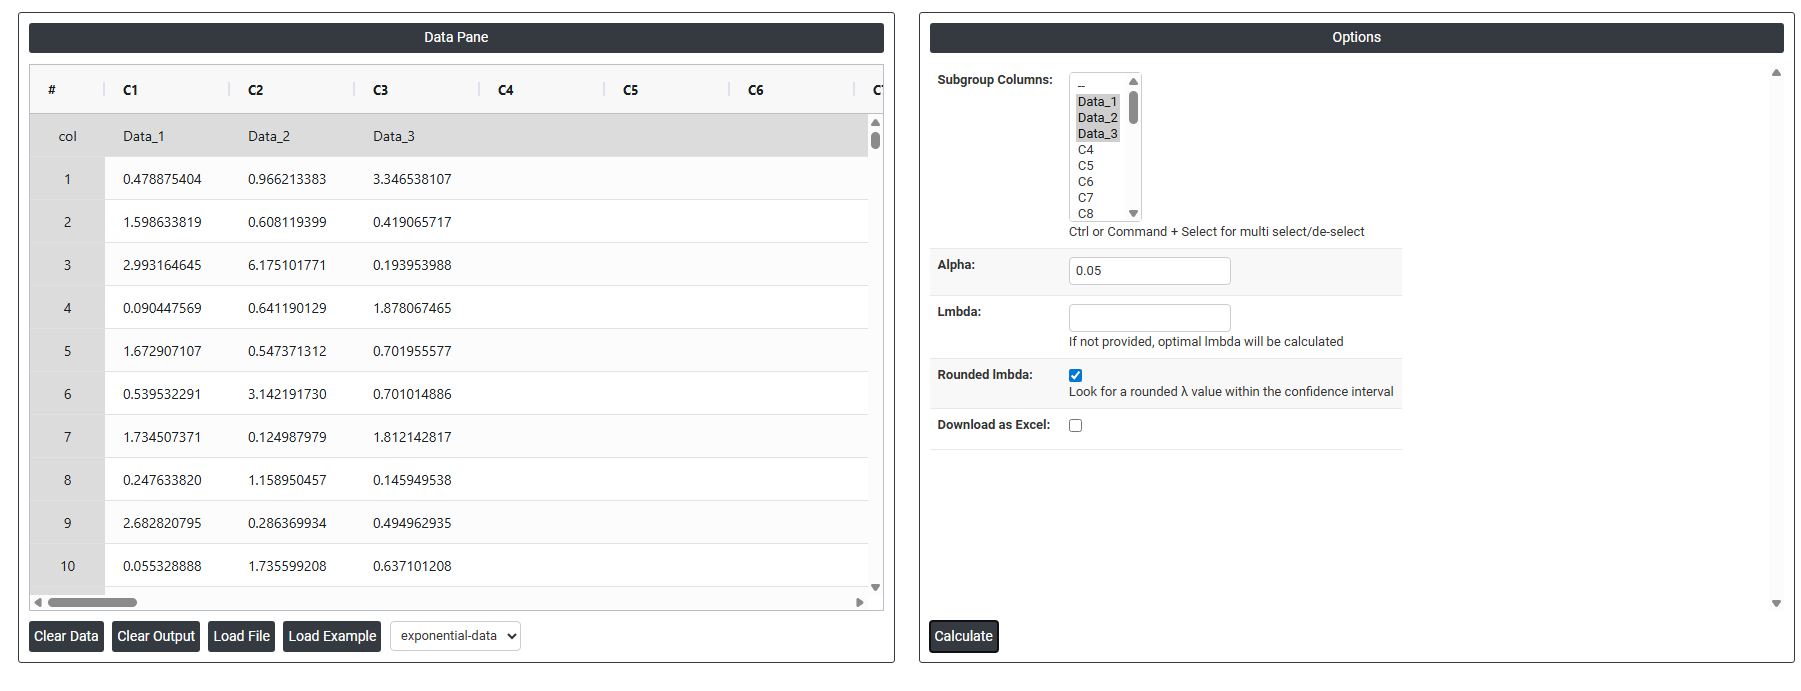
On the right part, there are many options present as follows:
-
Subgroup Columns Defines how your data is organised before the transformation is applied. If your data is arranged in separate columns where each column represents a subgroup, select those columns here. This tells the tool how to read and group the measurements so the correct lambda is calculated across the right data structure.
-
Alpha (Default 0.05) Sets the significance level used to determine the confidence interval for lambda. The default of 0.05 means there is a 5% chance of incorrectly rejecting a lambda value, giving you a 95% confidence interval around the best-fit lambda. A lower alpha makes the confidence interval wider and more conservative; a higher alpha narrows it. The 0.05 default is the universally accepted standard in statistical analysis.
-
Lambda (λ) The transformation parameter that controls how the data is mathematically reshaped. The tool automatically searches for the optimal lambda value that makes your data as close to normally distributed as possible. The exact lambda is the precise mathematical value calculated from your data — it may be a decimal like 0.3271 or −0.8145.
-
Rounded Lambda A simplified, practical version of the exact lambda value, rounded to a standard number such as 0, 0.5, or 1. This is recommended for real-world use because it corresponds to a recognisable transformation (e.g. log, square root) that is easier to explain, document, and reproduce. In most cases, the rounded lambda gives nearly the same result as the exact value with far greater interpretability.
- Download as Excel: This will display the result in an Excel format, which can be easily edited and reloaded for calculations using the load file option.