What is Capability Six Pack Between/Within?
The Capability Six Pack (Between/Within) is a comprehensive, single-page capability report that combines six key statistical charts and metrics into one unified view giving both a graphical and numerical assessment of process capability. It is specifically designed for processes where measurements are taken in subgroups collected infrequently, and where variation from two distinct sources needs to be evaluated separately.
The "Between" variation refers to how much subgroup averages drift from one time period to the next, while "Within" variation refers to how much measurements spread inside each individual subgroup. By separating and reporting both, this analysis reveals whether the biggest capability problem comes from inconsistency between batches or from spread within each batch a distinction that is critical for correctly identifying and fixing the root cause.
The six components typically included in the report are: an I-MR or Xbar chart to check process stability, an R or S chart for within-subgroup variation, a capability histogram, a normal probability plot, and both within-subgroup and between/within (overall) capability indices.
Simple Definition: A one-page capability report that shows both the process stability charts and the capability statistics together and separates variation into two sources (within subgroups and between subgroups) so you can pinpoint exactly where performance problems are coming from.
When to use Capability Six Pack Between/Within?
- Use when data is continuous and collected in subgroups that are gathered at discrete, infrequent intervals — such as once per shift, once per batch, or once per day.
- Use when you need to separate and compare within-subgroup variation and between-subgroup variation for example, to understand whether process spread or process drift is the bigger problem.
- Use when a comprehensive, presentation-ready capability summary is needed that combines process stability evidence with capability results in a single report.
- Use when both short-term (within) and long-term (between/within) capability indices are required, as many quality standards and customer reporting requirements ask for both.
Guidelines for correct usage of Capability Six Pack Between/Within
- Ensure the process is stable and in statistical control before interpreting capability indices — check the control charts in the Six Pack first and resolve any out-of-control signals.
- Collect at least 25 subgroups to establish reliable control limits and stable capability estimates across both variation sources.
- Verify that data is approximately normally distributed using the probability plot within the Six Pack — if normality is violated, apply a transformation or use Non-Normal Capability instead.
- Interpret within-subgroup Cp and Cpk as short-term potential capability — what the process could achieve if subgroup-to-subgroup drift were eliminated.
- Interpret between/within Pp and Ppk as overall long-term performance capability — what the process actually delivers in practice including all sources of variation.
- A large gap between within and between/within capability indices indicates significant batch-to-batch or time-to-time variation that should be investigated and reduced.
Alternatives: When not to use Capability Six Pack Between/Within
| Situation | Use Instead |
| Data consists of individual measurements with no subgroups | I-MR Capability |
| Only one source of variation needs reporting | Normal Process Capability (Within or Overall only) |
| Data is non-normal and no transformation is available | Non-Normal or Nonparametric Capability Analysis |
| Data is attribute-based (pass/fail or counts) | Binomial or Poisson Capability Analysis |
| Subgroups are collected very frequently with no between-subgroup drift expected | Standard Xbar-R or Xbar-S Capability Analysis |
Example of Capability Six Pack Between/Within
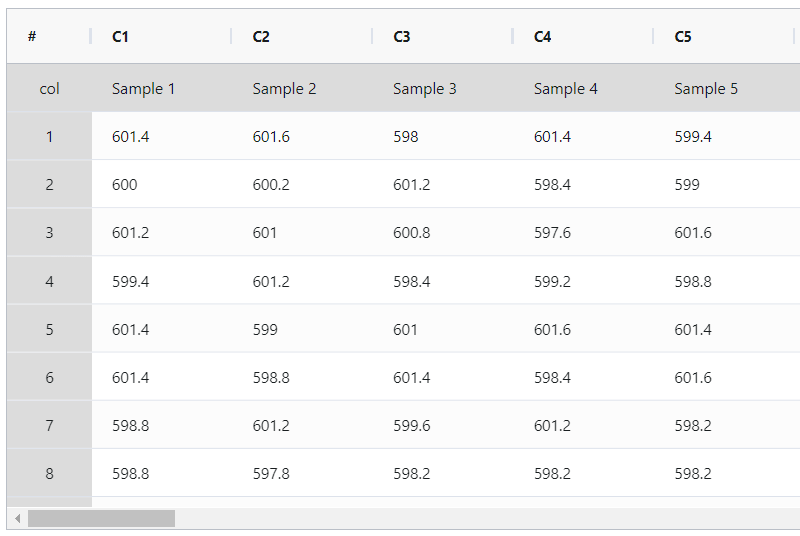
The quality engineer at an automotive parts plant is evaluating the process capability of the machine used to produce camshafts. The engineer collects data in subgroups of size 5 every 30 minutes from one of the machines. The specified limits for camshaft length are a Lower Specification Limit (LSL) of 595 mm, a Target of 600 mm, and an Upper Specification Limit (USL) of 605 mm. To assess the assumptions necessary for normal capability analysis and determine how well the camshaft lengths meet the specified requirements, the engineer conducts a normal capability sixpack analysis. The following steps:
- Gathered the necessary data.
- Now analyses the data with the help of https://qtools.zometric.com/or https://intelliqs.zometric.com/.
- To find Capability Six Pack Between/Within choose https://intelliqs.zometric.com/> Statistical module> Process Capability>Capability Six Pack Between/Within.
- Inside the tool, feeds the data along with other inputs as follows:
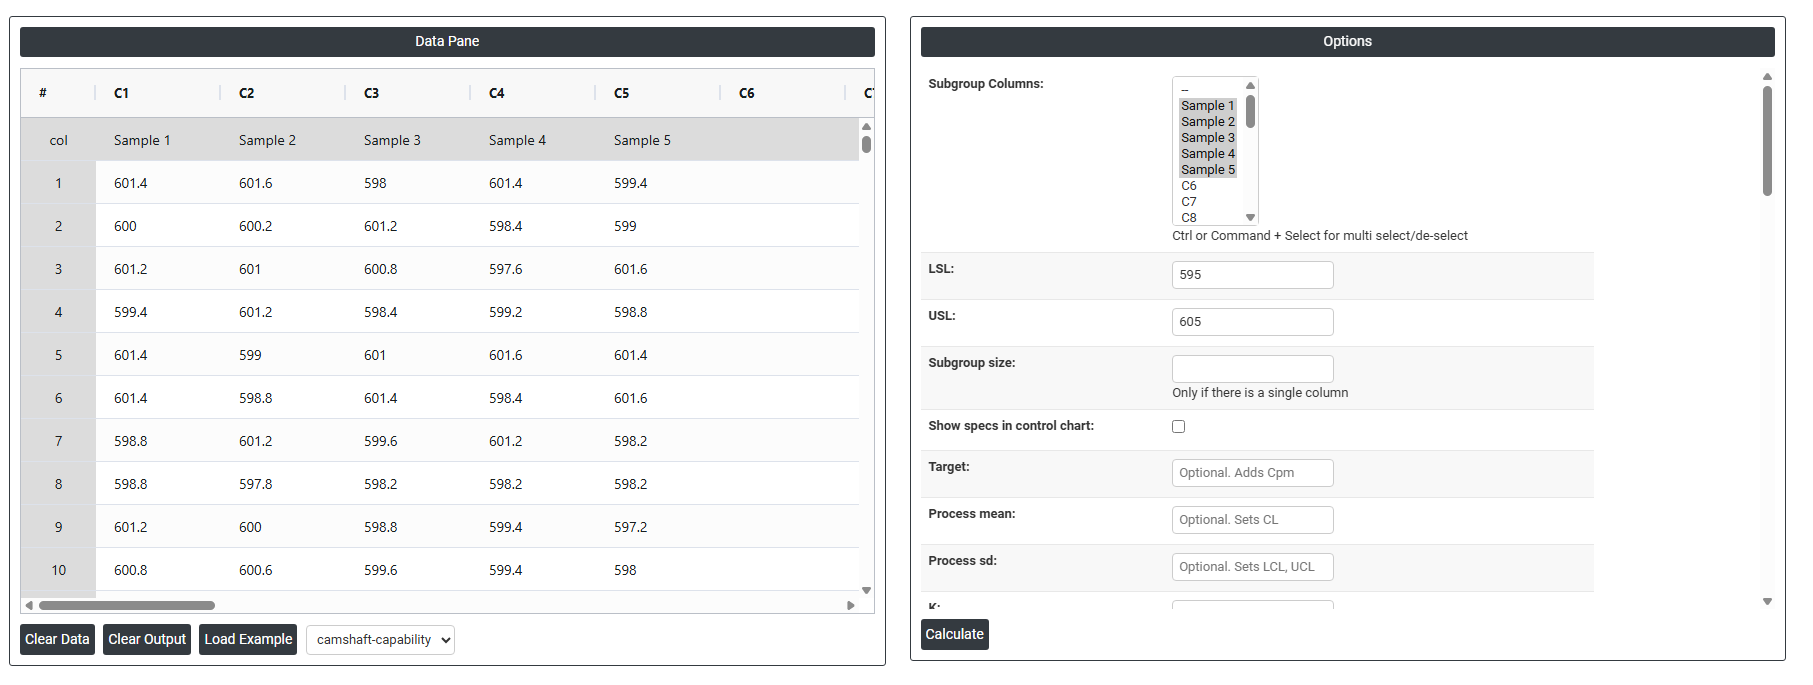
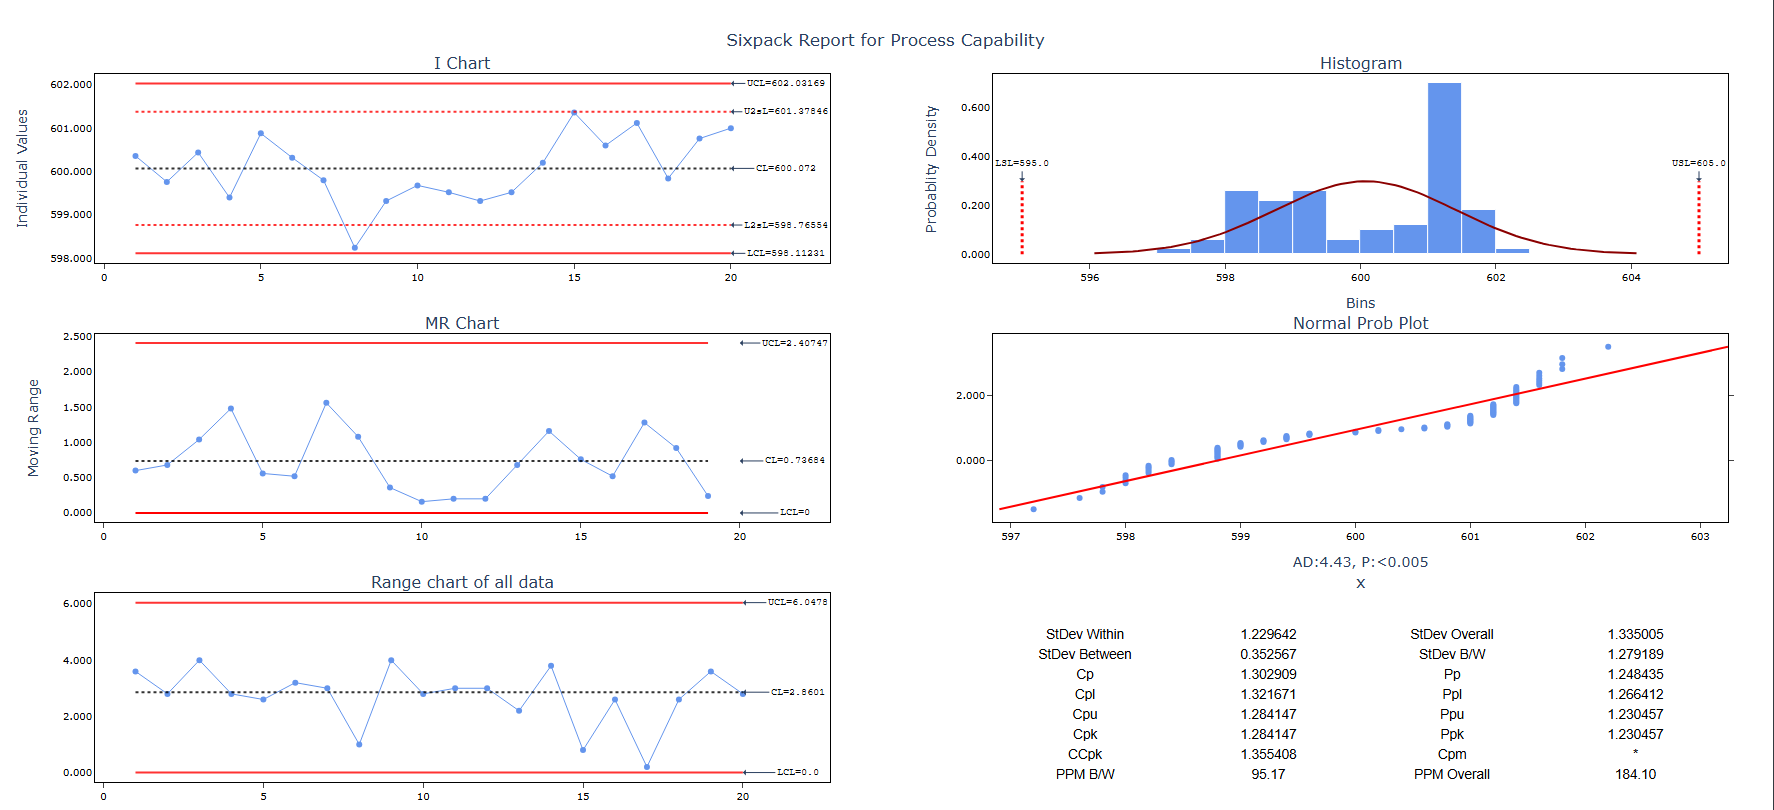
- After using the above mentioned tool, fetches the output as follows:

How to do Capability Six Pack Between/Within
The guide is as follows:
- Login in to QTools account with the help of https://qtools.zometric.com/ or https://intelliqs.zometric.com/
- On the home page, choose Statistical Tool> Process Capability >Capability Six Pack Between/Within.
- Next, update the data manually or can completely copy (Ctrl+C) the data from excel sheet and paste (Ctrl+V) it here.
- Next, you need to fill the desired details such as lsl, usl, target, K, etc.
- Finally, click on calculate at the bottom of the page and you will get desired results.
On the dashboard of Capability Six Pack Between/Within, the window is separated into two parts.
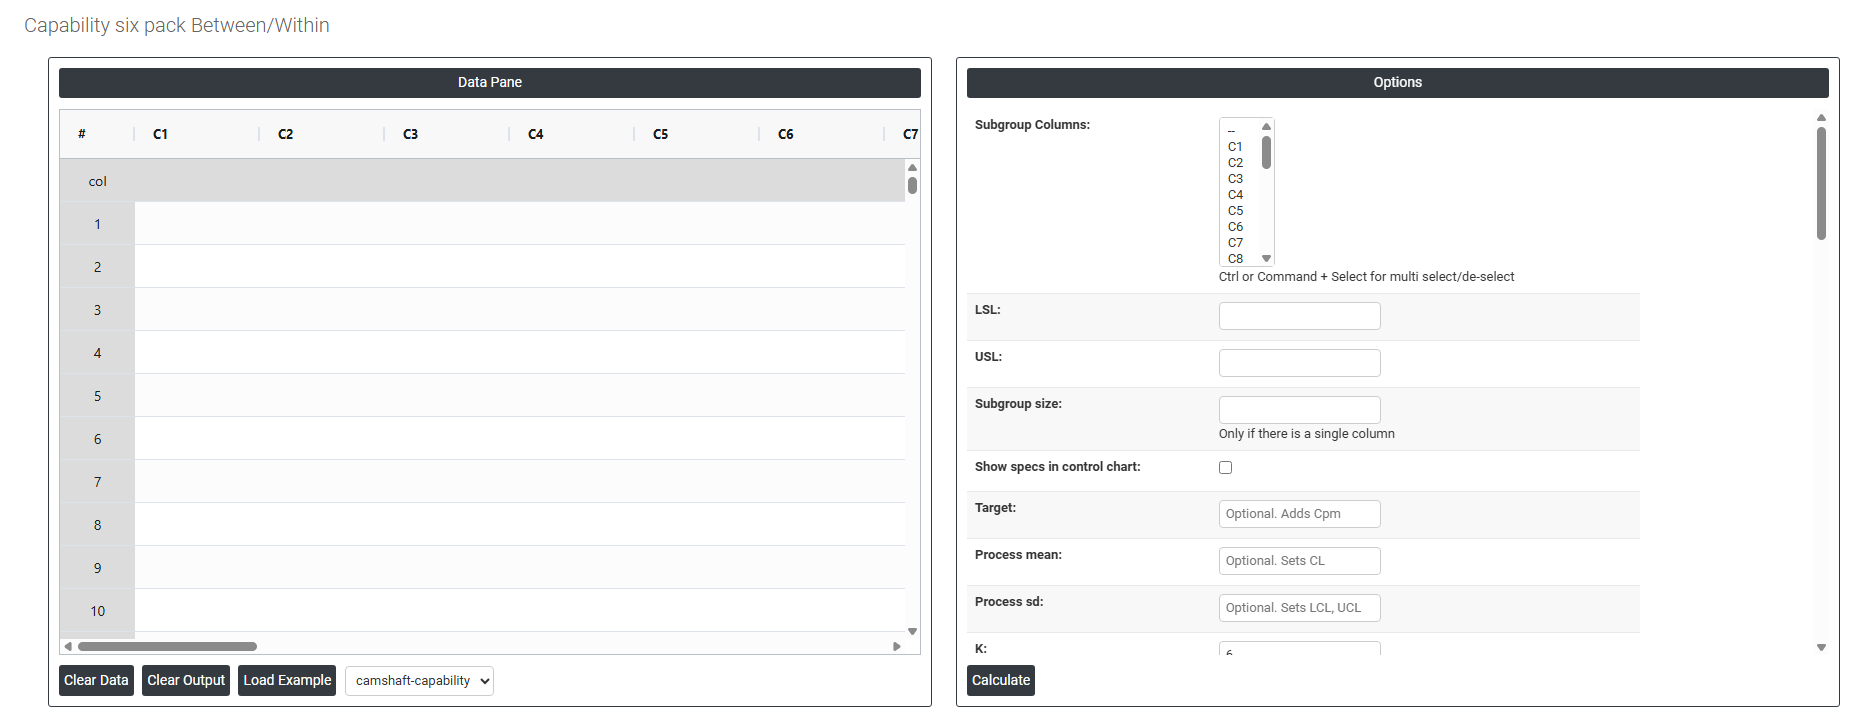
On the left part, Data Pane is present. In the Data Pane, each row makes one subgroup. Data can be fed manually or the one can completely copy (Ctrl+C) the data from excel sheet and paste (Ctrl+V) it here.
Load example: Sample data will be loaded.
Load File: It is used to directly load the excel data.
On the right part, there are many options present as follows:
- Subgroup Columns Select the column(s) containing your continuous measurement data. Use Ctrl or Command + Click to select multiple columns. Each column typically represents one measurement position within a subgroup, or all columns together form the complete dataset for analysis.
- Lsl: LSL in process capability refers to the Lower Specification Limit. It is the lower boundary or threshold set for a specific process parameter or characteristic. In process capability analysis, LSL is used to determine whether a process is capable of producing outputs within the desired range or specifications.
- Usl: USL in process capability refers to the Upper Specification Limit. It represents the upper boundary or threshold set for a specific process parameter or characteristic. During process capability analysis, the USL is used to assess whether a process is capable of producing outputs within the desired range or specifications.
- Subgroup Size Only required when all data is stored in a single column. Enter the fixed number of consecutive observations that form one subgroup. For example, entering 5 means rows 1–5 form subgroup 1, rows 6–10 form subgroup 2, and so on.
- Show specs in control chart: Adding specification limits to the control chart to visualize how process measurements align with quality standards. This helps in assessing whether the process remains within acceptable ranges.
- Target: In process capability, the target refers to the desired or ideal value for a specific process parameter or characteristic. It represents the value that the process is intended to achieve or center around. The target is often based on design specifications or customer requirements.
- Process mean: It is the average value of a set of measurements or observations from a process. It represents the central tendency of the process data over time and is a key indicator of the process performance. If not, Zometric Q-Tools calculates the centerline from the data provided.
- Process sd: It is a measure of the variability or dispersion of the process data around the mean. It provides an indication of how much individual data points within the process differ from the process average. If not, Zometric Q-Tools calculates from the data provided.
- K: In process capability, K refers to the process capability index known as the "Process Capability Index for Non-Centered Distribution" or simply the K-index. It is used to evaluate the capability of a process in relation to the specification limits.
- Sd estimation method:
- Average Moving Range: The average moving range is the mean value of the range of two or more consecutive points, typically used when the subgroup size is 1.
- Median Moving Range: The median moving range is the middle value of the range of two or more consecutive points, recommended when data have extreme ranges that could skew the moving range.
- Sd estimation method Xbar:
- Pooled: The pooled standard deviation is the weighted average of subgroup variances, with larger subgroups having a greater impact on the overall estimate. This method offers a more accurate estimate of the standard deviation when the process is stable.
- Rbar: Rbar represents the average of the ranges within subgroups. The Rbar method is a widely used estimate of the standard deviation, particularly effective for subgroup sizes ranging from 2 to 8.
- Sbar:It calculates the average standard deviation (Sbar) of subgroups to monitor process variability. Sbar is crucial for setting control limits on the S chart, indicating changes in data dispersion over time. This method ensures consistent and accurate assessment of process variation in quality control practices.
- Use Unbiasing Constants for pooled sd: Apply unbiasing constants in estimating the overall standard deviation.
- Length Moving Range Defines how many consecutive observations are used to calculate each moving range value. The default is 2, meaning each moving range is the absolute difference between two consecutive measurements. Increasing this value produces a smoother estimate but reduces sensitivity to short-term variation.
-
Report Information Fields The following fields populate the header section of the Six Pack report, providing full traceability and documentation context for the study. None are required for the analysis to run, but completing them produces a professional, audit-ready report.
- Company Name — the name of the organisation conducting the study
- Report Title — a descriptive title identifying the purpose of the capability study
- Customer Name — the customer or end user for whom the part or process is being qualified
- Part Number — the unique identifier for the part or product being measured
- Part Name — the descriptive name of the part or product
- Variable — the specific quality characteristic being measured (e.g. diameter, thickness, hardness)
- Unit of Measure — the measurement unit used (e.g. mm, kg, seconds, psi)
- Machine — the machine or equipment used to produce the measurements
- Operation — the specific process step or operation being evaluated
- Study Date — the date the capability study was conducted
- Shift — the production shift during which data was collected
- Operator — the person who operated the process during data collection
- Inspector — the person who performed the measurements or inspections
- Gauge — the measurement instrument or gauge used to collect the data
- Reported By — the person generating the report
- Prepared By — the person who set up and ran the analysis
- Verified By — the person who reviewed and verified the results
- Approved By — the authorising person who formally approves the report
- Remarks — any additional notes, observations, or contextual information relevant to the study
- Check Rule 1: 1 point > K Stdev from center line: Test 1 is essential for identifying subgroups that significantly deviate from others, making it a universally recognized tool for detecting out-of-control situations. To increase sensitivity and detect smaller shifts in the process, Test 2 can be used in conjunction with Test 1, enhancing the effectiveness of control charts.
- Check Rule 2: K points in a row on same side of center line: Test 2 detects changes in process centering or variation. When monitoring for small shifts in the process, Test 2 can be used in conjunction with Test 1 to enhance the sensitivity of control charts.
- Check Rule 3: K points in a row, all increasing or all decreasing: Test 3 is designed to identify trends within a process. This test specifically looks for an extended sequence of consecutive data points that consistently increase or decrease in value, signaling a potential underlying trend in the process behavior.
- Check Rule 4: K points in a row, alternating up and down: Test 4 is designed to identify systematic variations within a process. Ideally, the pattern of variation in a process should be random. However, if a point fails Test 4, it may indicate that the variation is not random but instead follows a predictable pattern.
- Check Rule 5: K out of K + 1 points > 2 standard deviation from center line (same side): Test 5 detects small shifts in the process.
- Check Rule 6: K out of K + 1 points > 1 standard deviation from center line (same side):Test 6 detects small shifts in the process.
- Check Rule 7: K points in a row within 1 standard deviation of center line (either side):Test 7 identifies patterns of variation that may be incorrectly interpreted as evidence of good control. This test detects overly wide control limits, which are often a result of stratified data. Stratified data occur when there is a systematic source of variation within each subgroup, causing the control limits to appear broader than they should be.
- Check Rule 8: K points in a row > 1 standard deviation from center line (either side):Test 8 detects a mixture pattern. In a mixture pattern, the points tend to fall away from the center line and instead fall near the control limits.