What is Create Factorial DoE?
Create Factorial DoE is the design generation step where you define your experiment before any data is collected. You specify the factors to be studied, the number of levels for each factor, and the structure of the design including resolution, blocks, replicates, and centre points. The tool then generates a complete set of experimental runs that tells you exactly which combination of factor settings to test and in what order.
Getting the design right at this stage is critical a well-constructed factorial design ensures that factor effects can be estimated accurately, that confounding is minimised, and that the experiment delivers the maximum amount of useful information for the resources invested.
Simple Definitions: The planning step of a factorial experiment where you define your factors, design structure, and run order before collecting any data. A well-designed experiment leads to clear, reliable answers.
When to use Create Factorial DoE ?
- Use when you need to plan a new factorial experiment from scratch before any runs have been performed.
- Use when you have 2 to 15 factors (continuous, categorical, or mixed) and want to study their individual effects and interactions.
- Use when you want to generate a randomised, structured run list that protects against time-based effects and operator bias.
- Use when resource or time constraints require a fractional factorial — testing a carefully chosen subset of all possible combinations.
Guidelines for correct usage of Create Factorial DoE
- Define realistic and practically achievable factor levels ranges should be wide enough to detect real effects but safe and feasible to operate at during the experiment.
- Always randomise the run order running experiments in a random sequence protects against systematic time-based effects, equipment warm-up trends, and operator learning biasing the results.
- Include centre points in every experiment they cost relatively few runs but provide valuable curvature detection and error estimation capability.
- Use blocks when a known nuisance variable exists such as testing across multiple days, shifts, machines, or raw material batches to prevent that variable from inflating the apparent factor effects.
- Choose resolution based on what information matters most use Resolution V when two-factor interactions are important; accept Resolution III only for large initial screening studies.
Alternatives: When not to use Create Factorial DoE
- If you have more than 15 factors to screen, use Create Definitive Screening Design first to narrow down important factors before investing in a full factorial.
- If all factors are ingredient proportions that must sum to a constant total, use Create Mixture DoE instead standard factorial designs cannot handle the mixture constraint.
- If the experiment has already been run and you have data to analyse, proceed directly to Analyse Factorial DoE without needing to create a new design.
What is Analyse Factorial DoE?
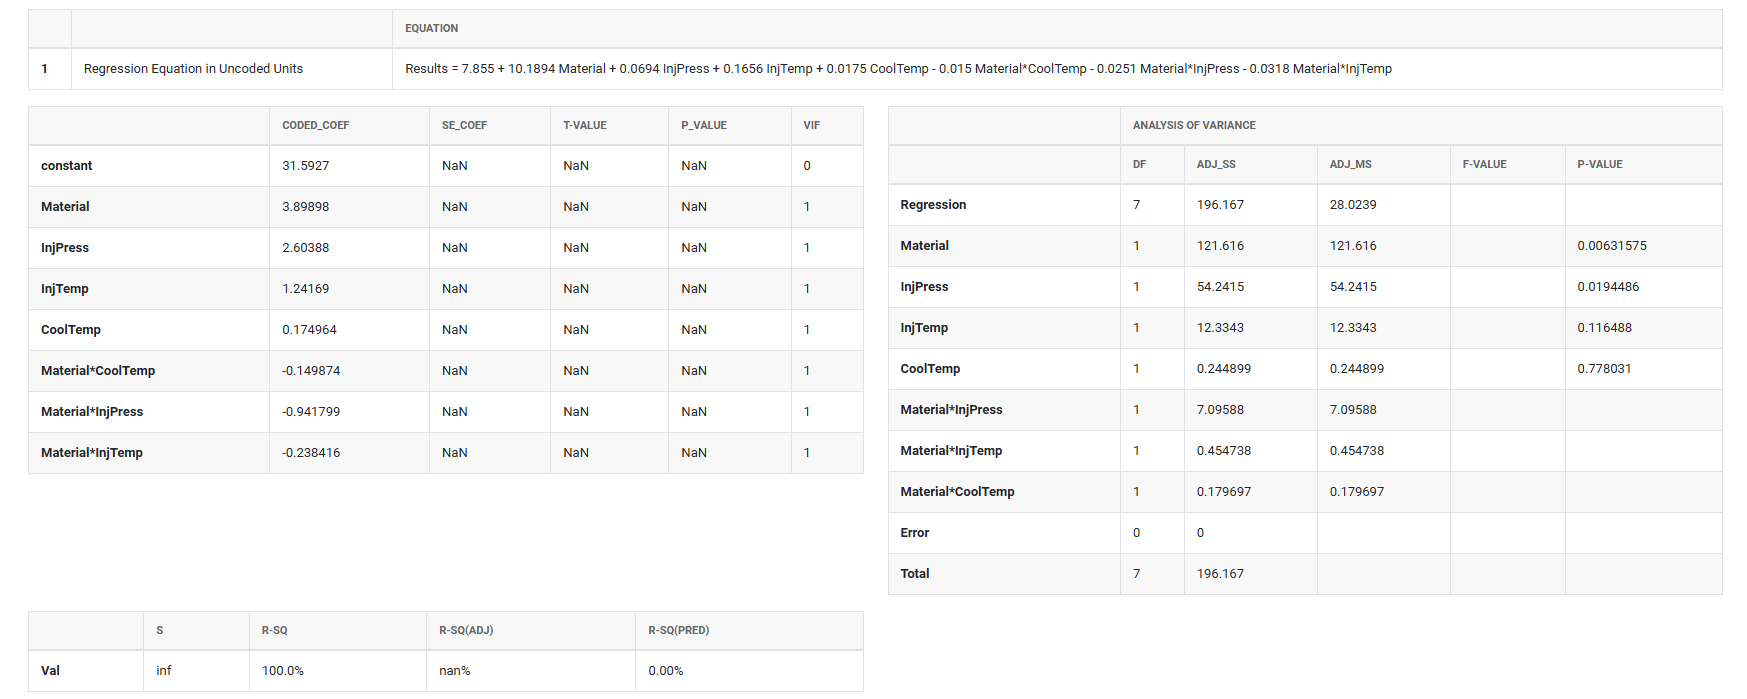
Analyse Factorial DoE processes the response data collected from a factorial experiment and fits a statistical model that quantifies how each factor and their interactions influence the response. It identifies which effects are statistically significant, estimates the magnitude and direction of each effect, and produces diagnostic plots and summary statistics to verify that the model is a reliable description of the data.
The analysis transforms raw experimental measurements into actionable knowledge telling you which factors truly drive the response, by how much, and whether any factors work together in ways that would not be apparent from studying them individually.
When to use Analyse Factorial DoE ?
- Use after completing all planned experimental runs and recording all response measurements.
- Use to identify which factors have statistically significant effects and which can be safely ignored in future process control.
- Use to quantify the magnitude and direction of each effect so you know not just what matters but how much adjusting it changes the response.
- Use to detect interactions between factors where the impact of one factor depends on the level of another.
Guidelines for correct usage of Analyse Factorial DoE
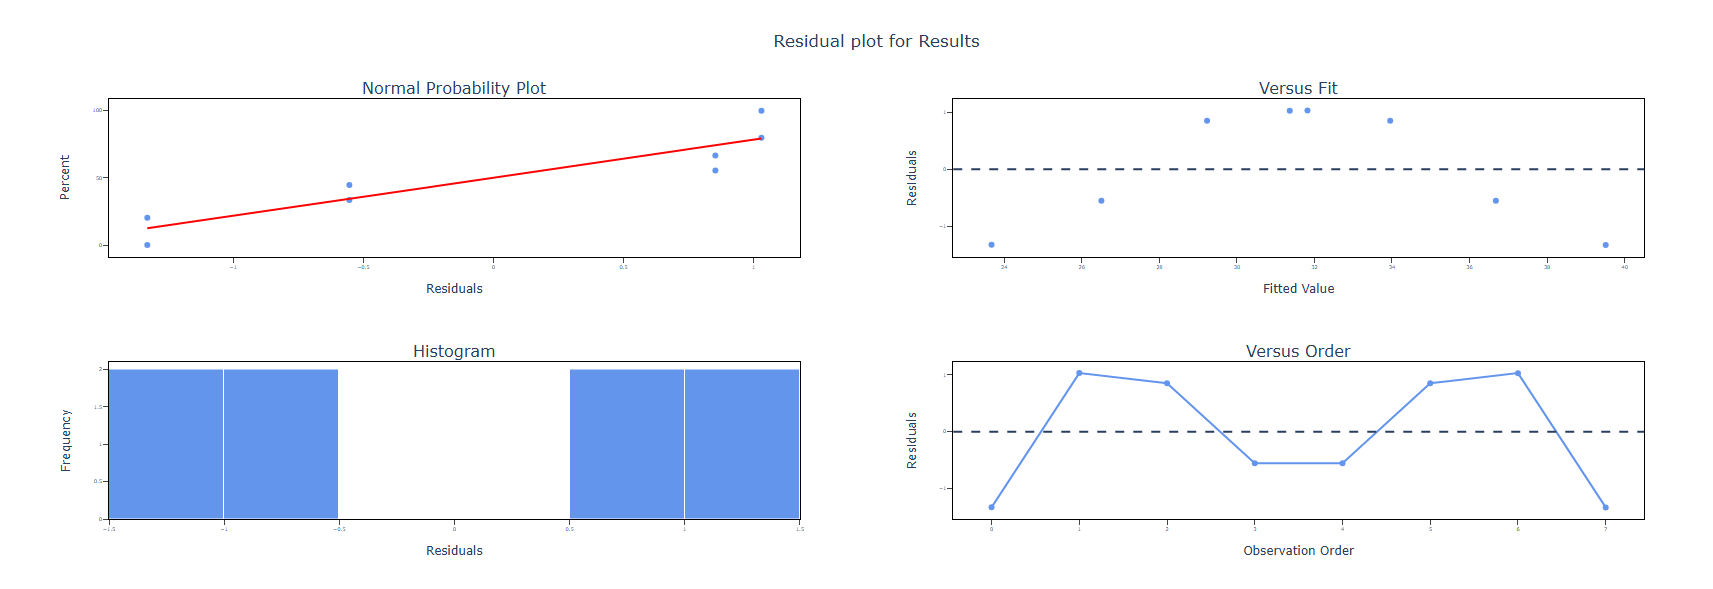
- Always review residual plots before interpreting effects a model that fails diagnostic checks should not be used to draw conclusions or make recommendations.
- Use hierarchical model building if an interaction term is significant, retain all main effects involved in that interaction even if those main effects are individually non-significant.
- Consider practical significance alongside statistical significance an effect can be statistically detectable but too small to matter practically for the process.
- Validate the final model with confirmation runs at the predicted optimal settings before implementing any process changes the model is a prediction, not a guarantee.
- If curvature is detected via centre points, consider augmenting the design with axial points to fit a response surface model that properly accounts for the curved relationship.
Alternatives: When not to use Analyse Factorial DoE
- If the experiment was created using a Definitive Screening Design, use Analyse Definitive Screening Design instead it uses an algorithm specifically optimised for DSD data structure.
- If the experiment was a mixture design, use Analyse Mixture DoE instead standard factorial analysis does not correctly handle the mixture constraint.
Example of Create & Analyse Factorial DoE
The following steps:
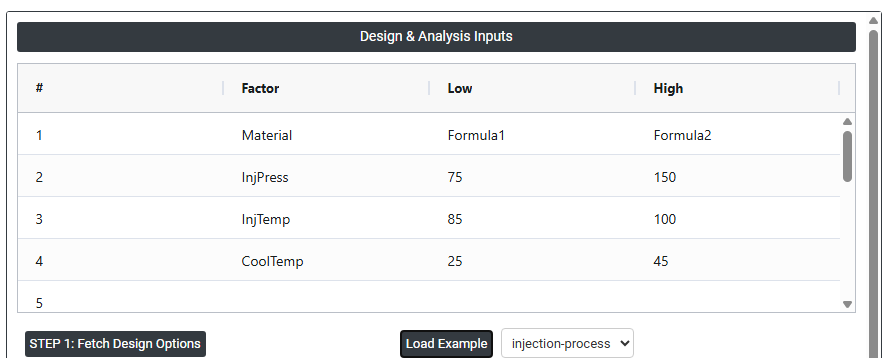
- Input the necessary data on right side panel Design & Analysis Inputs.
2. Now analyses the data with the help of https://qtools.zometric.com/ or https://intelliqs.zometric.com/.
3. To find Create & Analyse Factorial DoE choose https://intelliqs.zometric.com/> Statistical module> DOE>Create & Analyse Factorial DoE.
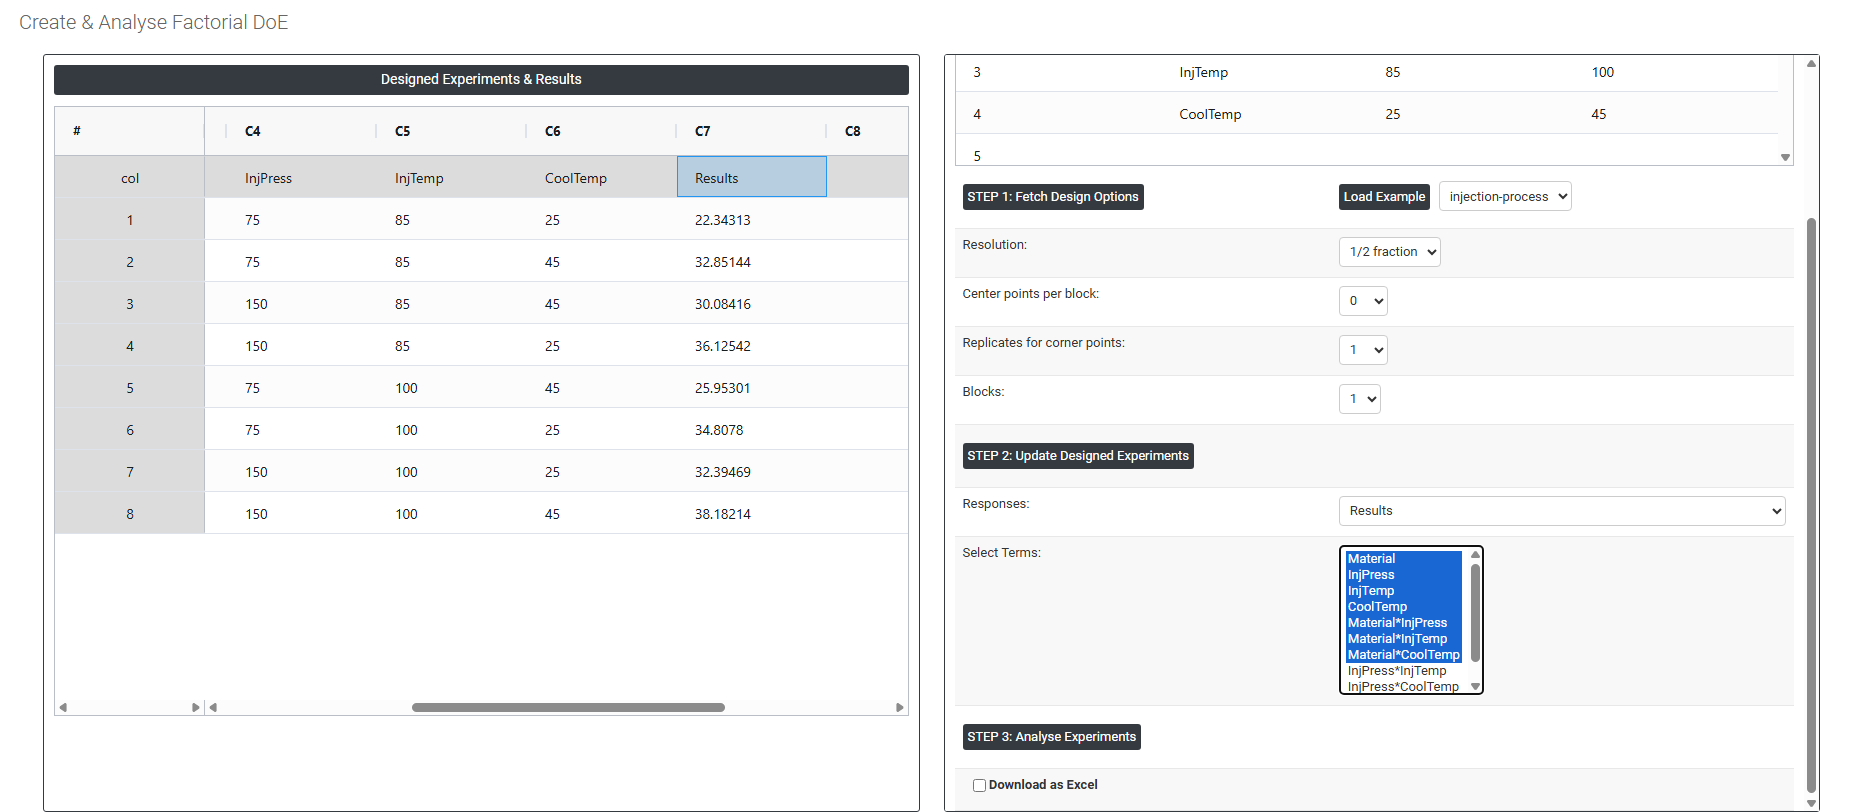
4. Click on Step 1. The required options will be populated with default settings.
5. Click on Step 2. In the left-side panel under Designed Experiments & Results, the design matrix will be generated. Add the response (outcome) variables as new columns at the end of the design matrix.
6. In the right-side panel under Design & Analysis Inputs, locate the Responses option. Select the newly added outcome variable columns to define them as response variables.
7. Select the required interaction terms based on the experimental requirements
8. Click on Step 3 to perform the analysis of the designed experiment.
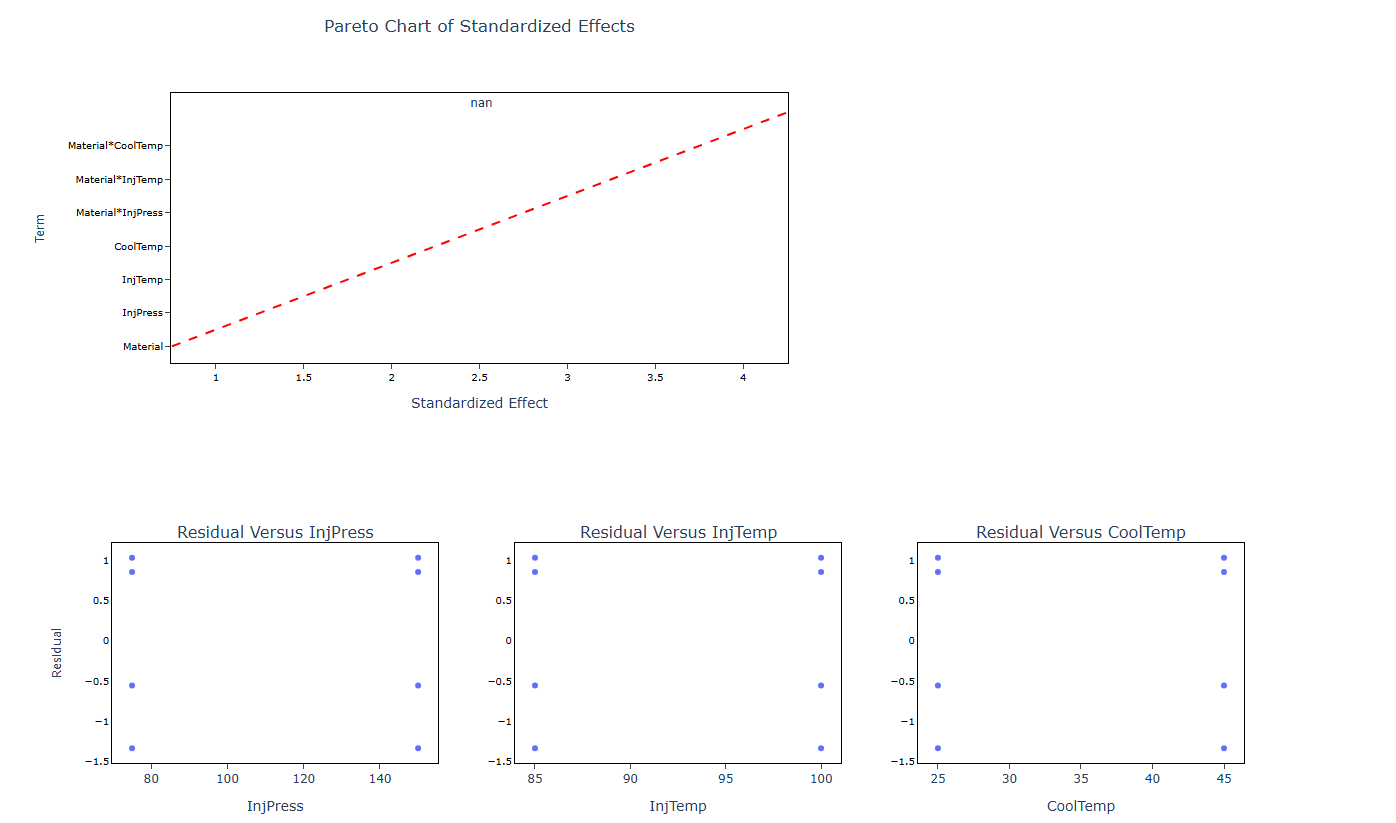
9. After using the above mentioned tool, fetches the output as follows:
How to do Create & Analyse Factorial DoE
The guide is as follows:
- Login in to QTools account with the help of https://qtools.zometric.com/ or https://intelliqs.zometric.com/
- On the home page, choose Statistical Tool> DOE>Create & Analyse Factorial DoE.
- Next, update the data manually or can completely copy (Ctrl+C) the data from excel sheet or paste (Ctrl+V) it or else there is say option Load Example where the example data will be loaded.
- Next, you need to fill the required options.
- Finally, click on calculate at the bottom of the page and you will get desired results.
On the dashboard of Create & Analyse Factorial DoE, the window is separated into two parts.
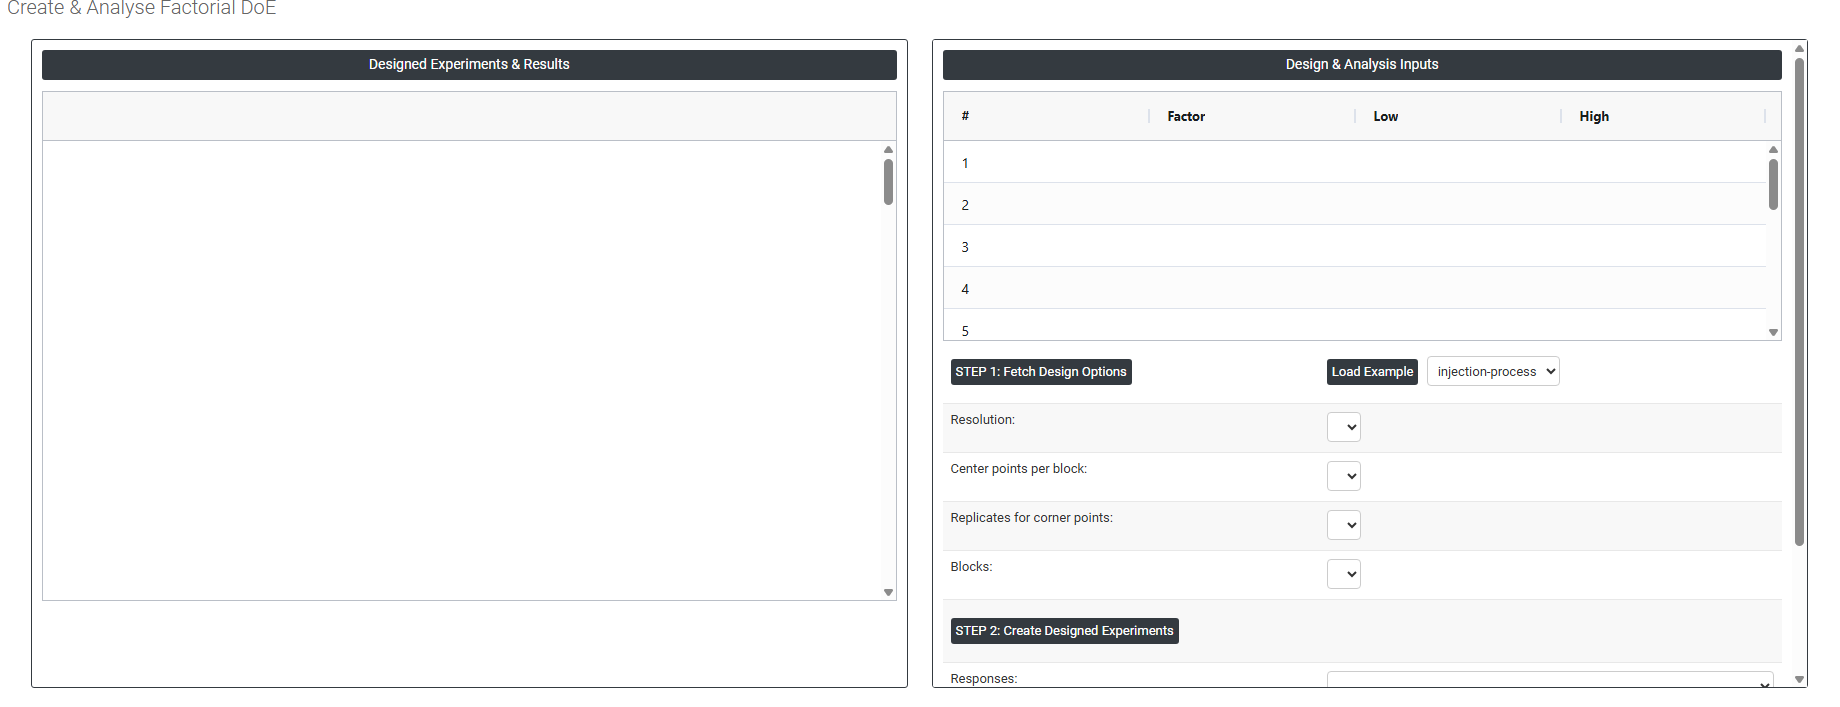
On the left part, Designed Experiments & Results is present. In the Designed Experiments & Results, it generates the design experiment.
On the right part, there are many options present as follows:
Load example: Loads a pre-built example dataset so you can explore the tool and understand the workflow before entering your own data.
-
Step 1: Fetch Design Options : This will automatically fill these above explained option
- Resolution: Defines how much information the fractional factorial design can estimate without confounding. Higher resolution designs separate main effects and interactions more cleanly but require more runs:
1. Full Factorial Design (Full Fraction)
A full factorial design is an experimental design in which all possible combinations of factor levels are tested.
- If there are k factors, each at 2 levels, the total number of runs is:
2ᵏ
Key Characteristics
- Evaluates every possible interaction between factors.
- Provides complete and unconfounded information.
- No loss of information due to aliasing.
Advantages
- Highest level of accuracy.
- All main effects and interaction effects can be estimated independently.
- No ambiguity in interpretation.
Disadvantages
- Number of runs increases rapidly as the number of factors increases.
- Can be time-consuming and costly.
Example
For 3 factors (A, B, C), each at 2 levels:
Total runs = 2³ = 8 runs2. Fractional Factorial Design (Half Fraction – 1/2 Fraction)
A half-fraction design (1/2 fraction) is a type of fractional factorial design where only half of the total runs of a full factorial design are conducted.
- For k factors, number of runs becomes:
2ᵏ⁻¹
Key Characteristics
- Reduces the number of experimental runs by 50%.
- Uses a subset of combinations selected systematically.
- Some effects are confounded (aliased) with others.
Advantages
- Requires fewer experiments, saving time and cost.
- Useful in early stages of experimentation (screening important factors).
Disadvantages
- Some effects cannot be separated (due to aliasing).
- Interpretation may be less clear compared to full factorial designs.
Example
For 3 factors (A, B, C):
Full factorial = 8 runs
Half fraction = 2³⁻¹ = 4 runs - If there are k factors, each at 2 levels, the total number of runs is:
-
Centre Points per Block: The number of runs at the midpoint of all factor ranges added within each block. Centre points help detect curvature in the response and provide an independent estimate of experimental error without requiring additional factor combinations.
- Replicates for Corner Points: The number of times each corner point (extreme factor combination) is repeated. Adding replicates increases the precision of effect estimates and provides a more reliable error estimate but increases the total number of runs required.
- Blocks: Divides the experiment into groups of runs performed under the same conditions for example, by day, operator, or equipment. Blocking removes known sources of variation from the analysis, giving cleaner estimates of factor effects.
Step 2: Create Designed Experiments: It generates the design experiments on the left side panel (Designed Experiments & Results)
- Responses: Add the response variables (output measurements) that will be collected during the experiment. These should be entered as new columns immediately after the last column of the design matrix in the worksheet. Once the response columns are added, select them using the Responses option of newly added column which is the output variable. This ensures that the experimental results are correctly associated with the defined responses for further analysis.
- Select Terms: Choose which model terms main effects, two-factor interactions, quadratic effects to include in the analysis model. By default, the main effects are included; add interaction terms if you expect factors to influence each other.
Step 3: Analyse Experiments
-
This will generate the Analysis of the design which you have generated.
- Resolution: Defines how much information the fractional factorial design can estimate without confounding. Higher resolution designs separate main effects and interactions more cleanly but require more runs:
- Download as Excel: This will display the result in an Excel format, which can be easily edited and reloaded for calculations using the load file option.