What is Create Gage R&R Study Worksheet?
Create Gage R&R Study Worksheet is a setup tool that generates a structured, randomised data collection worksheet specifically designed for conducting a Gauge Repeatability and Reproducibility (Gage R&R) study. It organises the measurement plan — specifying which operator should measure which part, in what order — so that the study is conducted correctly and the resulting data can be properly analysed.
Gage R&R studies evaluate the reliability of a measurement system by separating repeatability (variation from the measurement device itself — same operator, same part, repeated measurements) from reproducibility (variation caused by different operators measuring the same part). The worksheet ensures that data is collected in a way that makes both components calculable.
Simple Definitions: A tool that creates a ready-to-use, randomised measurement plan for a Gage R&R study — telling each operator which parts to measure and in what order, so the study is conducted correctly from the start.
When to use Create Gage R&R Study Worksheet?
- Use when planning a crossed Gage R&R study where every operator will measure every part — the most common and widely used Gage R&R design.
- Use before validating a new measurement instrument or gauge to confirm it is capable of measuring your parts reliably.
- Use when introducing new operators to a measurement process to verify they can achieve consistent results.
- Use as part of a process validation or qualification study where evidence of measurement system capability is required.
Guidelines for correct usage of Create Gage R&R Study Worksheet
- Select a representative sample of parts that spans the full range of expected process variation — at least 10 parts is the standard recommendation.
- Use at least 2 operators and 2 replicates; 3 operators and 3 replicates is the preferred standard for more reliable results.
- Ensure the worksheet is followed in the randomised order it generates — deviating from the random order introduces bias into the study.
- Operators should measure parts blindly — they should not know the previous measurement or the measurement of another operator for the same part.
- After data collection, analyse using Gage R&R (Crossed) to obtain repeatability, reproducibility, and %Study Variation statistics.
Alternatives: When not to use Create Gage R&R Study Worksheet
- If the characteristic being measured is attribute-based (pass/fail, good/bad), use Create Attribute Agreement Worksheet
Example of Create Gage R&R Study Worksheet
This is following steps to Generate the Create Gage R and R study worksheet:
- To Generate the Gage R and R sheet .
- Now analyses the data with the help of https://qtools.zometric.com/ or https://intelliqs.zometric.com/.
- To find Create Gage R&R Study Worksheet choose https://intelliqs.zometric.com/> Statistical module> Measurement System Analysis> Create Gage R&R Study Worksheet.
- After using the above mentioned tool, fetches the output as follows:

How to do Create Gage R&R Study Worksheet
The guide is as follows:
- Login in to your Zometric Q-Tools account at: https://qtools.zometric.com/ or https://intelliqs.zometric.com/
- On the home page, choose Statistical Tool> Measurement System Analysis >Create Gage R&R Study Worksheet.
- Fill the required options.
- Finally, click on calculate at the bottom of the page and you will get desired results.
On the dashboard of Create Gage R&R Study Worksheet, the window is separated into two parts.
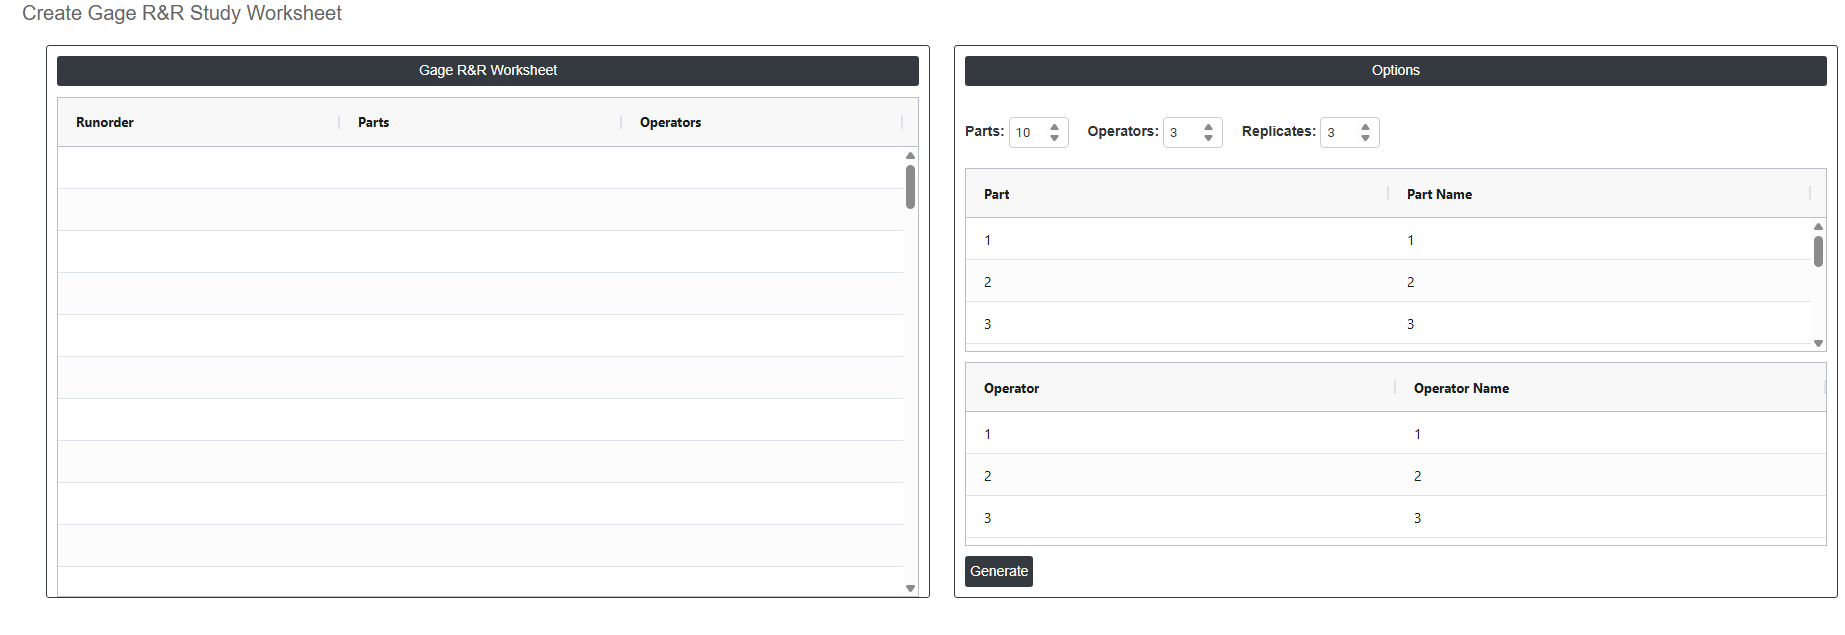
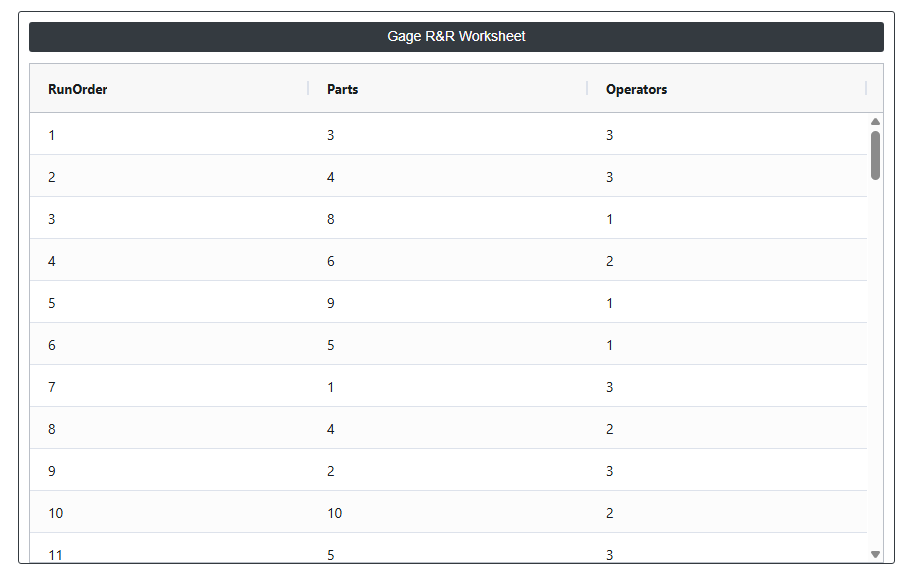
On the left part, Gage R & R Worksheet is present. In the Gage R & R Worksheet, by Clicking Generate button whichis on the right side creates the completed Gage R&R study worksheet based on all the settings entered above. The generated worksheet lists every measurement assignment in a randomised order specifying which operator should measure which part for each replicate. This randomised sequence must be followed exactly during data collection to ensure the study results are unbiased and valid.
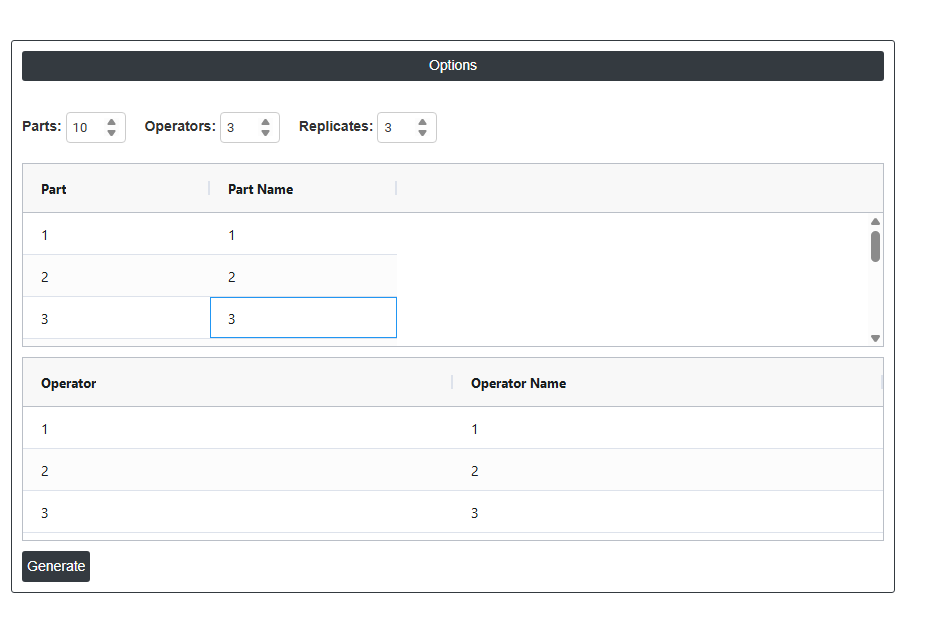
On the right part, there are many options present as follows:
- Parts: Sets the total number of parts to be included in the study. The default is 10, which is the industry-recommended minimum for a reliable Gage R&R study. Parts should be selected from actual production and must represent the full range of process variation from the lowest to highest expected values. Using too few parts reduces the reliability of the variance estimates produced by the study.
- Operators: Sets the number of operators who will participate in the measurement study. The default is 3, which is the standard recommended number. Each operator will measure every part the number of times defined by the Replicates setting. Operators should be chosen from those who regularly perform the measurement in normal production — the study results will only reflect the capability of the operators included.
- Replicates: Sets how many times each operator will measure each part. The default is 3, meaning every operator measures every part three times in a randomised order. More replicates improve the precision of the repeatability estimate but increase the total number of measurements required. The minimum acceptable value is 2; 3 is the recommended standard for most studies.
- Part / Part Name Table: Displays a row for each part included in the study. The Part column shows the part number (automatically assigned as 1, 2, 3, and so on). The Part Name column is editable — you can replace the default numbers with meaningful identifiers such as serial numbers, batch codes, or sample labels. Using descriptive part names makes the completed worksheet and analysis output easier to trace and interpret.
- Operator / Operator Name Table: Displays a row for each operator included in the study. The Operator column shows the operator number (automatically assigned). The Operator Name column is editable — replace the default numbers with the actual names or IDs of the operators participating in the study. Using real names ensures the worksheet is unambiguous and that the analysis output can be directly linked back to specific individuals.