What is Create variable acceptance sampling ?
Create Variable Acceptance Sampling generates a customised acceptance sampling plan for continuous measurement data based on your specific quality requirements including the Acceptable Quality Level (AQL), Rejectable Quality Level (RQL), and the producer and consumer risk levels. Unlike table-based plans, this tool calculates the exact sample size and acceptance criterion tailored precisely to your requirements.
Simple Definitions: A tool that builds a bespoke variable sampling plan precisely matched to your defined quality targets and risk tolerances rather than picking from a fixed standard table.
When to use Create variable acceptance sampling?
- Use when standard AQL table plans do not precisely match your specific producer and consumer risk requirements.
- Use when you need to justify or document the statistical basis of a sampling plan for a customer or regulatory authority.
- Use when continuous measurement data is available and approximately normally distributed.
Guidelines for correct usage of Create variable acceptance sampling
- Clearly define AQL and RQL before creating the plan these directly determine sample size and acceptance criteria.
- Set alpha (α) and beta (β) risk levels explicitly alpha is producer's risk (typically 0.05) and beta is consumer's risk (typically 0.10).
- Verify normality of data before applying the plan statistical guarantees depend on this assumption.
Alternatives: When not to use Create variable acceptance sampling
- If data is attribute-based, use Attribute AQL Sampling Plans
- If you want a standardised internationally recognised plan, use Variable AQL Sampling Plans (ISO 3951 / ANSI Z1.9)
Example of Create variable acceptance sampling
The following steps for Create variable acceptance sampling:
- Fill the required options.
2. Now analyses the data with the help of https://qtools.zometric.com/ or https://intelliqs.zometric.com/.
3. To find Create variable acceptance sampling choose https://intelliqs.zometric.com/> Statistical module> Sampling >Create variable acceptance sampling.
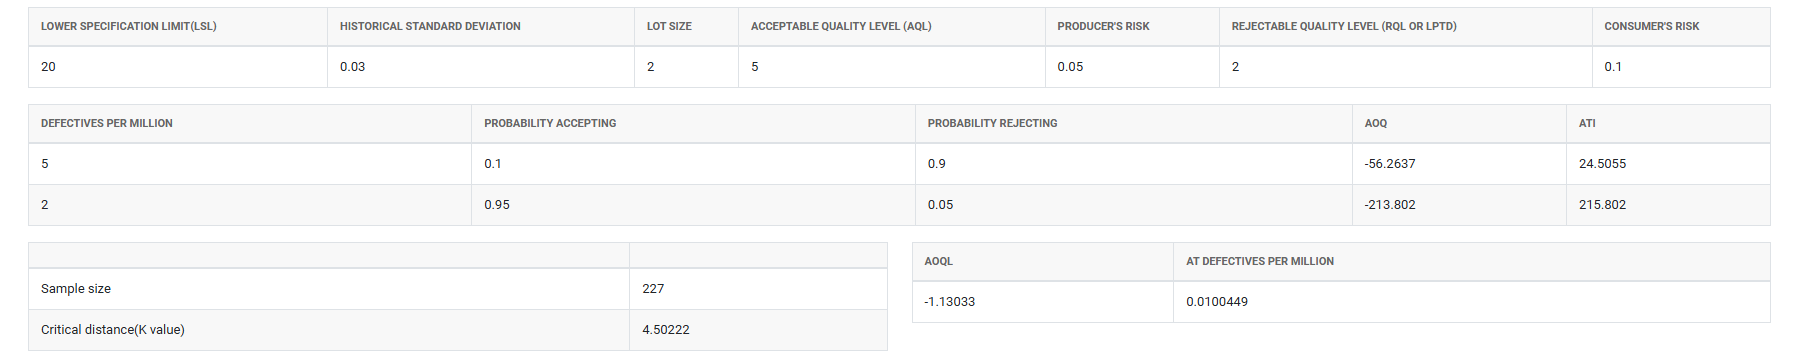
4. After using the above mentioned tool, fetches the output as follows:
How to do Create variable acceptance sampling
The guide is as follows:
- Login in to QTools account with the help of https://qtools.zometric.com/ or https://intelliqs.zometric.com/
- On the home page, choose Statistical Tool> Sampling>Create variable acceptance sampling.
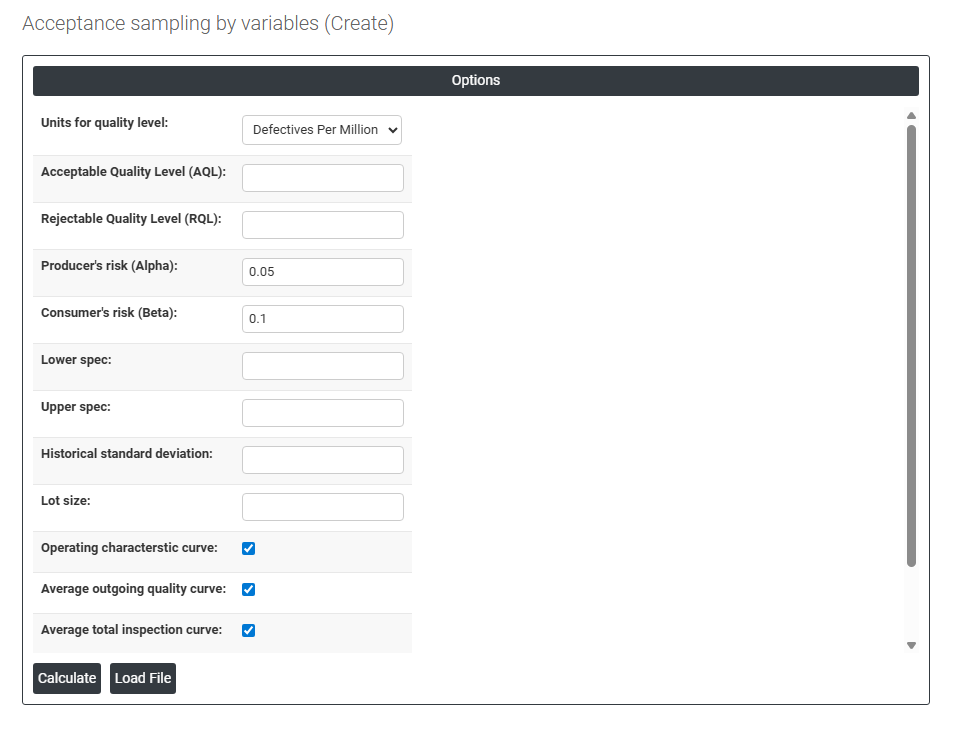
- Next, you need to fill the required options.
- Finally, click on calculate at the bottom of the page and you will get desired results.
On the dashboard of Create variable acceptance sampling, the window is separated into two parts.
Load example: Sample data will be loaded.
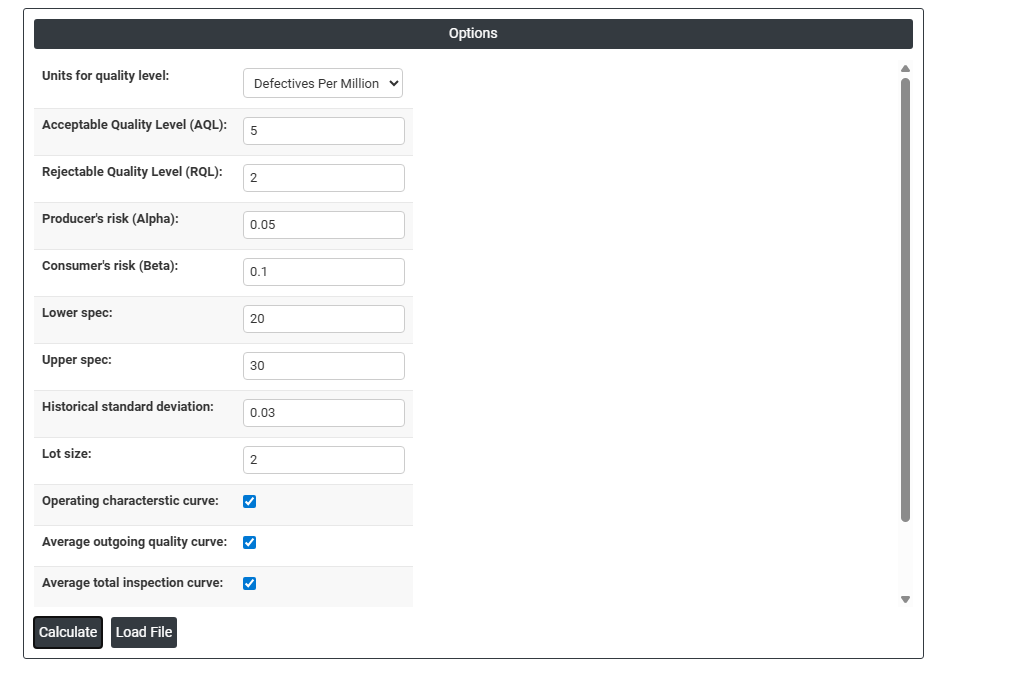
On the right part, there are many options present as follows:
- Units for Quality Level: Defines how non-conformance is expressed in the plan. Defectives Per Million (DPM) expresses quality as parts per million defective suitable for high-precision processes with very low defect rates.
- Acceptable Quality Level (AQL): The quality level at which the plan should have a high probability of accepting the lot representing acceptable producer quality. Lots at this quality level should be accepted most of the time.
- Rejectable Quality Level (RQL): The quality level at which the plan should have a high probability of rejecting the lot representing unacceptably poor quality from the consumer's perspective. Also known as LTPD (Lot Tolerance Percent Defective).
- Producer's Risk (Alpha): The probability of rejecting a lot that is actually at AQL quality a false rejection that penalises the producer. The standard default is 0.05 (5%), meaning 5% of acceptable lots will be incorrectly rejected.
- Consumer's Risk (Beta): The probability of accepting a lot that is actually at RQL quality a false acceptance that passes poor quality to the consumer. The standard default is 0.10 (10%), meaning 10% of unacceptable lots will be incorrectly accepted.
- Lower Spec / Upper Spec: The specification limits for the quality characteristic being measured. These define what constitutes a non-conforming item and are used to calculate the proportion defective at any given process mean and standard deviation.
- Historical Standard Deviation: If the process standard deviation is known from historical data or a validated process study, enter it here. When provided, a simpler known-sigma plan is used, which typically requires a smaller sample size than plans that estimate standard deviation from the sample.
- Lot Size: The total number of items in each batch. Used to calculate the average outgoing quality and average total inspection curves.
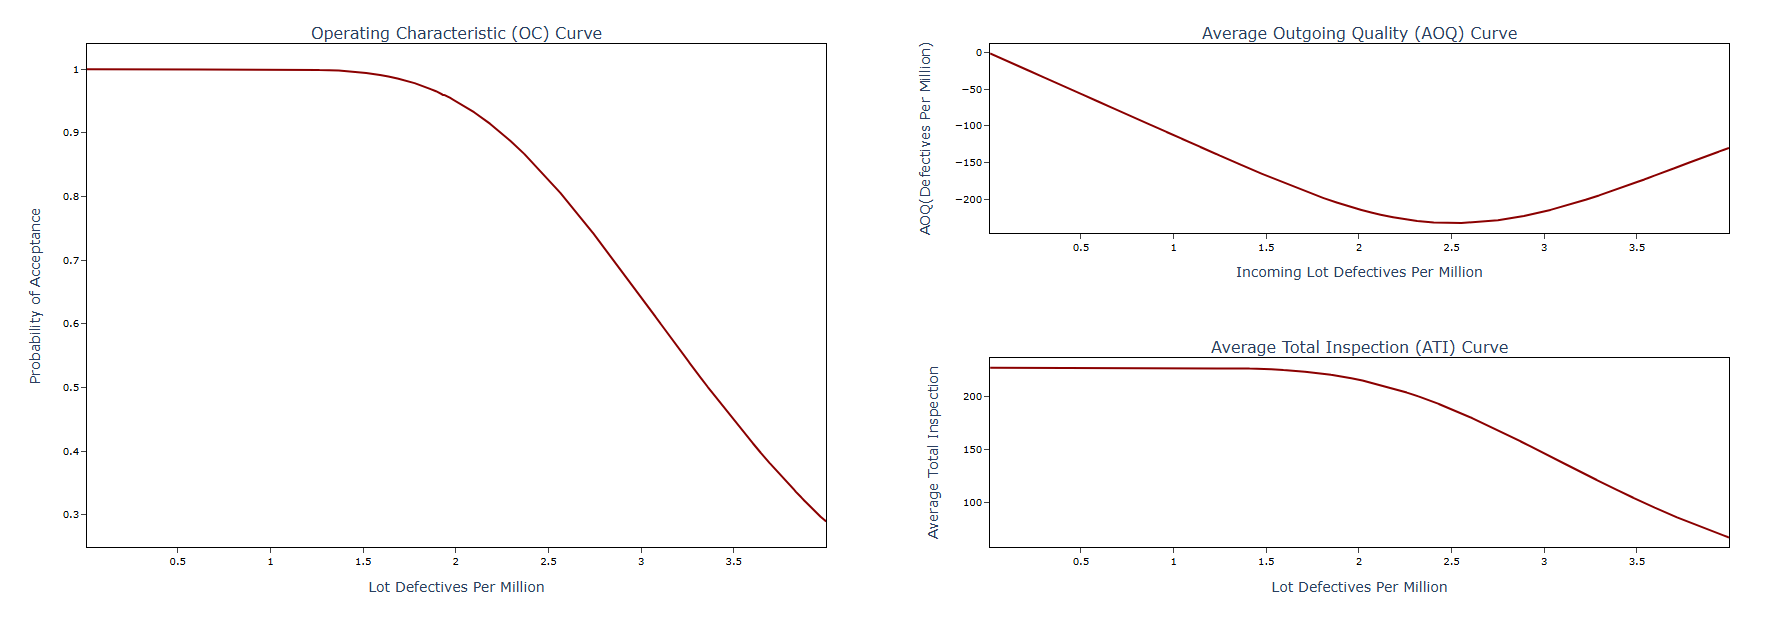
- Operating Characteristic (OC) Curve: When checked, displays the probability of lot acceptance plotted against actual lot quality showing how the plan performs across the full range of possible incoming quality levels.
- Average Outgoing Quality (AOQ) Curve: When checked, displays the average quality of lots leaving the inspection process after rejected lots are 100% inspected and defectives replaced showing the worst-case outgoing quality level (AOQL).
- Average Total Inspection (ATI) Curve: When checked, displays the average number of items inspected per lot across all quality levels combining sampled items from accepted lots with 100% inspected items from rejected lots.
- Plot on One Page: When checked, displays all selected curves together on a single page for easy comparison.
- Download as Excel: This will display the result in an Excel format, which can be easily edited and reloaded for calculations using the load file option.