What is Fried Man?
The Friedman Test is a nonparametric test used to compare three or more related groups or treatment conditions. It is the nonparametric equivalent of repeated-measures ANOVA used when the same subjects, blocks, or experimental units are measured under multiple conditions and the data does not meet normality requirements. The test ranks values within each block and compares rank totals across treatment groups.
Simple Definitions: A test that compares multiple related treatments applied to the same subjects or blocks the nonparametric version of repeated-measures ANOVA.
When to use Fried Man?
- Use when comparing three or more related or matched conditions — repeated measurements on the same subjects under different treatments.
- Use when data is not normally distributed and groups are linked by a blocking variable.
- Use as a nonparametric alternative to repeated-measures ANOVA.
- Use in sensory evaluation, clinical trials, or quality studies where the same items or people are assessed under multiple conditions.
Guidelines for correct usage of Fried Man
- Organise data in a two-way structure rows as blocks (subjects/batches), columns as treatment conditions.
- Each block must receive all treatment conditions missing treatments within a block invalidate the test.
- A significant result only shows at least one treatment differs follow up with Wilcoxon pairwise comparisons to identify which.
- Collect at least 5 blocks for reliable rank-based comparisons.
Alternatives: When not to use Fried Man
- If data is normally distributed, use Repeated-Measures ANOVA
- If groups are completely independent with no blocking, use Kruskal-Wallis Test
- If comparing only two related conditions, use One-Sample Wilcoxon Test on the paired differences instead.
Example of Fried Man
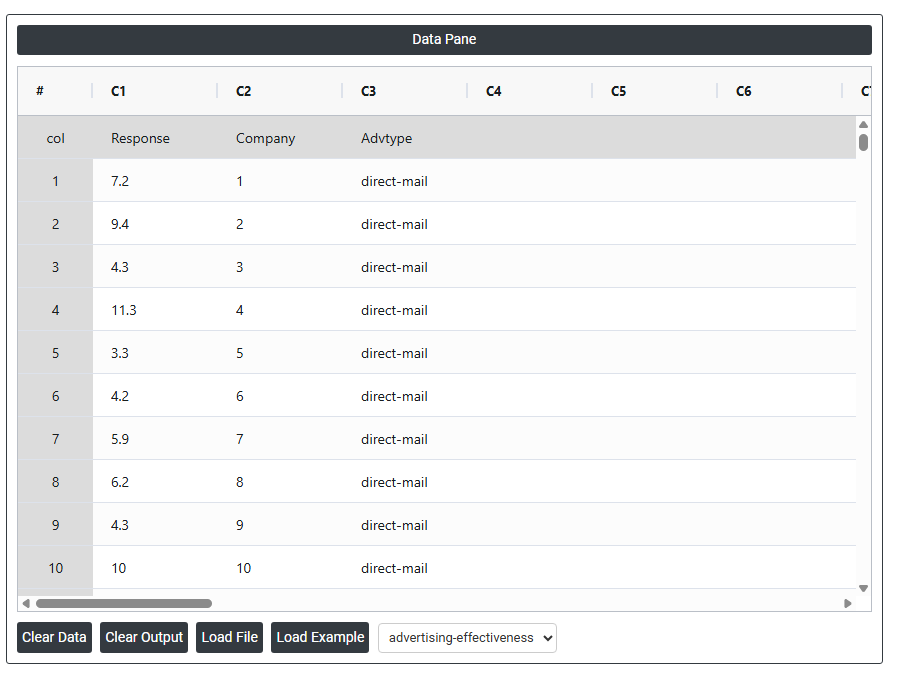
A marketing analyst wants to determine whether the type of advertising affects client response rates. For 12 clients, the analyst recorded the percentage response after using direct mail, newspaper, and magazine advertising over a 1-year period. Thus, each client provides a set of three related observations. The following steps:
- Gathered the necessary data.
- Now analyses the data with the help of https://qtools.zometric.com/ or https://intelliqs.zometric.com/.
- To find Fried Man choose https://intelliqs.zometric.com/> Statistical module> Nonparametric > Fried Man.
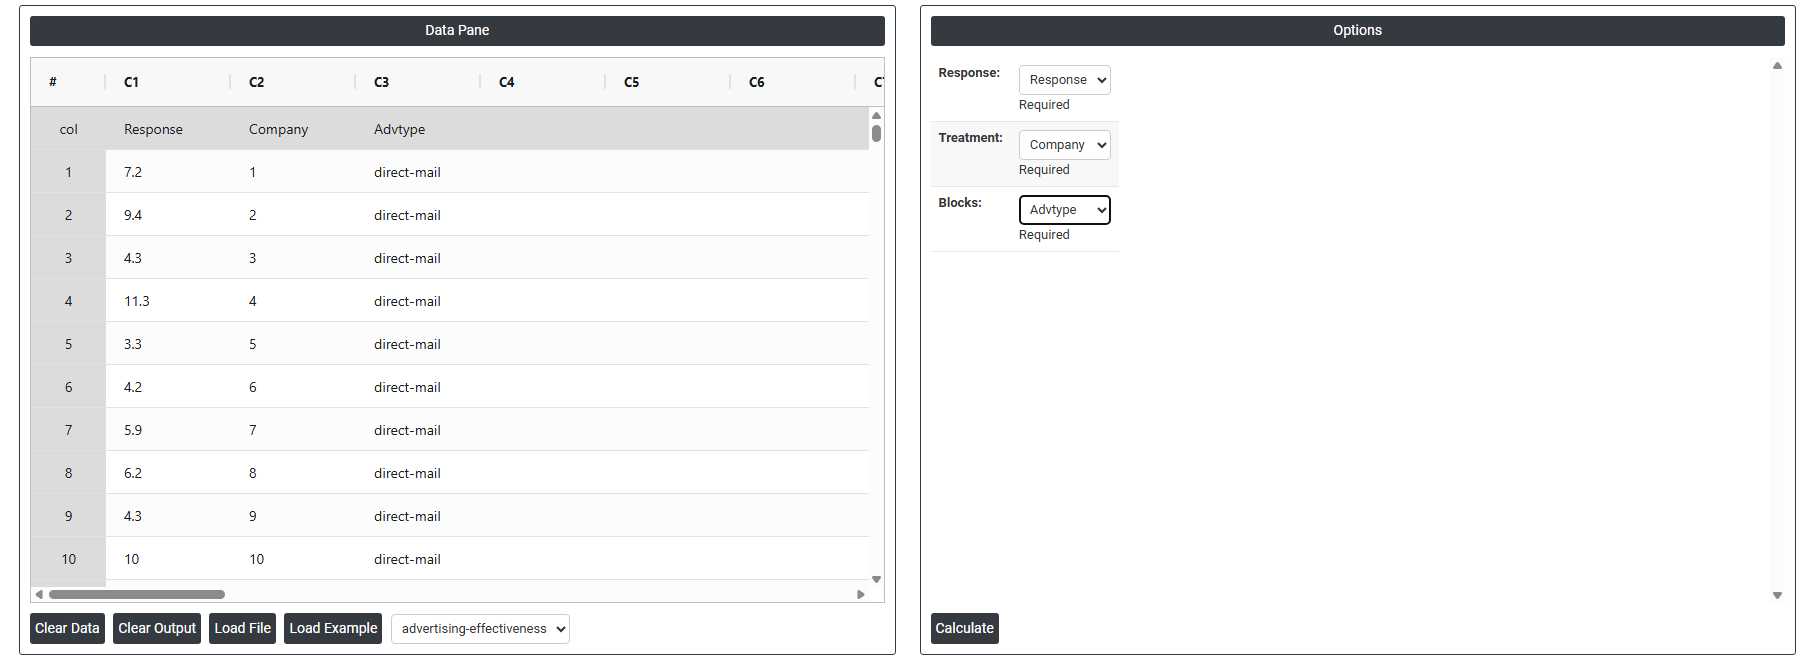
- Inside the tool, feeds the data along with other inputs as follows:
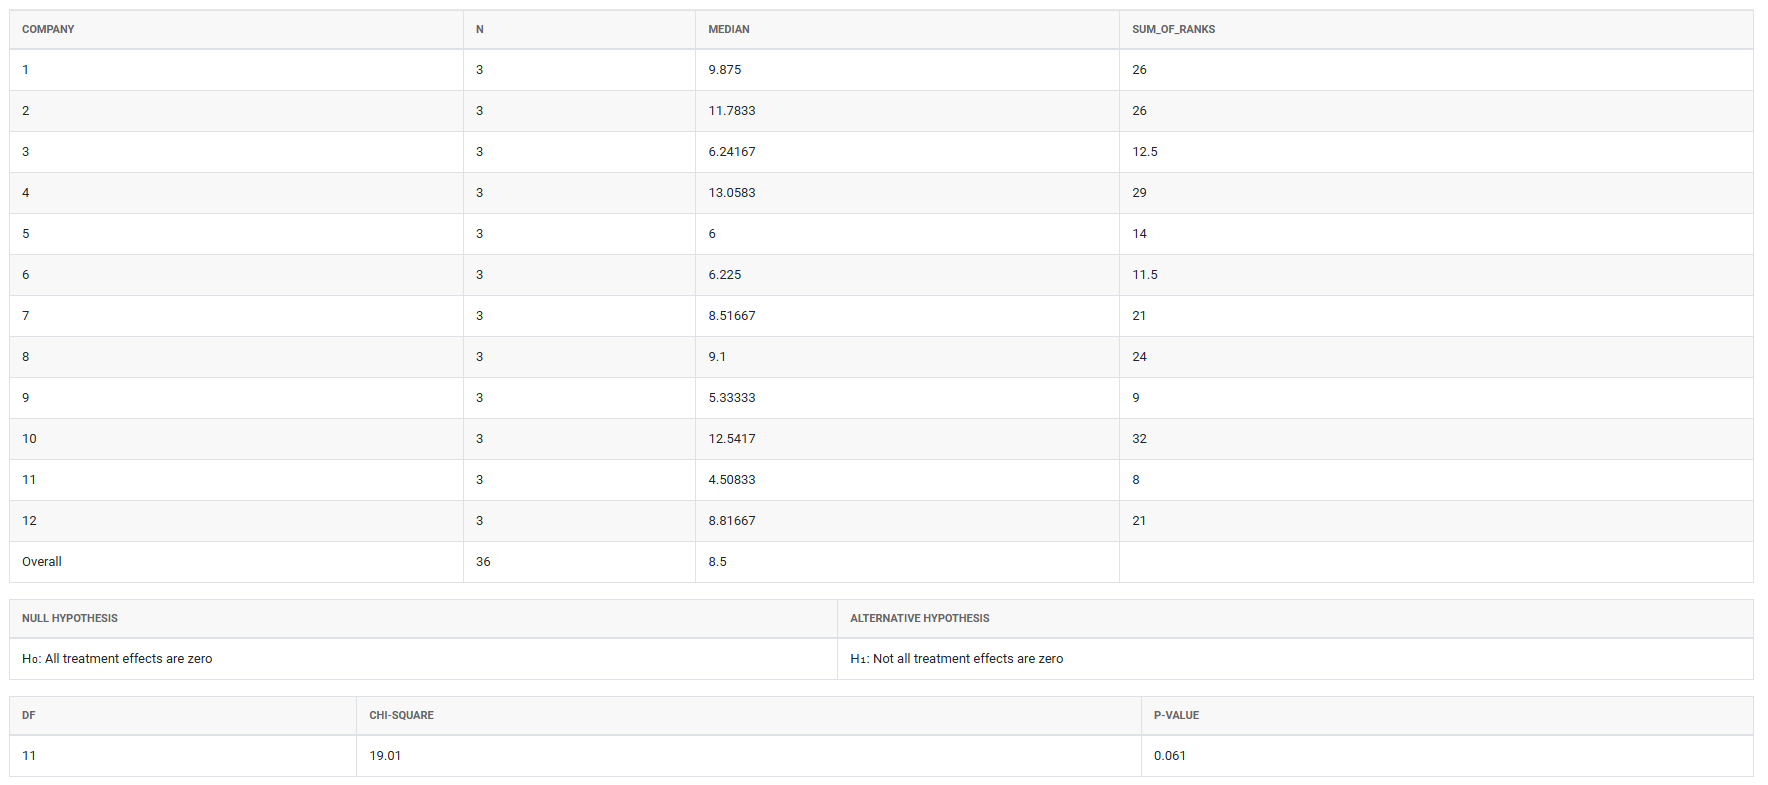
5. After using the above mentioned tool, fetches the output as follows:
How to do Fried Man
The guide is as follows:
- Login in to QTools account with the help of https://qtools.zometric.com/ or https://intelliqs.zometric.com/
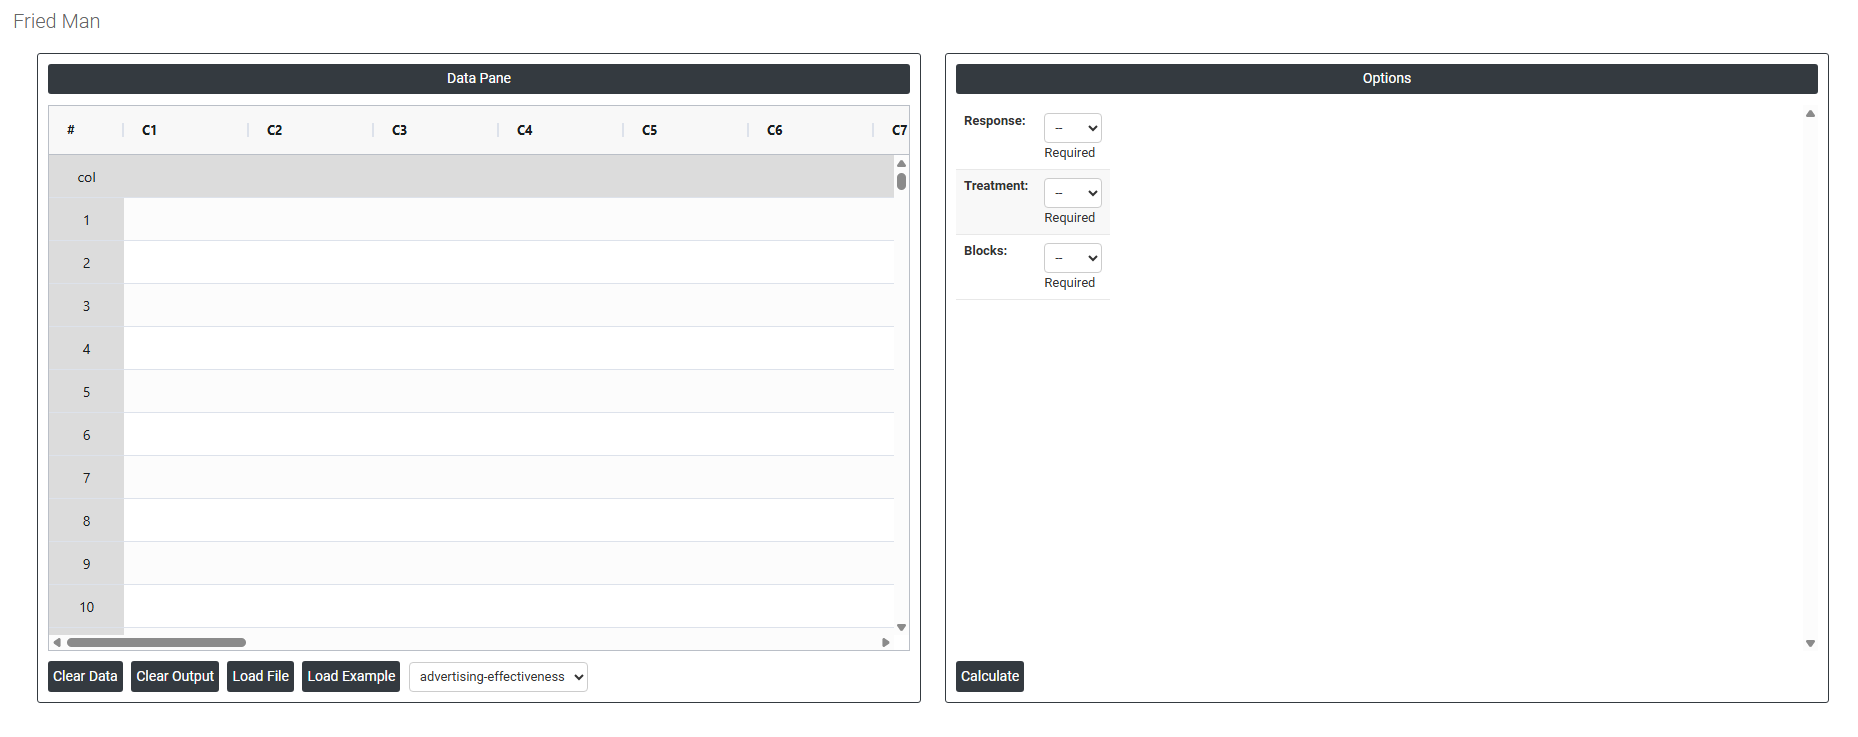
- On the home page, choose Statistical Tool> Nonparametric>Fried Man.
- Next, update the data manually or can completely copy (Ctrl+C) the data from excel sheet and paste (Ctrl+V) it here.
- Next, you need to fill the required options.
- Finally, click on calculate at the bottom of the page and you will get desired results.
On the dashboard of Fried Man, the window is separated into two parts.
On the left part, Data Pane is present. In the Data Pane, each row makes one subgroup. Data can be fed manually or the one can completely copy (Ctrl+C) the data from excel sheet and paste (Ctrl+V) it here.
Load example: Sample data will be loaded.
Load File: It is used to directly load the excel data.
On the right part, there are many options present as follows:
- Response: Select the column containing the measured outcome or result you want to compare across treatments. This is the variable being tested for example, a quality rating, a measurement value, or a performance score. Each value in this column represents one observation recorded under a specific treatment and within a specific block.
- Treatment: Select the column that identifies which treatment condition or group each observation belongs to. A treatment represents the different conditions, methods, processes, or time points being compared for example, three different machines, four different operators, or five different formulations. The Friedman test evaluates whether these treatments produce significantly different response values after accounting for block effects.
- Blocks: Select the column that identifies which block each observation belongs to. A block is a grouping variable that represents a source of natural variation that is not of direct interest such as the subject, batch, day, or experimental unit. Each block receives all treatment conditions, allowing the test to remove block-to-block variation from the analysis and focus purely on the differences between treatments. Without proper blocking, genuine treatment differences can be hidden by unrelated variation between subjects or batches.