What is Generate Random Binomial Data?
Random Binomial Data generates values based on the binomial distribution describing the number of successes in a fixed number of independent trials where each trial has exactly two outcomes (success or failure). You specify the number of trials (n) and the probability of success per trial (p).
Simple Definitions: Generates random counts of successes from a fixed number of trials — ideal for simulating pass/fail, defective/non-defective, or yes/no attribute data.
When to use Generate Random Binomial Data?
- Use to simulate attribute data number of defective items in a batch, customer purchase counts, or test failure counts.
- Use for testing P charts, NP charts, or binary logistic regression with known input parameters.
- Use in risk and reliability simulations where outcomes are binary.
Guidelines for correct usage of Generate Random Binomial Data
- Set n (number of trials) to match your inspection lot size.
- Set p (probability) between 0 and 1 , e.g. 0.05 means a 5% defect rate per trial.
- Use a fixed seed for reproducible simulations.
Alternatives: When not to use Generate Random Binomial Data
- For defect count data per unit area or time, use Random Poisson Data
- For continuous measurements, use Random Normal or Lognormal Data
Example of Generate Random Binomial Data
The following steps to Generate Random Binomial Data:
- To Generate Random Binomial Data need to fill the required options.
- Now analyses the data with the help of https://qtools.zometric.com/ or https://intelliqs.zometric.com/.
- To find Generate Random Binomial Data choose https://intelliqs.zometric.com/> Statistical module> Random Data > Generate Random Binomial Data
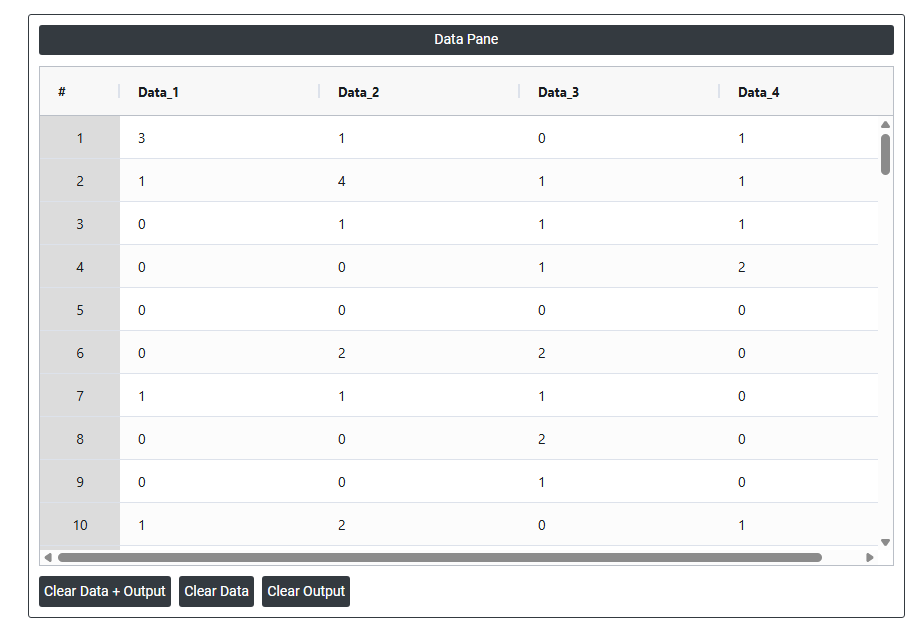
4. After using the above mentioned tool, fetches the output as follows:
How to do Generate Random Binomial Data
The guide is as follows:
- Login in to QTools account with the help of https://qtools.zometric.com/ or https://intelliqs.zometric.com/
- On the home page, choose Statistical Tool> Random Data>Generate Random Binomial Data.
- Next, you need to fill the required options.
- Finally, click on calculate at the bottom of the page and you will get desired results.
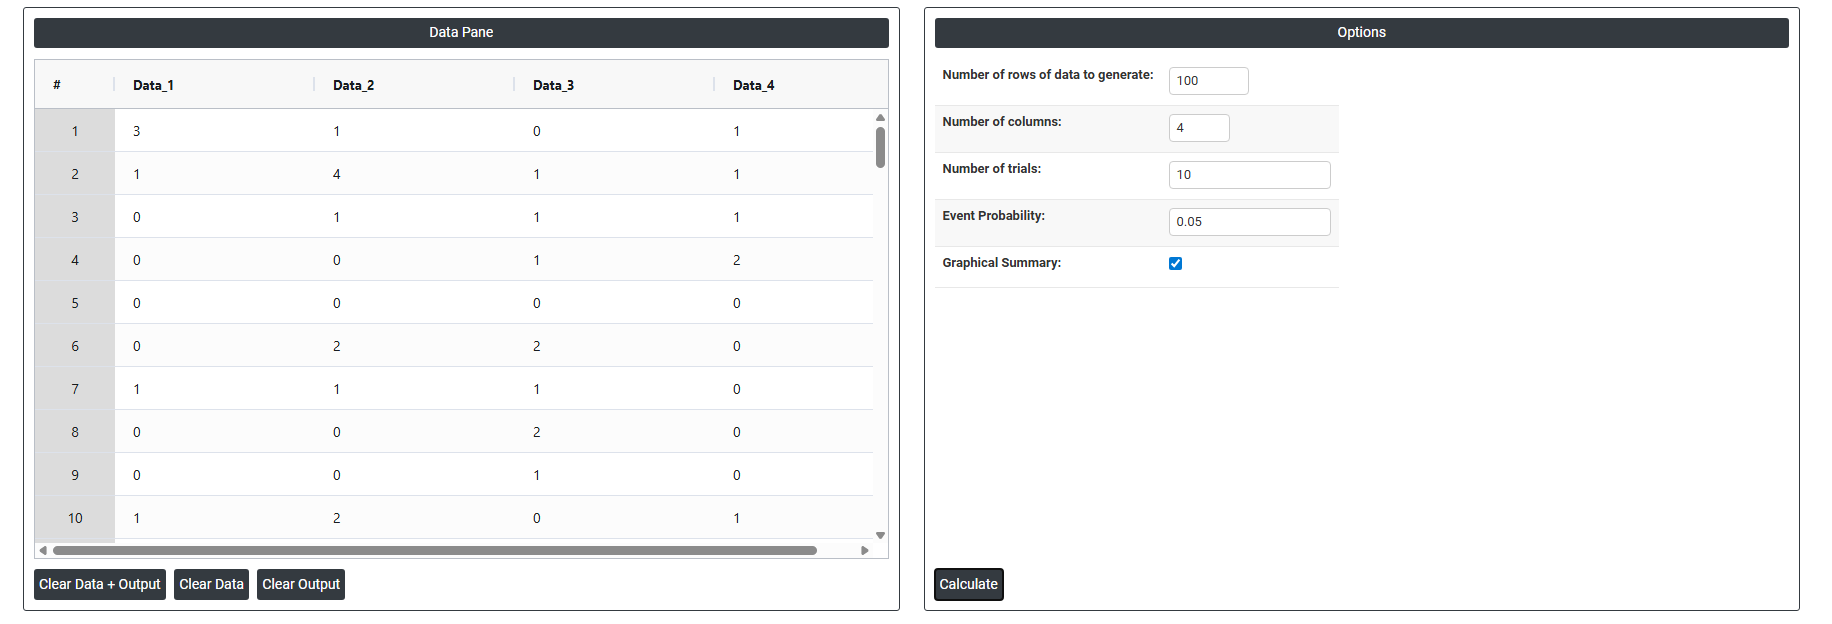
On the dashboard of Generate Random Binomial Data, the window is separated into two parts.
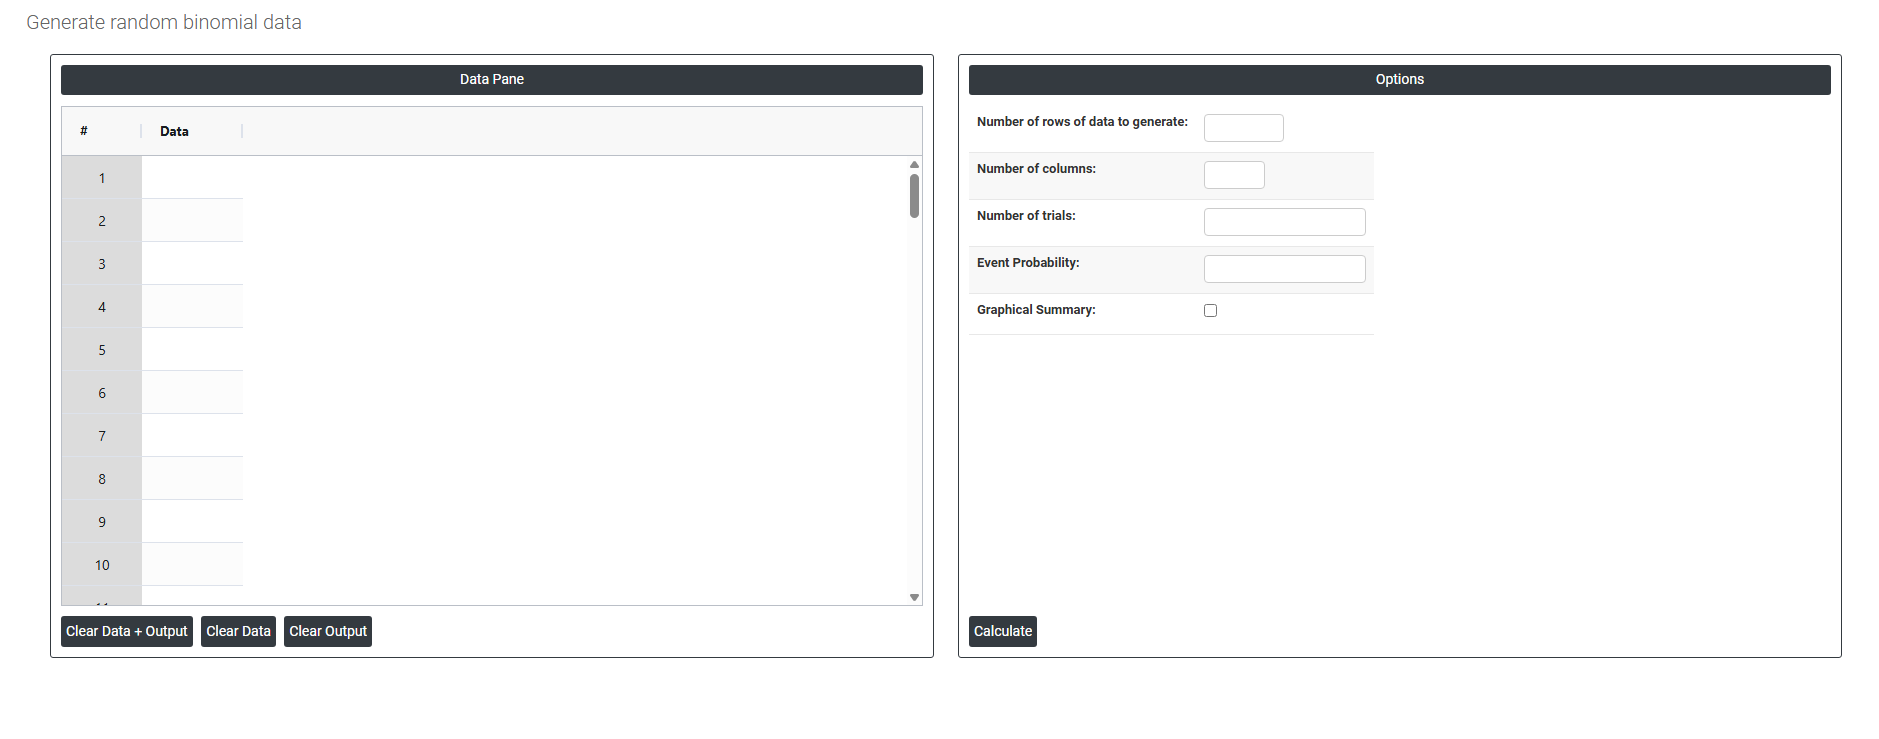
On the left part, Data Pane is present. In the Data Pane, each row makes random data generated. Data will be generated after filling the required options.
On the right part, there are many options present as follows:
- Number of rows of data to generate: Specifies how many random data points to generate. For example, entering 10 will produce exactly 10 rows of random values, all visible in the data pane.
- Number of columns: Specifies how many variables (columns) each row will have. For example, entering 3 will produce 3 columns of randomly generated data side by side in the data pane.
- Number of trials: Specifies how many times an event is attempted in each experiment. For example, entering 10 means each row of generated data represents 10 independent attempts (like flipping a coin 10 times). The resulting value in each row will be the count of how many of those trials resulted in a success.
- Event probability: The probability that any single trial results in a success, entered as a value between 0 and 1. For example, 0.5 represents a 50% chance of success on each trial, like a fair coin flip. The random data is generated based on this probability a higher value produces more successes per row, a lower value produces fewer.
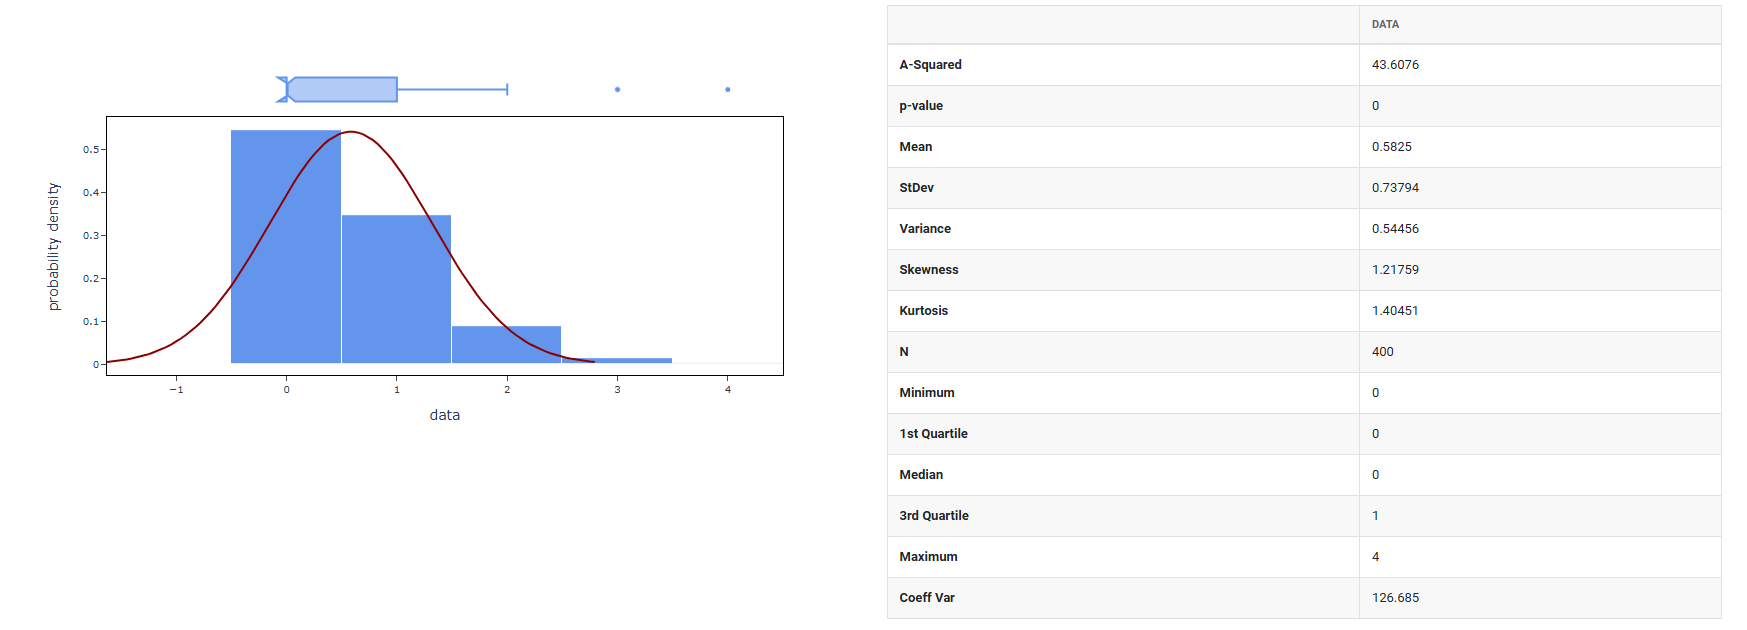
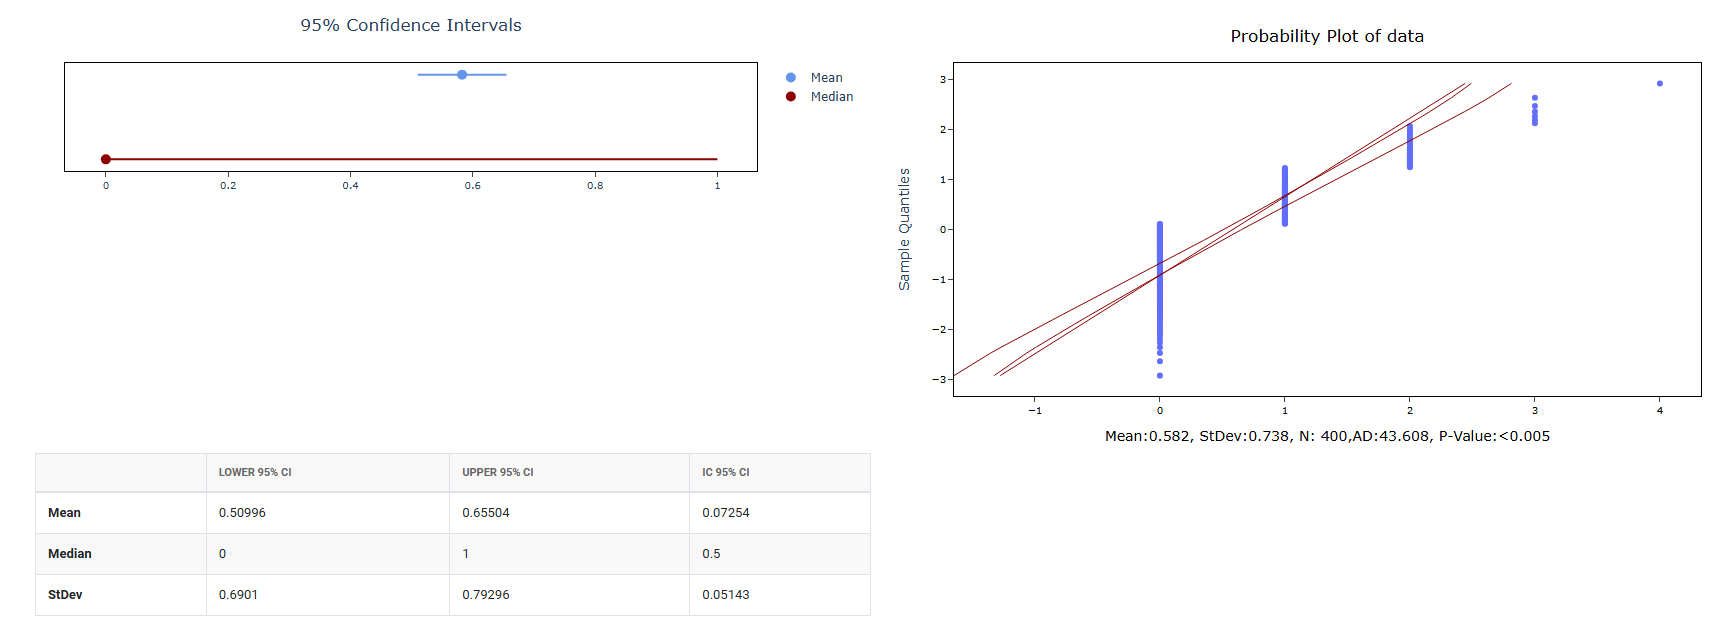
- Graphical summary: After the random data is generated using the mean and standard deviation you specified, this option produces a graphical analysis of that data such as a histogram showing how the generated values are distributed. It is a visual result based on the data that was just created.