What is Generate Random Normal Data?
Random Normal Data generates a dataset of values that follow a normal (Gaussian) distribution — the classic symmetric bell-shaped curve. You specify the number of rows, the mean (centre), and the standard deviation (spread), and the tool produces a random sample drawn from that distribution.
Simple Definitions: Generates random numbers that follow a bell-curve shape, centred at your specified mean with spread controlled by the standard deviation.
When to use Generate Random Normal Data?
- Use to simulate process data for testing control charts or capability analysis before real data is available.
- Use to validate statistical procedures by generating data with known properties and confirming expected results.
- Use for training, education, and Monte Carlo simulations of normally distributed processes.
Guidelines for correct usage of Generate Random Normal Data
- Set a random seed for reproducible results the same seed always produces the same dataset.
- Use realistic mean and standard deviation values when simulating actual process behaviour.
- Generate at least 30 values so the normal shape is clearly represented.
Alternatives: When not to use Generate Random Normal Data
- If the process is right-skewed and always positive, use Random Lognormal Data
- For pass/fail counts, use Random Binomial Data
- For time-between-failure simulations, use Random Exponential or Weibull Data
Example of Generate Random Normal Data
The following steps to Generate Random Normal Data:
- To Generate Random Normal Data need to fill the required options.
- Now analyses the data with the help of https://qtools.zometric.com/ or https://intelliqs.zometric.com/.
- To find Generate Random Normal Data choose https://intelliqs.zometric.com/> Statistical module> Random Data > Generate Random Normal Data
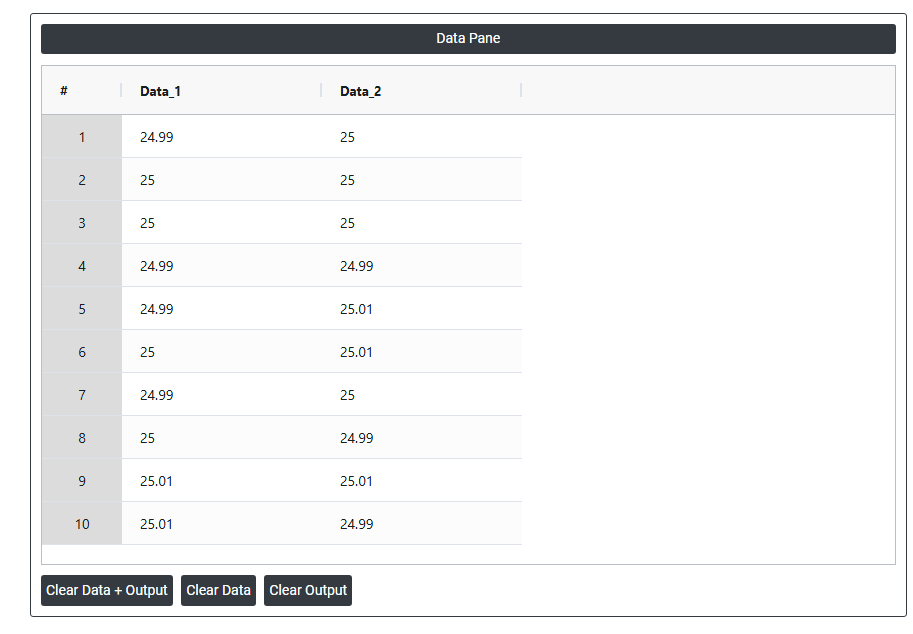
4. After using the above mentioned tool, fetches the output as follows:
How to do Generate Random Normal Data
The guide is as follows:
- Login in to QTools account with the help of https://qtools.zometric.com/ or https://intelliqs.zometric.com/
- On the home page, choose Statistical Tool> Random Data>Generate Random Normal Data.
- Next, you need to fill the required options.
- Finally, click on calculate at the bottom of the page and you will get desired results.
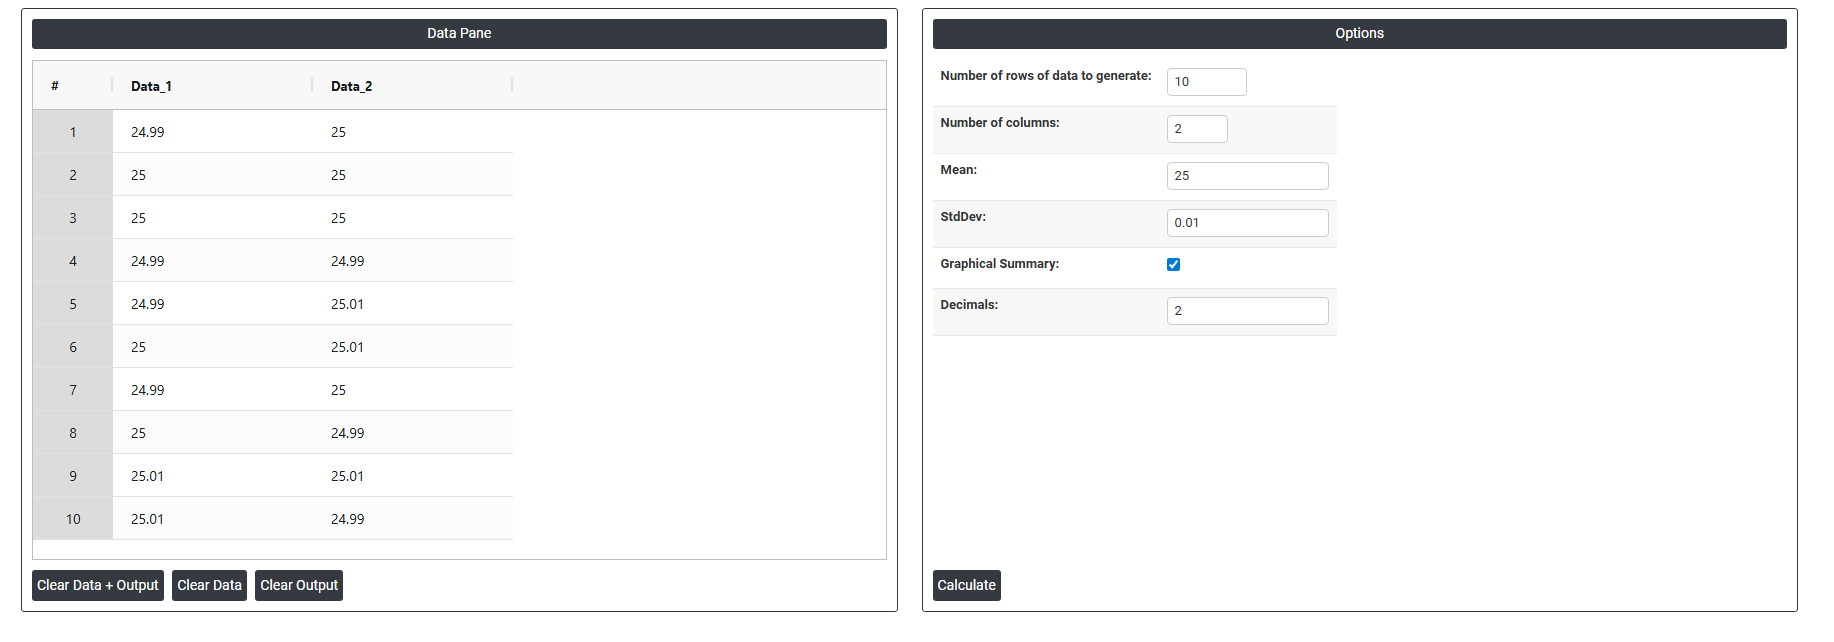
On the dashboard of Generate Random Normal Data, the window is separated into two parts.
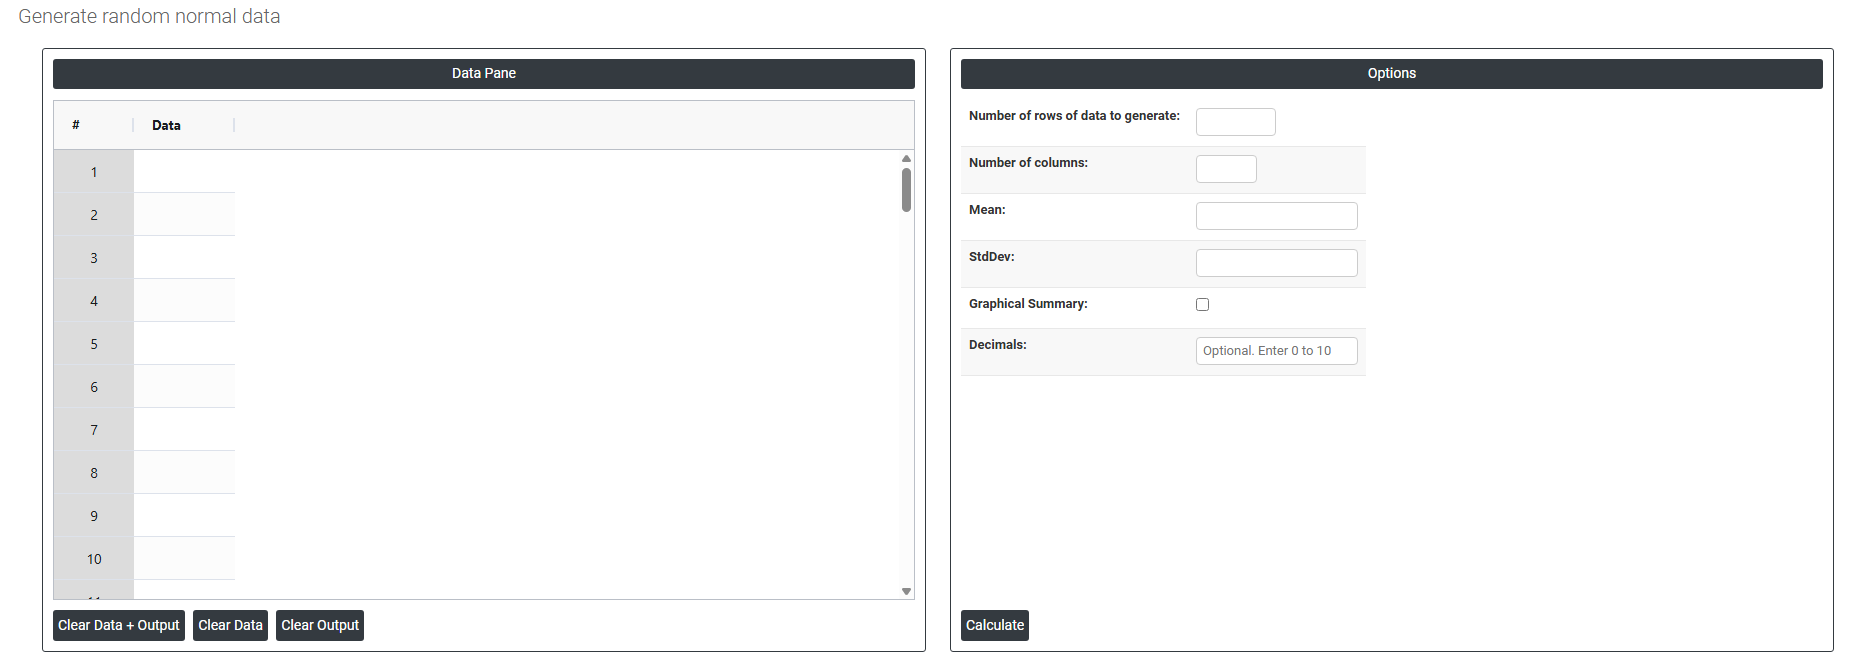
On the left part, Data Pane is present. In the Data Pane, each row makes random data generated. Data will be generated after filling the required options.
On the right part, there are many options present as follows:
- Number of rows of data to generate: Specifies how many random data points to generate. For example, entering 10 will produce exactly 10 rows of random values, all visible in the data pane.
- Number of columns: Specifies how many variables (columns) each row will have. For example, entering 3 will produce 3 columns of randomly generated data side by side in the data pane.
- Mean: The average value used as the centre point when generating the random data. The random numbers will be distributed around this value so if you set the mean to 50, the generated data will cluster around 50, with values spread above and below it according to the standard deviation.
- StdDev (standard deviation): Controls how far the generated values spread from the mean. A small value keeps the numbers tightly packed around the mean; a large value produces a wider spread. The random data is generated using this parameter, and the graphical summary then analyses and reflects that spread visually.
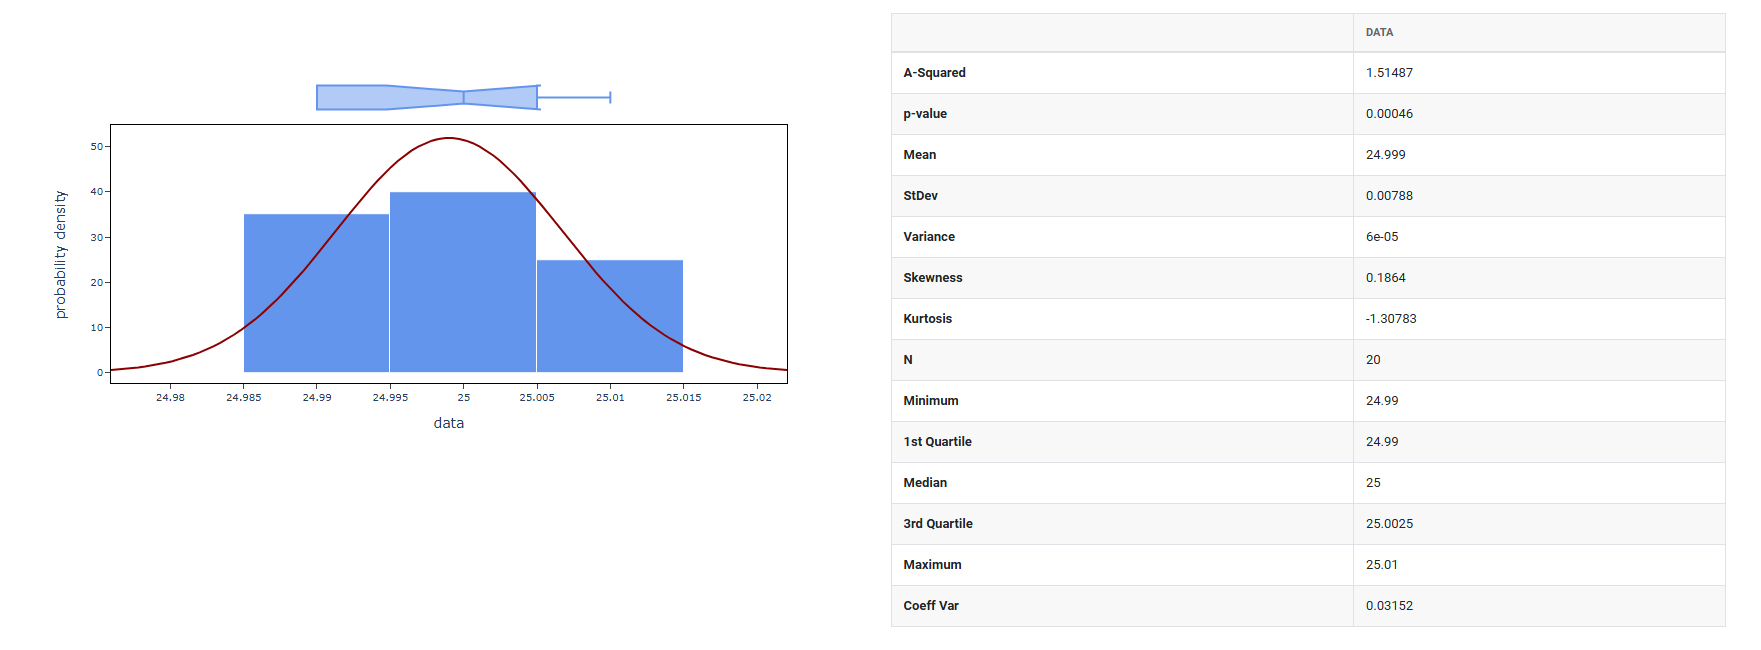
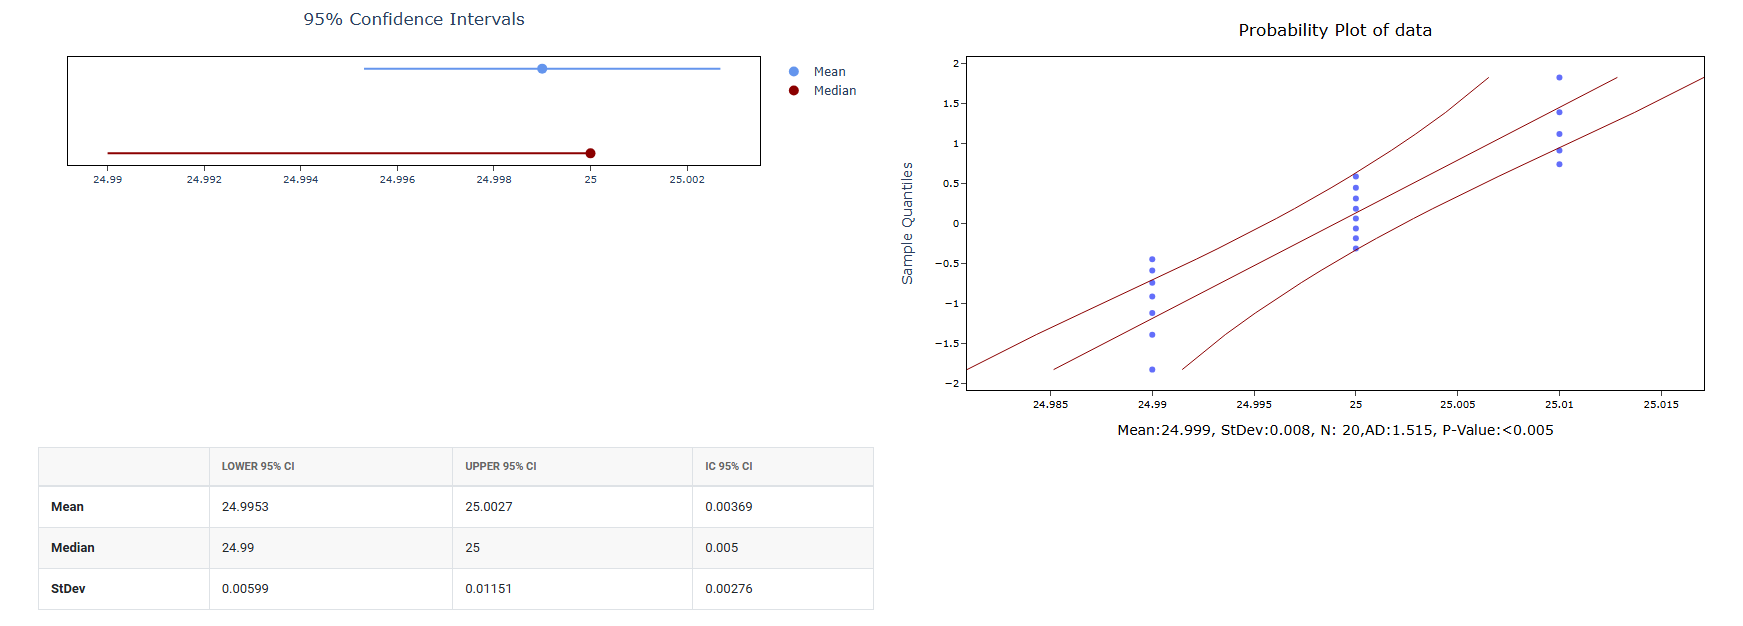
- Graphical summary: After the random data is generated using the mean and standard deviation you specified, this option produces a graphical analysis of that data such as a histogram showing how the generated values are distributed. It is a visual result based on the data that was just created.
- Decimals: Controls the number of decimal places in the generated random values themselves. For example, setting it to 2 means every generated number will be rounded to 2 decimal places, like 47.83 or 52.16. Setting it to 0 produces whole numbers only.