What is Individual Distribution Identification ?
When to use Individual Distribution Identification?
- Use when your data fails a normality test and you need to identify the correct distribution before running capability analysis.
- Use when working with process data that is inherently skewed — such as cycle times, failure times, chemical concentrations, or particle sizes.
- Use before applying nonnormal capability analysis to ensure the selected distribution accurately represents the process behaviour.
- Use when Box-Cox transformation is not appropriate — for example, when data contains zeros or negative values.
Guidelines for correct usage of Individual Distribution Identification
- Collect at least 50 to 100 data points for distribution fitting to be reliable — small samples do not provide enough information to distinguish between distributions.
- Use goodness-of-fit statistics (Anderson-Darling) and probability plots together when selecting the best distribution — do not rely solely on the p-value.
- Select a distribution that makes physical sense for the process — a distribution with the lowest AD statistic but no physical basis may not be the best choice.
- Ensure data is from a stable, in-control process before fitting distributions — distribution fitting on unstable process data produces meaningless results.
- Consider using Johnson or Box-Cox transformation as an alternative when no standard distribution fits well.
Alternatives: When not to use Individual Distribution Identification
- If data is already confirmed normal, proceed directly with standard Normal Capability Analysis — distribution identification is unnecessary.
- If you only need to check normality without exploring other distributions, use a simple Normality Test
- If the data has clear physical bounds or known distribution type, specify that distribution directly in capability analysis rather than testing all options.
Example of Individual Distribution Identification
An engineer collects a random sample of capsules and records their calcium content. In order to determine the best fit data distribution, he performs an individual distribution identification. The test in following steps:
- Gathered the necessary data.
- Now analyses the data with the help of https://qtools.zometric.com/ or https://intelliqs.zometric.com/.
- To find Individual Distribution Identification choose https://intelliqs.zometric.com/> Statistical module> Hypothesis Test> Individual Distribution Identification.
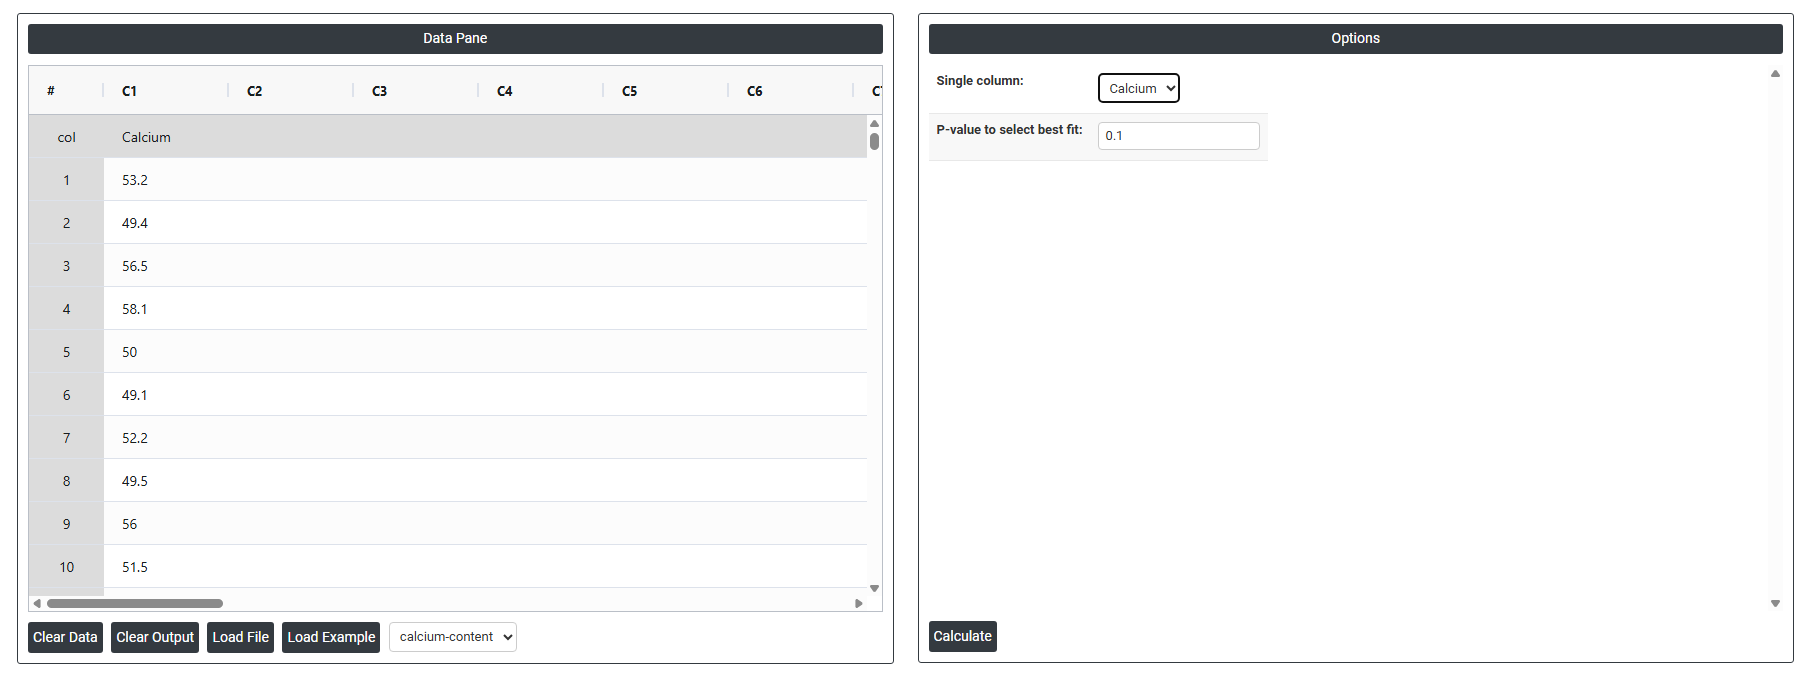
- Inside the tool, feeds the data along with other inputs as follows:
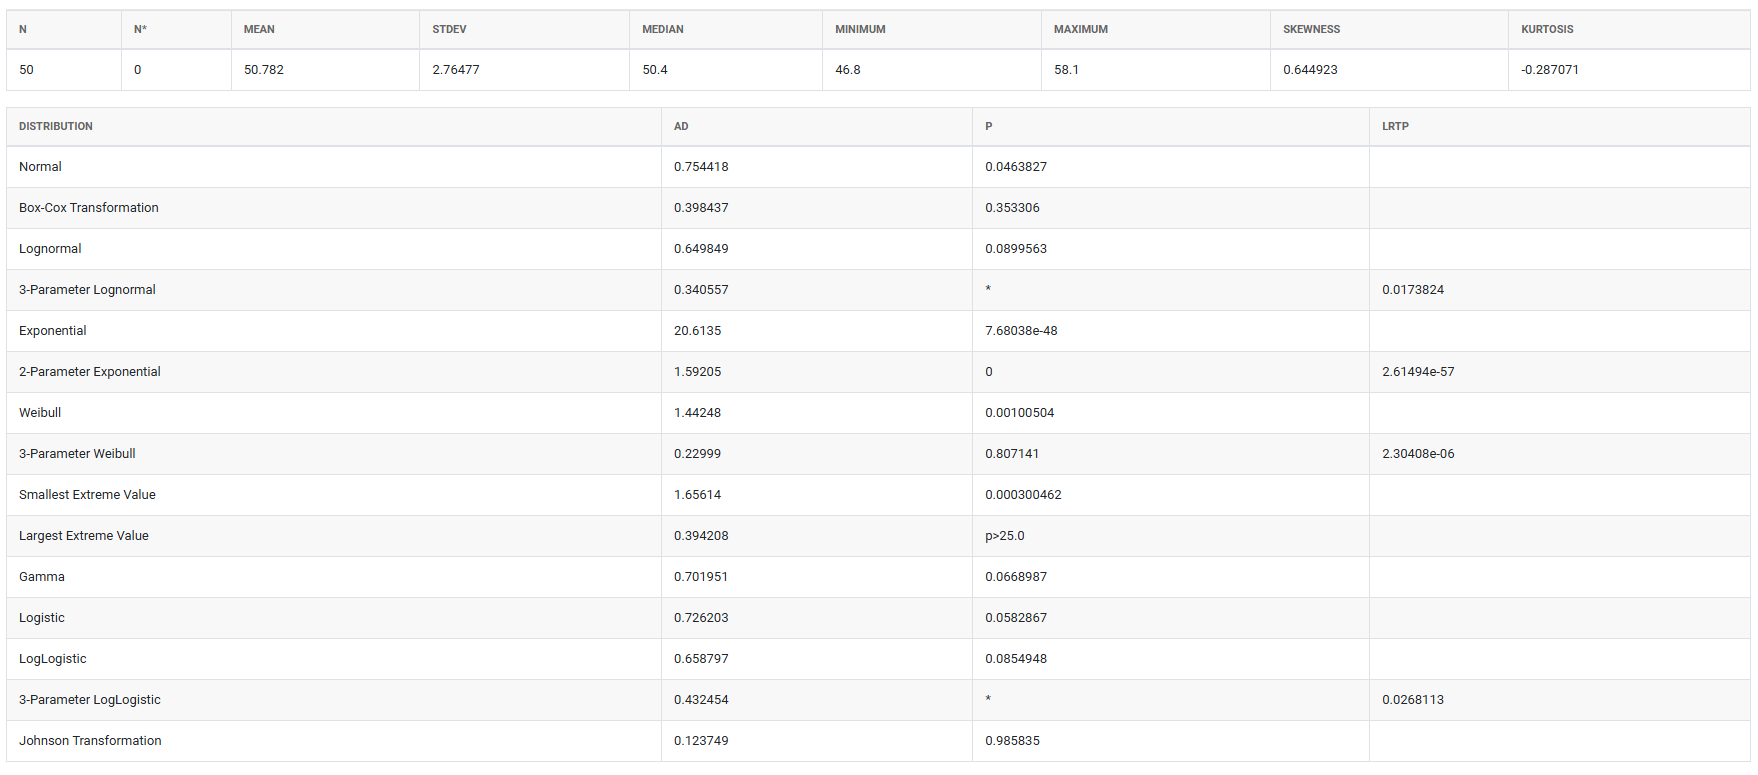
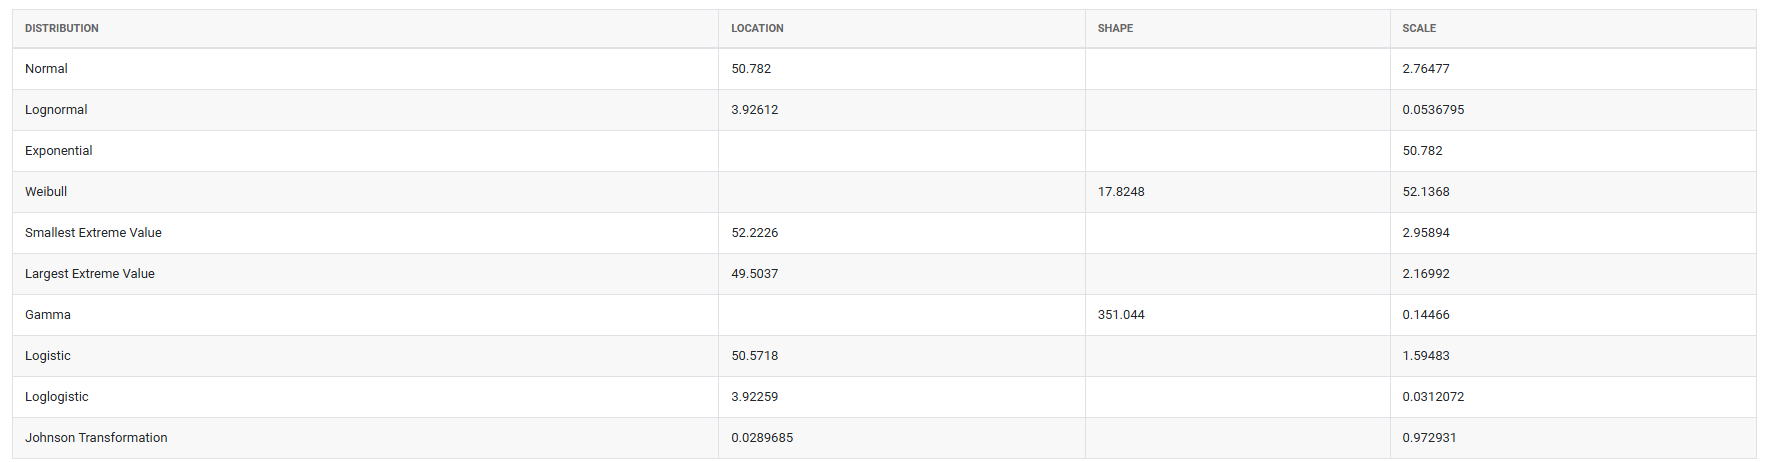
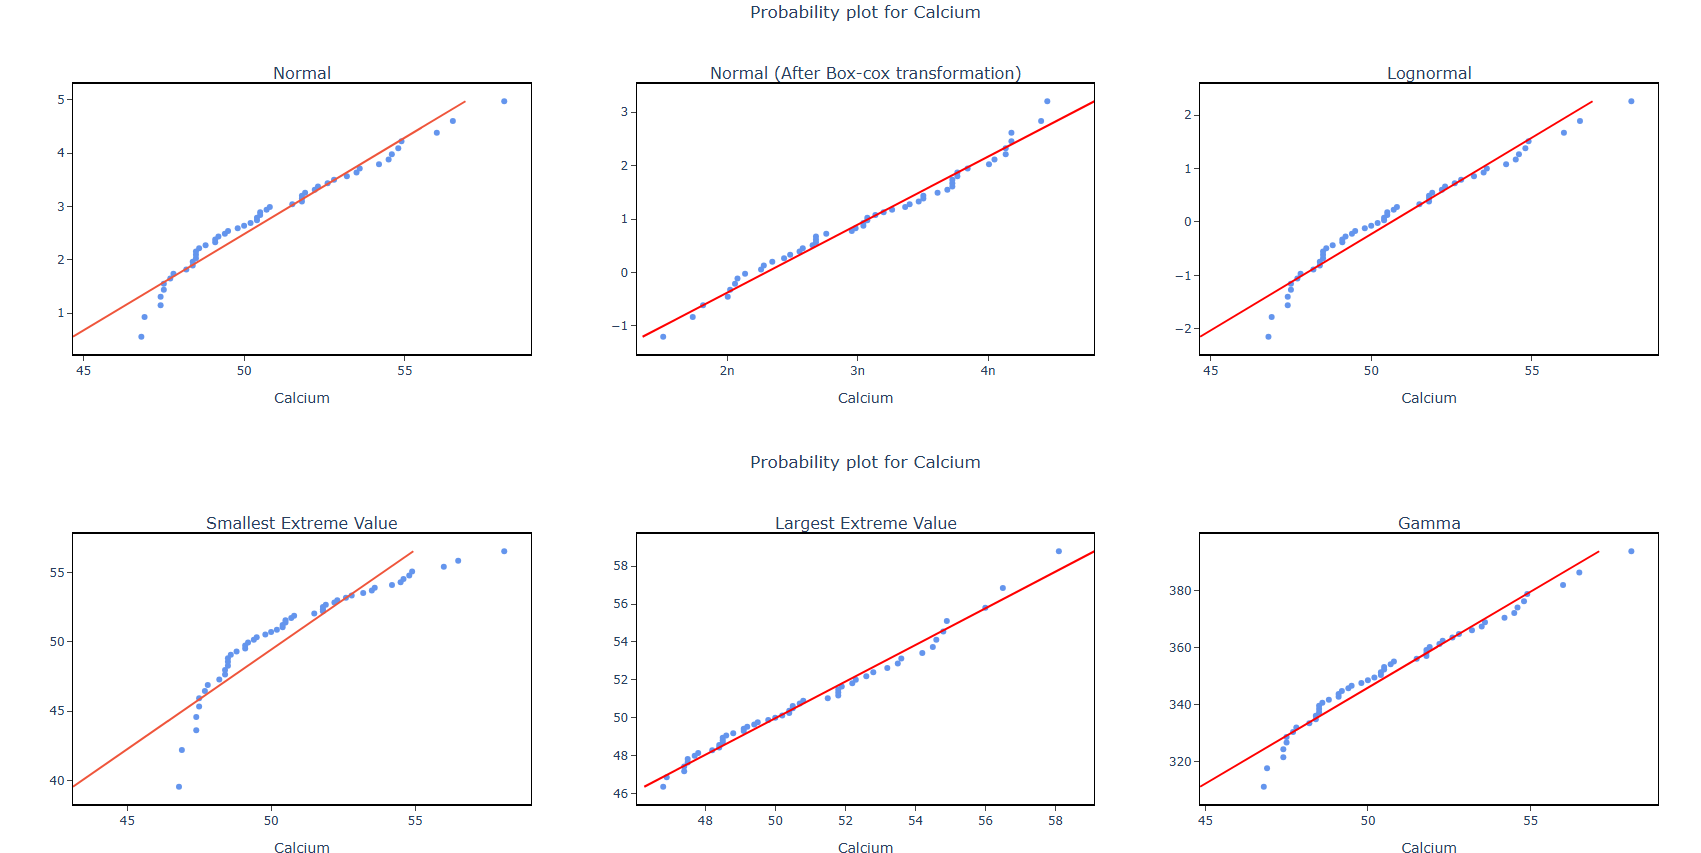
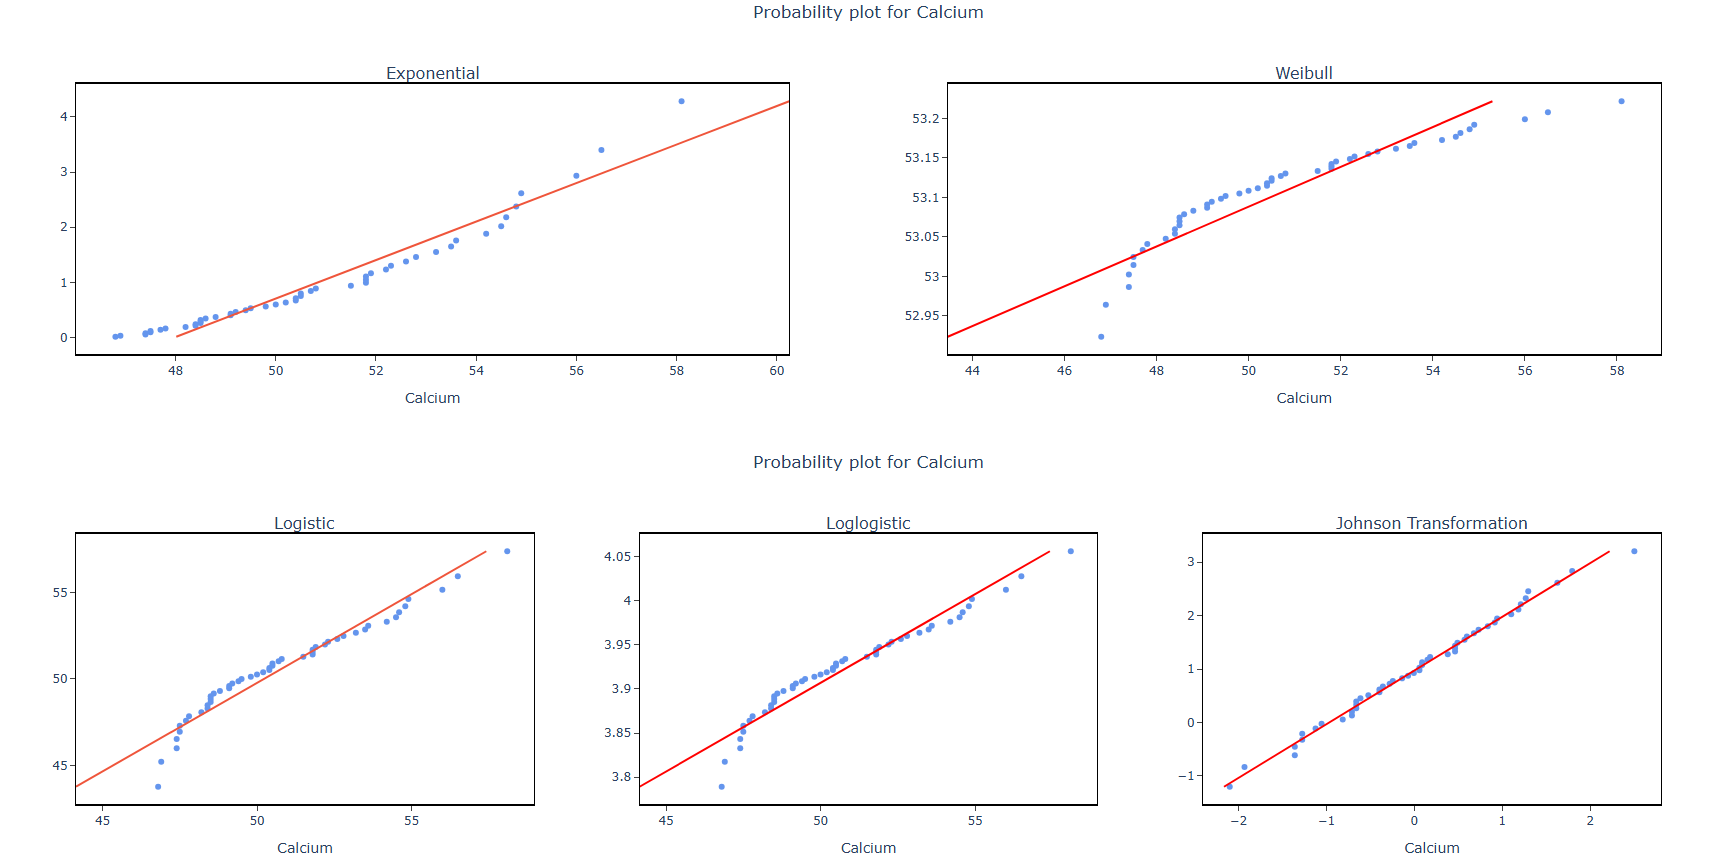
5. After using the above mentioned tool, fetches the output as follows:
How to do Individual Distribution Identification
The guide is as follows:
- Login in to QTools account with the help of https://qtools.zometric.com/ or https://intelliqs.zometric.com/
- On the home page, choose Statistical Tool> Hypothesis Test >Individual Distribution Identification .
- Next, update the data manually or can completely copy (Ctrl+C) the data from excel sheet and paste (Ctrl+V) it here.
- Fill the required options.
- Finally, click on calculate at the bottom of the page and you will get desired results.
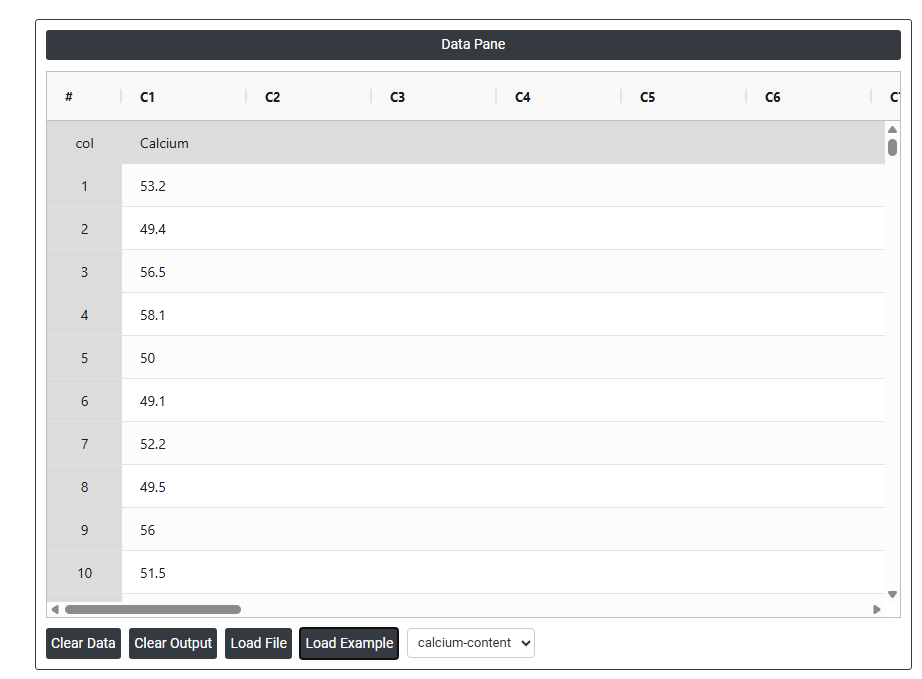
On the dashboard of Individual Distribution Identification, the window is separated into two parts.
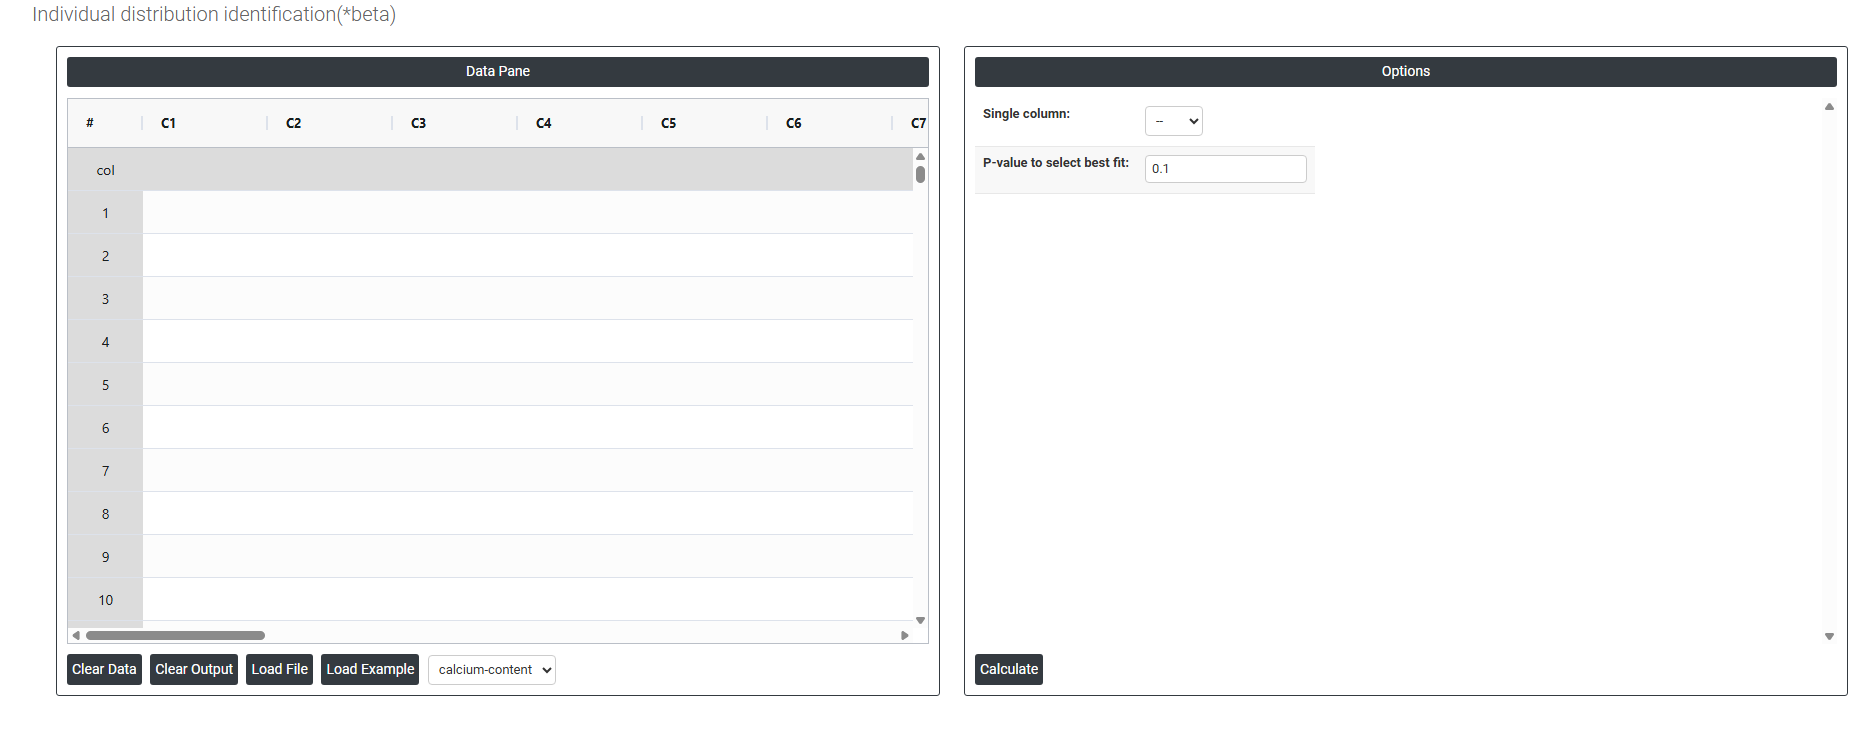
On the left part, Data Pane is present. In the Data Pane, each row makes one subgroup. Data can be fed manually or the one can completely copy (Ctrl+C) the data from excel sheet and paste (Ctrl+V) it here.
Load example: Sample data will be loaded.
Load File: It is used to directly load the excel data.
On the right part, there are many options present as follows:
- Single Column: Select the column containing the continuous data you want to fit distributions to — for example, measurements such as calcium levels, cycle times, tensile strength, or particle sizes. The tool will take all values in this column and simultaneously test them against multiple probability distributions to determine which one best describes the shape and behaviour of your data. Only one column can be selected at a time as each variable is evaluated independently.
- P-Value to Select Best Fit: Sets the significance threshold used to determine which distributions provide an acceptable fit to your data. The standard default is 0.05, meaning any distribution whose Anderson-Darling goodness-of-fit p-value is greater than 0.05 is considered a statistically acceptable fit — there is insufficient evidence to reject that distribution as a model for your data. How to interpret the p-value in this context:
- P-value > 0.05 — the distribution fits the data acceptably. The higher the p-value, the stronger the evidence that the distribution is a good match.
- P-value ≤ 0.05 — the distribution does not fit the data well and should not be used for capability analysis or further modelling.
- When multiple distributions produce acceptable p-values, choose the one with the highest p-value as the primary candidate — but always combine this with a visual review of the probability plot and consider whether the selected distribution makes physical sense for your process. A distribution that fits statistically but has no logical basis for your data type should be questioned before use.