What is Linearity & Bias Study?
Linearity & bias study is a statistical analysis that evaluates the accuracy and precision of a measurement instrument or assay. It involves determining the degree to which the instrument or assay produces results that are consistent with a known standard or reference material.
Linearity refers to the ability of an instrument or assay to produce results that are directly proportional to the amount of analyte being measured. A linear relationship is ideal because it allows for accurate and reliable measurements across a range of concentrations.
Bias, on the other hand, refers to a systematic error that results in measurements that are consistently different from the true value. A bias can be positive (overestimation of the true value) or negative (underestimation of the true value). It is important to identify and correct for bias in order to ensure accurate measurements.
When to use Linearity & Bias Study?
Linearity and bias studies are typically used to evaluate the accuracy and precision of a measurement instrument or assay. They are particularly important in industries where accurate and reliable measurements are critical, such as healthcare, pharmaceuticals, and environmental testing.
Linearity and bias studies are commonly used in the following situations:
- Method validation: Before a new measurement method can be used for routine testing, it must be validated to ensure that it produces accurate and reliable results. A linearity and bias study is an essential part of method validation.
- Quality control: Linearity and bias studies can be used as part of a quality control program to ensure that an instrument or assay is performing within acceptable limits.
- Troubleshooting: If an instrument or assay is producing unexpected results, a linearity and bias study can help identify any issues with the measurement system.
- Inter-laboratory comparisons: In multi-site studies, a linearity and bias study can be used to ensure that results are consistent across different laboratories.
Overall, a linearity and bias study is a valuable tool for assessing the accuracy and precision of a measurement instrument or assay, and can be used in a variety of settings to ensure high-quality results.
Guidelines for correct usage of Linearity & Bias Study
- Each reference part must have a known measurement
- Data should be collected in a random order
- Select parts that represent the actual or expected range of the measurements
- One operator should perform all the measurements
- A reference value is the known standard measurement of the reference part.
Alternatives: When not to use Linearity & Bias Study
- If you have crossed data, use a Crossed Gage R&R Study to comprehensively analyze your measurement system.
- On the other hand, if you have nested data, use a Nested Gage R&R Study to fully evaluate your measurement system.
Example of Linearity & Bias Study?
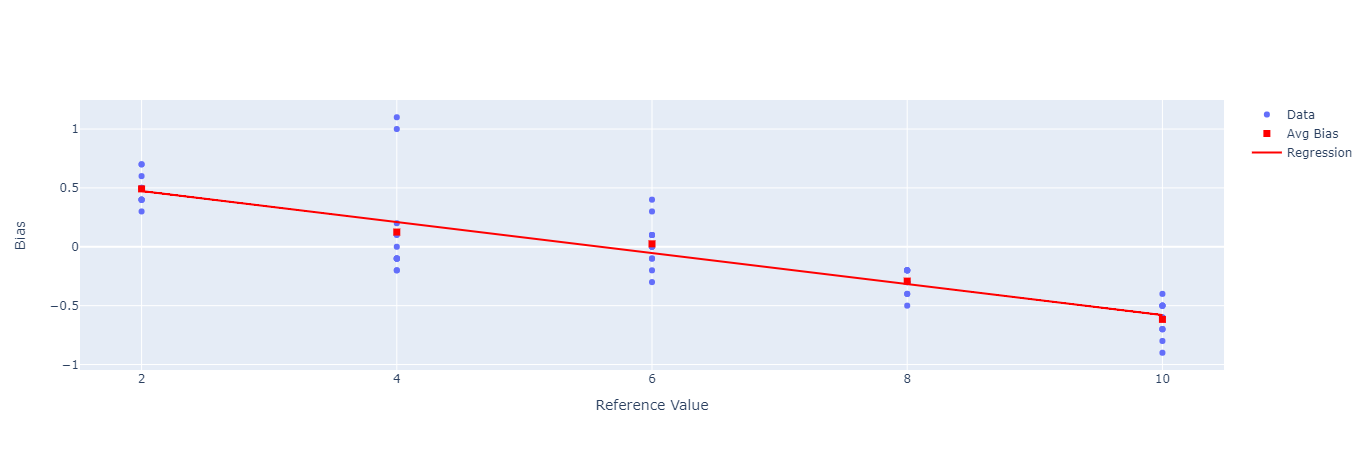
To evaluate the linearity and bias of a measurement gage used to measure inner diameters of bearings, an engineer selected five parts that represent the expected range of measurements. The engineer used a layout inspection to determine the master measurement of each part, and one operator randomly measured each part 12 times. In a prior analysis, the engineer performed a crossed gage R&R study using the ANOVA method and found that the total study variation was 16.5368. She has performed this in following steps:
- She worked all day and gathered the necessary data.
- Now, she analyzes the data with the help of https://qtools.zometric.com/
- Inside the tool, she feeds the data. Also, she puts process variation as 16.5368.
- After using the above mentioned tool, she fetches the output as follows:
How to do Linearity & Bias Study
The guide is as follows:
- Login in to QTools account with the help of https://qtools.zometric.com/
- On the home page, you can see Linearity & Bias Study under Measurement System Analysis.
- Click on Linearity & Bias Study and reach the dashboard.
- Next, update the data manually or can completely copy (Ctrl+C) the data from excel sheet and paste (Ctrl+V) it here.
- Next, you need to put the value of process variation.
- Finally, click on calculate at the bottom of the page and you will get desired results.
On the dashboard of Linearity & Bias Study, the window is separated into two parts.
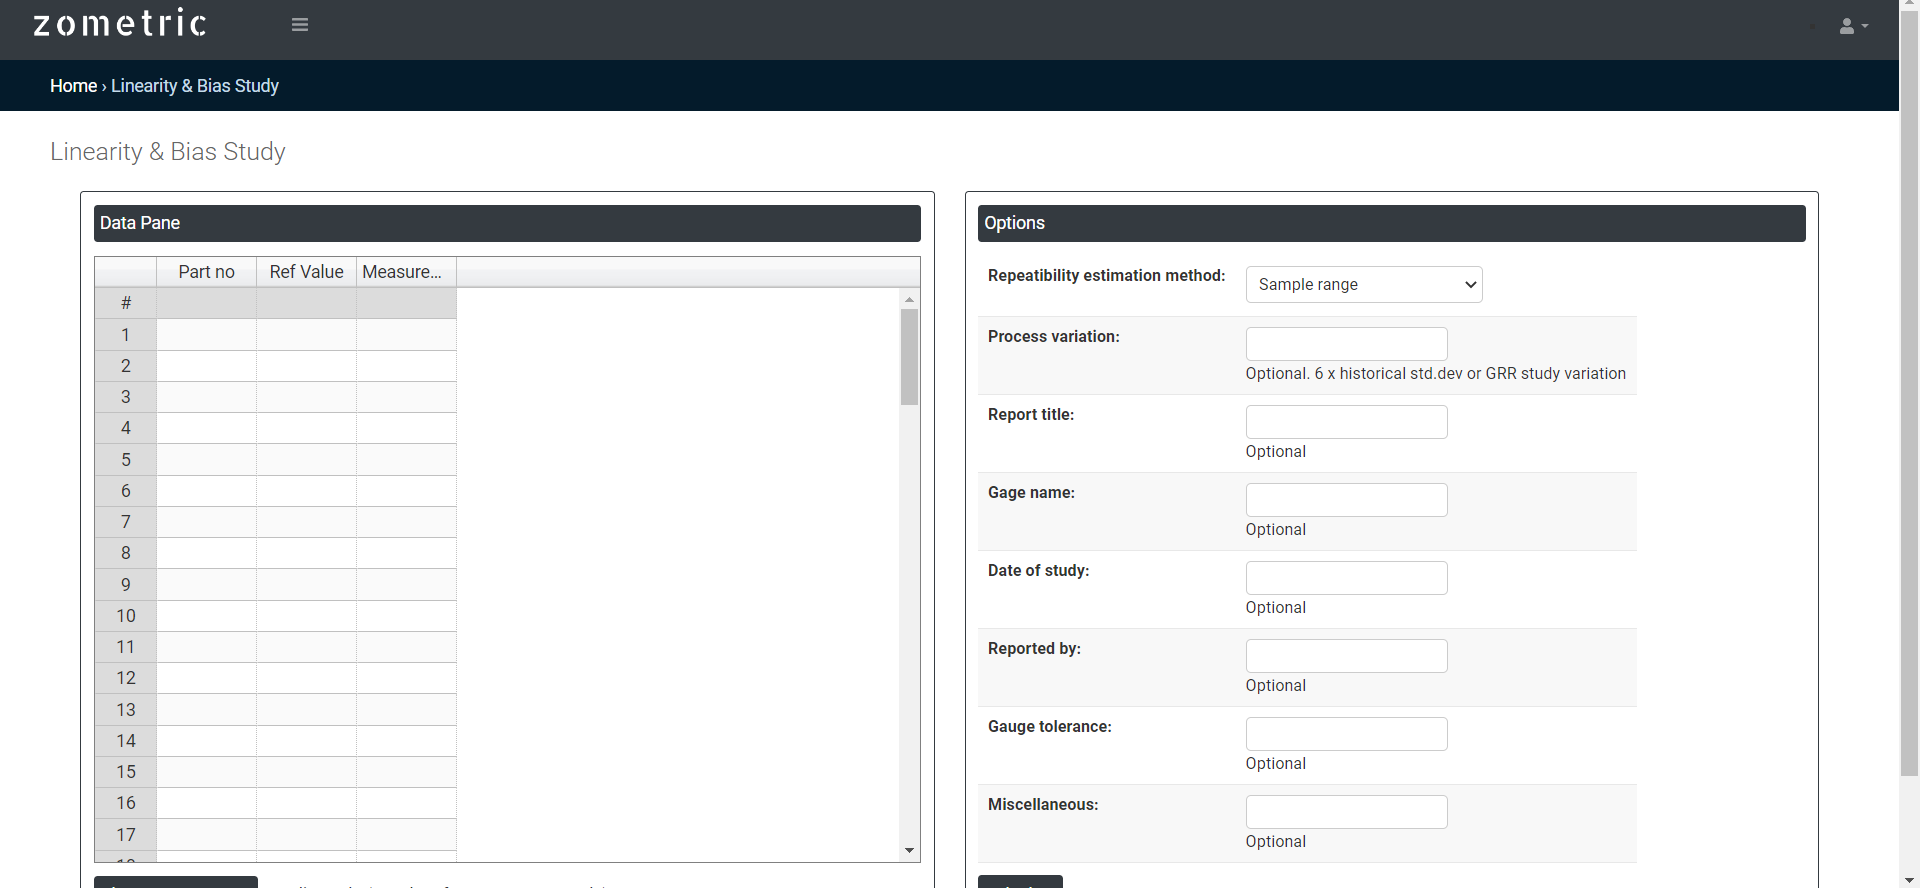
On the left part, Data Pane is present. In the Data Pane, each row makes one subgroup. Data can be fed manually or the one can completely copy (Ctrl+C) the data from excel sheet and paste (Ctrl+V) it here.
On the right part, there are many options present as follows:
- Repeatability estimation method:
- Sample range: The sample range repeatability estimation method is used to assess the precision and repeatability of a measurement system. This method involves selecting a set of samples that cover the expected range of measurements for the system and then measuring each sample multiple times, typically at least 10 times.
- Sample standard deviation: The sample standard deviation repeatability estimation method is another approach to assess the precision and repeatability of a measurement system. This method involves measuring a set of samples multiple times, typically at least 10 times, and then calculating the sample standard deviation of the repeated measurements.
- Process variation: Process variation refers to the variation that is inherent in the process or method used to make the measurements. This variation is separate from the variation due to the measurement system itself.