What is Mann Whitney ?
The Mann-Whitney Test (also known as the Wilcoxon Rank-Sum Test) is a nonparametric test that compares two independent groups to determine whether one tends to produce higher or lower values than the other. It ranks all values together and compares the rank distributions between the two groups making it a reliable, distribution-free alternative to the two-sample t-test.
Simple Definitions: A test that compares three or more independent groups to determine if at least one has a significantly different median without requiring normally distributed data.
When to use Mann Whitney?
- Use when comparing exactly two independent groups on a continuous or ordinal response variable.
- Use when data is not normally distributed or sample sizes are too small to verify normality.
- Use as a nonparametric alternative to the two-sample t-test when t-test assumptions are violated.
- Use when the response is ordinal such as survey ratings or ranked preferences.
Guidelines for correct usage of Mann Whitney
- The two groups must be completely independent no observation should appear in both groups.
- Collect at least 5 to 10 observations per group for reliable results.
- Both groups should have similar distribution shapes if interpreting the result as a difference in medians.
- Decide on a one-tailed or two-tailed test based on your hypothesis before running the analysis.
- A non-significant result does not prove equality only that insufficient evidence was found to conclude a difference.
Alternatives: When not to use Mann Whitney
- If data is normally distributed, use Two-Sample T-Test more powerful under normality.
- If comparing three or more independent groups, use Kruskal-Wallis Test
- If groups are paired or related, use One-Sample Wilcoxon Test on the differences instead.
- If comparing a single sample against a known target, use One-Sample Sign or Wilcoxon Test
Example of Mann Whitney
A highway official wants to determine whether two road-striping paint brands differ in durability. For each brand, the official records the number of months the paint remains visible on comparable highway segments until repainting is required. Because durability times can be skewed and normality/equal-variance assumptions may not hold, the official performs a Mann–Whitney test to assess whether the median months of persistence differ between the two brands. The following steps:
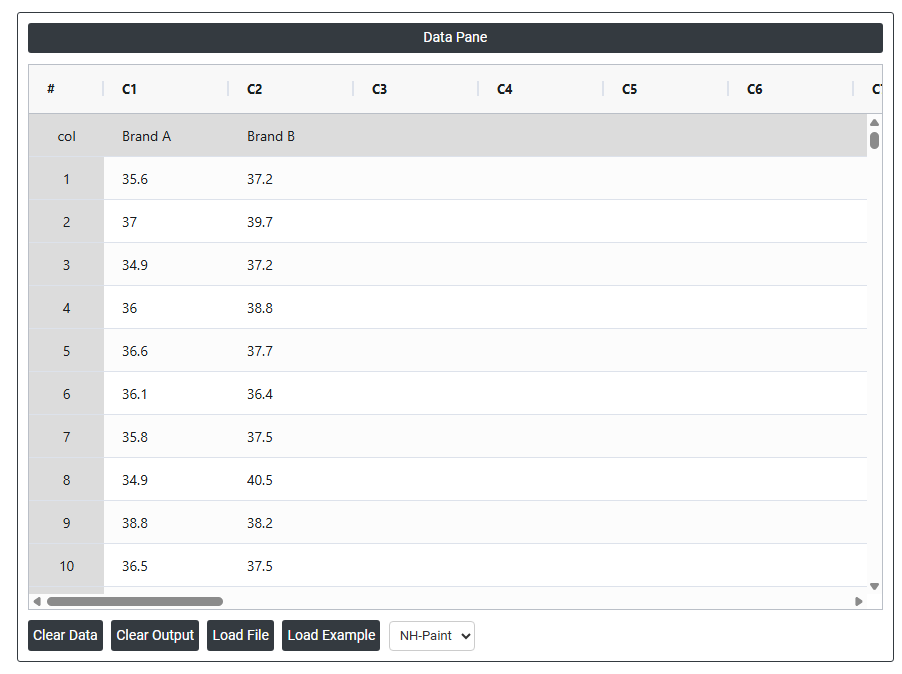
- Gathered the necessary data.
- Now analyses the data with the help of https://qtools.zometric.com/ or https://intelliqs.zometric.com/.
- To find Mann Whitney Test choose https://intelliqs.zometric.com/> Statistical module> Nonparametric > Mann Whitney.
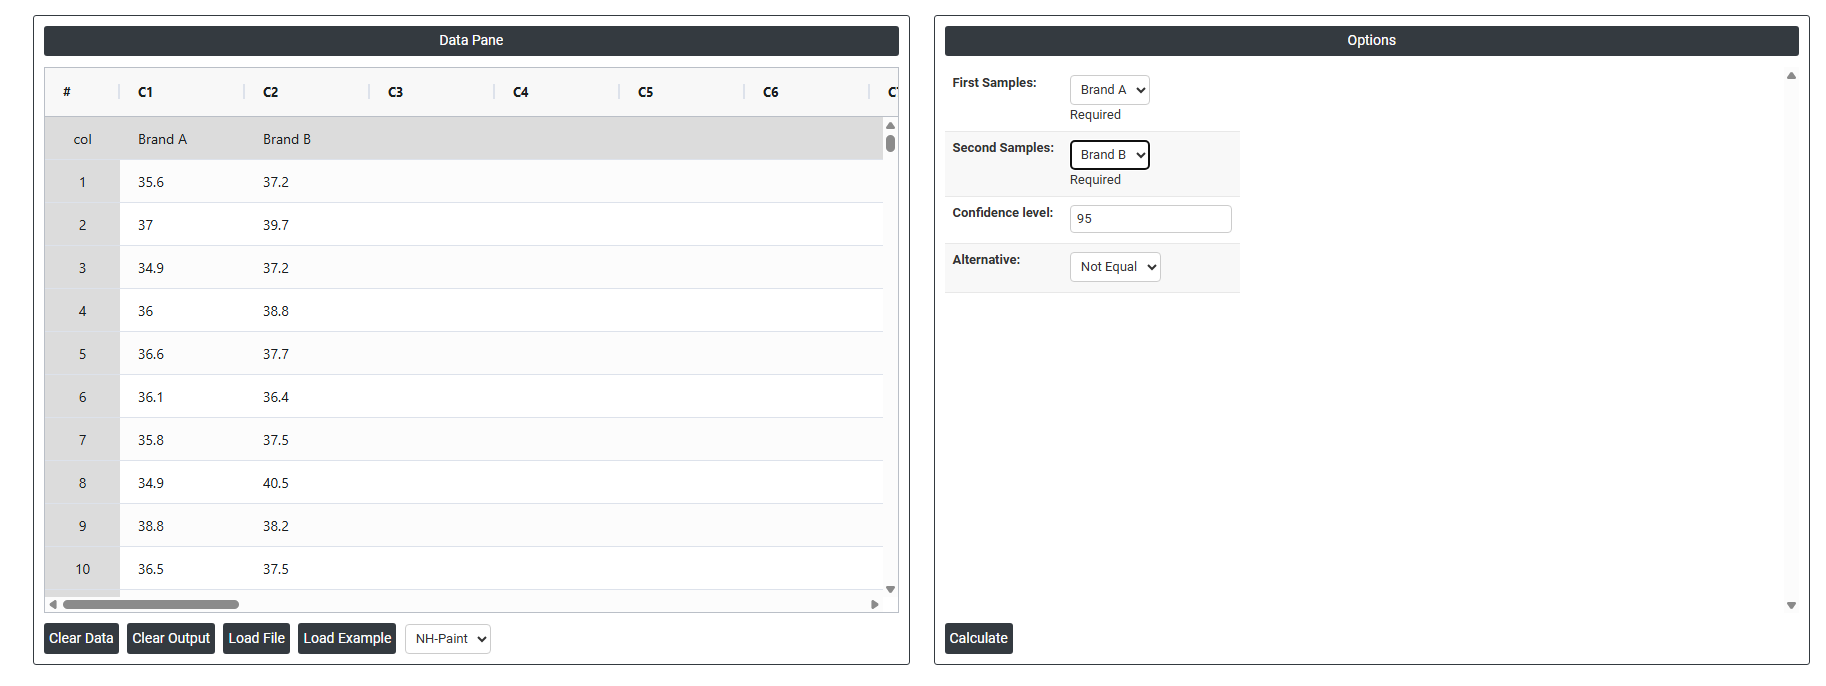
- Inside the tool, feeds the data along with other inputs as follows:
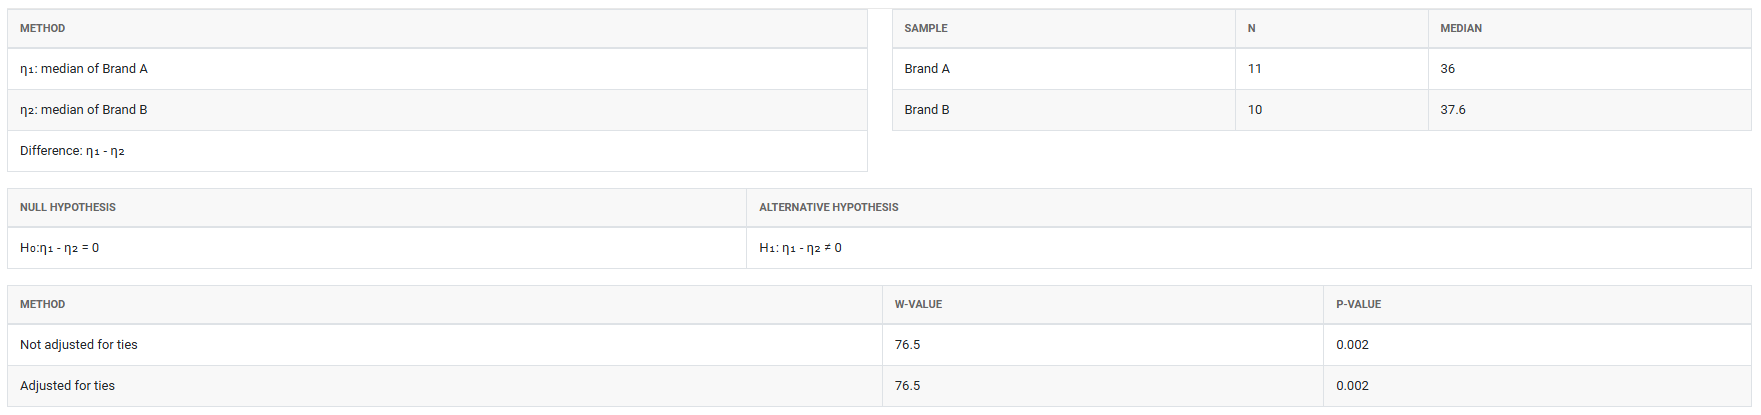
5. After using the above mentioned tool, fetches the output as follows:
How to do Mann Whitney
The guide is as follows:
- Login in to QTools account with the help of https://qtools.zometric.com/ or https://intelliqs.zometric.com/
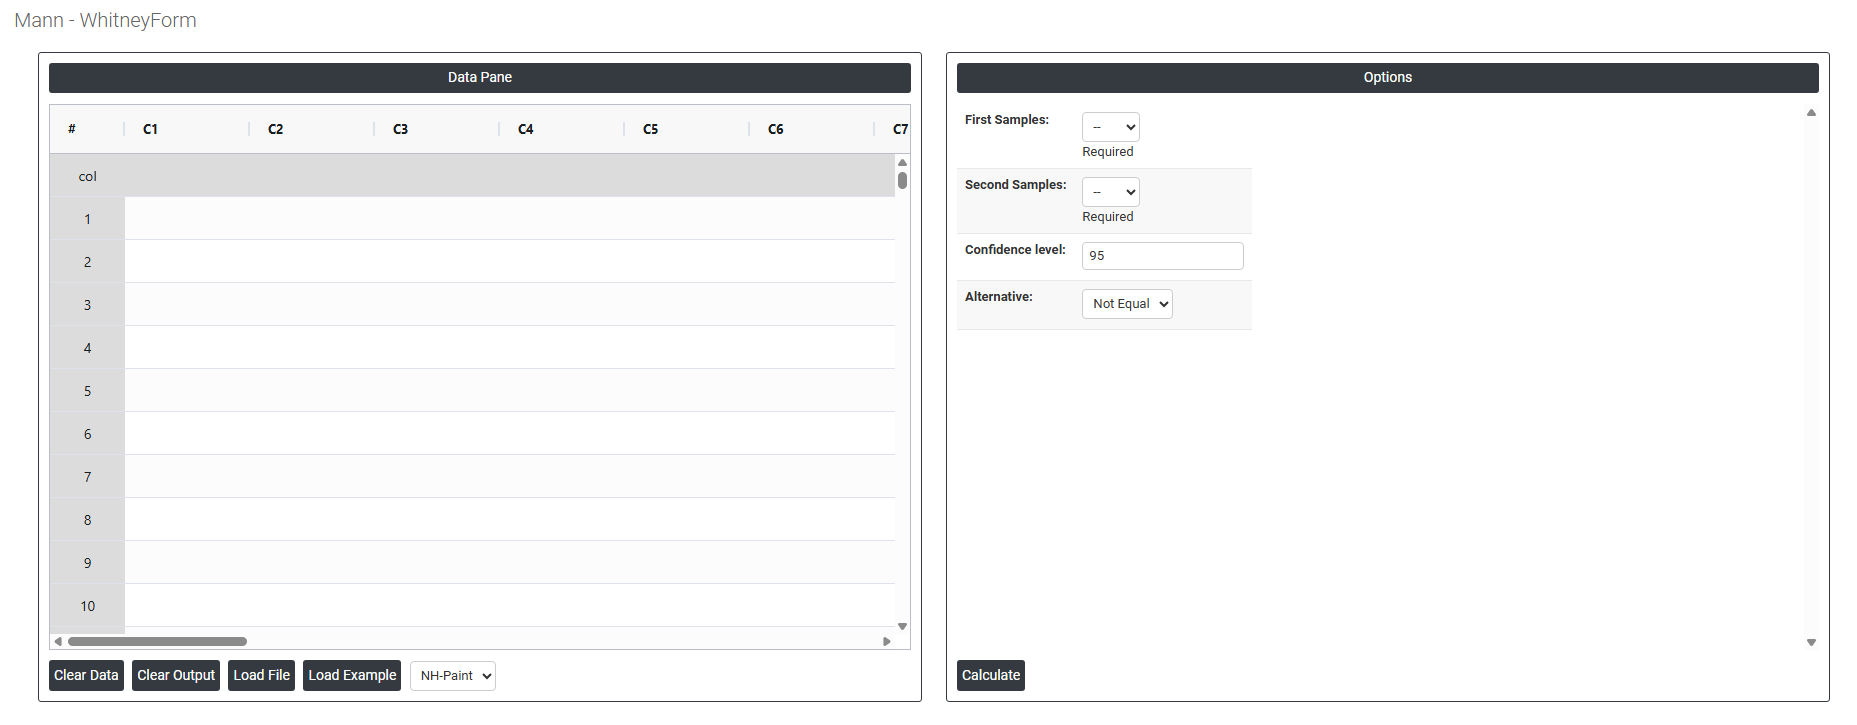
- On the home page, choose Statistical Tool> Nonparametric>Mann Whitney.
- Next, update the data manually or can completely copy (Ctrl+C) the data from excel sheet and paste (Ctrl+V) it here.
- Next, you need to fill the required options.
- Finally, click on calculate at the bottom of the page and you will get desired results.
On the dashboard of Mann Whitney, the window is separated into two parts.
On the left part, Data Pane is present. In the Data Pane, each row makes one subgroup. Data can be fed manually or the one can completely copy (Ctrl+C) the data from excel sheet and paste (Ctrl+V) it here.
Load example: Sample data will be loaded.
Load File: It is used to directly load the excel data.
On the right part, there are many options present as follows:
- First Sample: Select the column containing the data for your first group the baseline or reference group you want to compare. Each row in this column represents one independent observation from the first population .
- Second Sample: Select the column containing the data for your second group the group being compared against the first. Each row must be an independent observation from the second population . The two columns must not share any observations they must be completely independent of each other.
- Confidence Level (Default 95%): Sets the certainty level for the confidence interval calculated around the difference between the two group medians. The default of 95% means you are 95% confident the true difference in medians falls within the reported range. This is the universally accepted standard in statistical practice it balances being cautious enough to avoid false conclusions while remaining practically useful. A higher confidence level (e.g. 99%) produces a wider interval; a lower level (e.g. 90%) produces a narrower one but with less certainty.
- Alternative (Default: Not Equal): Defines the direction of your hypothesis what you are testing for. Three options are typically available:
- Not Equal — a two-tailed test that checks whether the two groups differ in either direction. Use this when you have no prior expectation about which group will be higher or lower. This is the recommended default for most analyses.
- Less Than — a one-tailed test that checks whether the first group median is specifically smaller than the second. Use only when you have a strong, pre-specified reason to expect this direction before collecting data.
- Greater Than — a one-tailed test that checks whether the first group median is specifically larger than the second. Again, use only when the direction is justified in advance.