What is Mood's Median?
Mood’s Median Test compares the medians of two or more independent groups by counting how many values in each group fall above and below the combined overall median. It uses a chi-square test to determine whether this distribution differs significantly across groups. Its primary strength is robustness it is highly resistant to extreme outliers because it only considers direction (above or below the overall median), not the actual size of each value.
Simple Definitions: A test that compares group medians by simply counting values above or below the overall midpoint making it the most outlier-resistant nonparametric comparison available.
When to use Mood's Median?
- Use when comparing two or more independent groups and the data contains significant outliers that could distort other tests.
- Use when data is non-normal and outlier resistance is more important than statistical power.
- Use when group sizes are very unequal and a simple, robust comparison is preferred.
Guidelines for correct usage of Mood's Median
- All groups must be independent.
- Collect at least 5 observations per group.
- Be aware that this test has less statistical power than Kruskal-Wallis it is more likely to miss a real difference when one exists.
- Use primarily when outliers are a genuine concern and cannot be removed or corrected.
Alternatives: When not to use Mood's Median
- If outliers are not a major concern, use Kruskal-Wallis Test it is more statistically powerful.
- If data is normally distributed, use One-Way ANOVA
- If comparing only two groups without severe outliers, use Mann-Whitney Test
- If groups are related or repeated measures, use Friedman Test
Example of Mood's Median
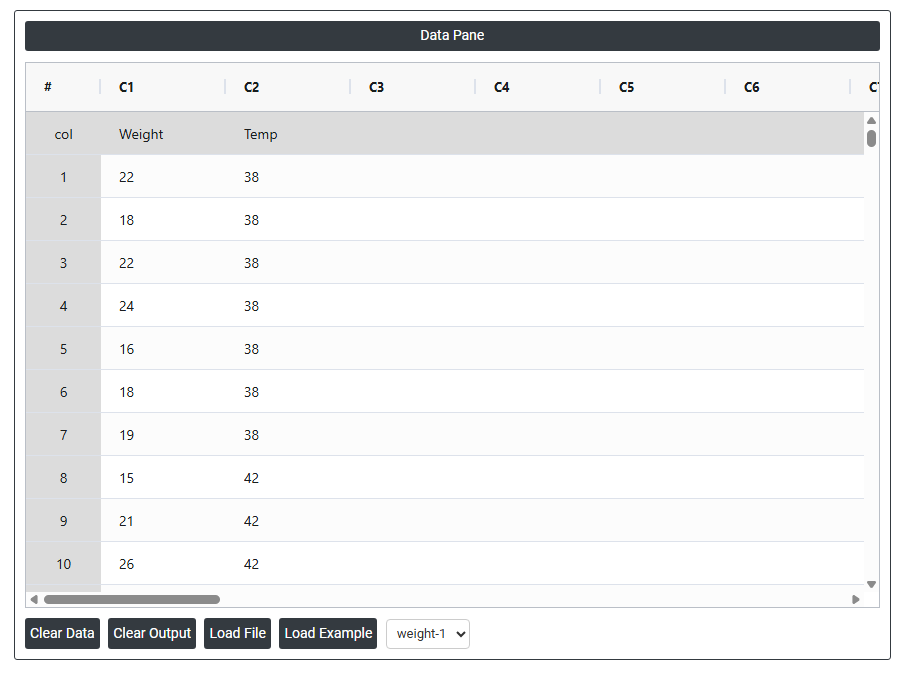
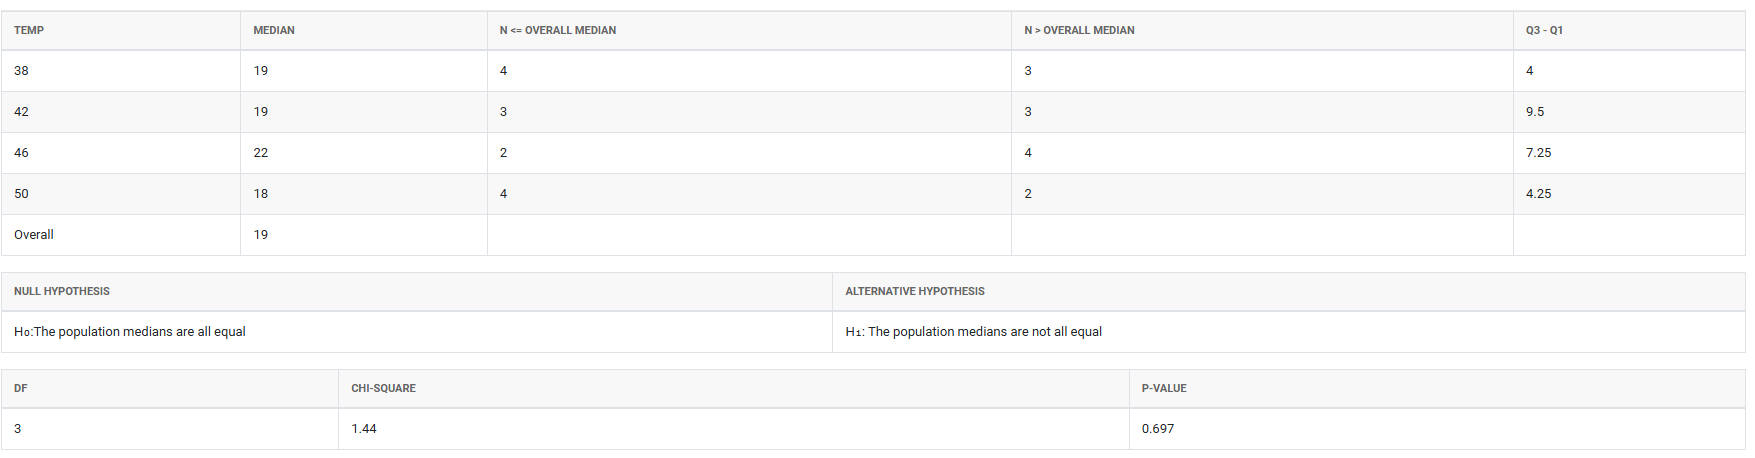
A researcher is studying whether water temperature influences the growth of fish. Twenty-five fish that had just hatched were randomly assigned to four separate groups. Each group was placed in a controlled tank where the only difference among the tanks was temperature. After six months, the fish were weighed. Mood’s median test was applied to assess whether the median weights of the four groups were the same or not. The following steps:
- Gathered the necessary data.
- Now analyses the data with the help of https://qtools.zometric.com/ or https://intelliqs.zometric.com/.
- To find Mood's Median choose https://intelliqs.zometric.com/> Statistical module> Nonparametric > Mood's Median.
- Inside the tool, feeds the data along with other inputs as follows:
5. After using the above mentioned tool, fetches the output as follows:
How to do Mood's Median
The guide is as follows:
- Login in to QTools account with the help of https://qtools.zometric.com/ or https://intelliqs.zometric.com/
- On the home page, choose Statistical Tool> Nonparametric>Mood's Median.
- Next, update the data manually or can completely copy (Ctrl+C) the data from excel sheet and paste (Ctrl+V) it here.
- Next, you need to fill the required options.
- Finally, click on calculate at the bottom of the page and you will get desired results.
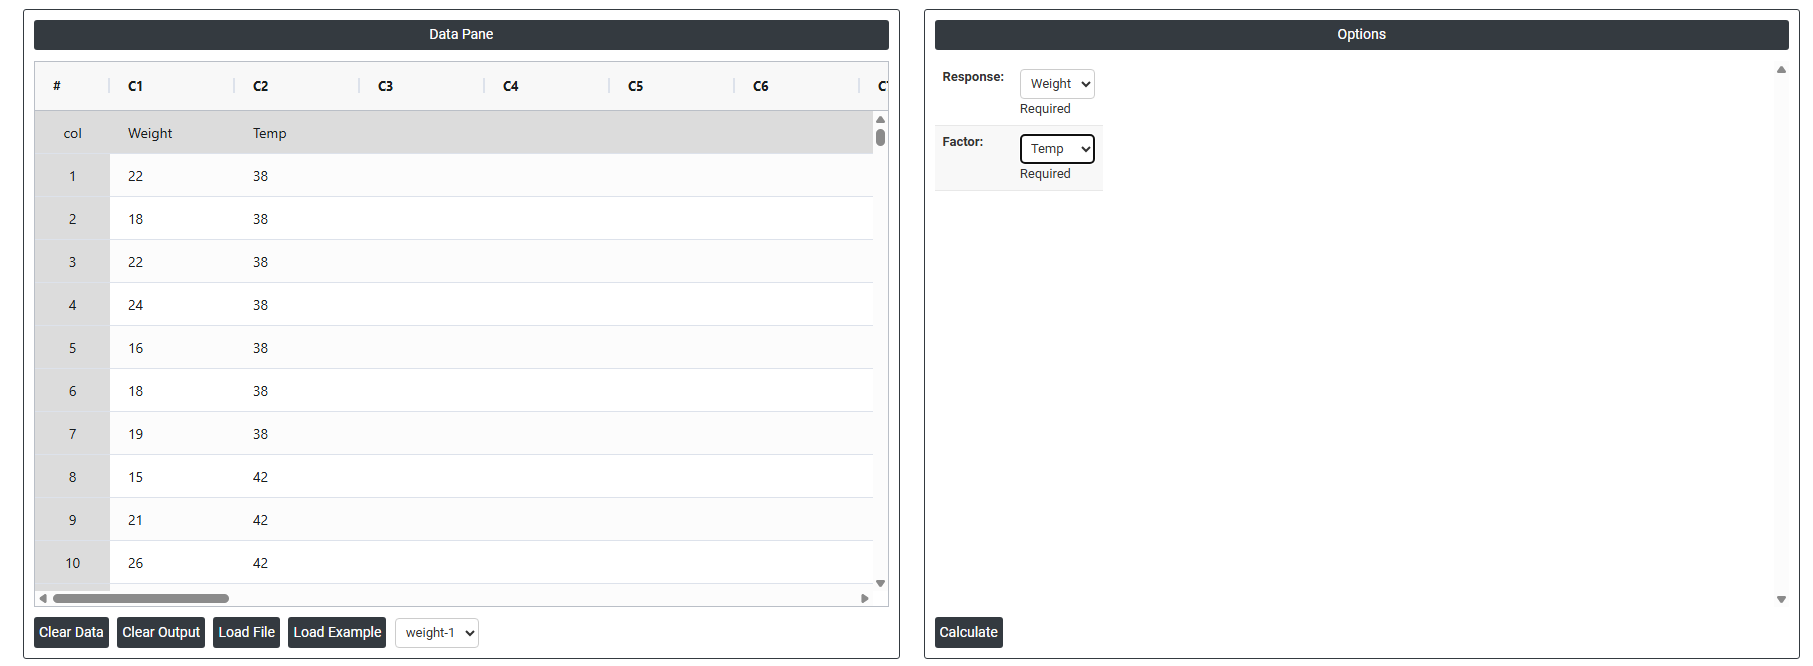
On the dashboard of Mood's Median, the window is separated into two parts.
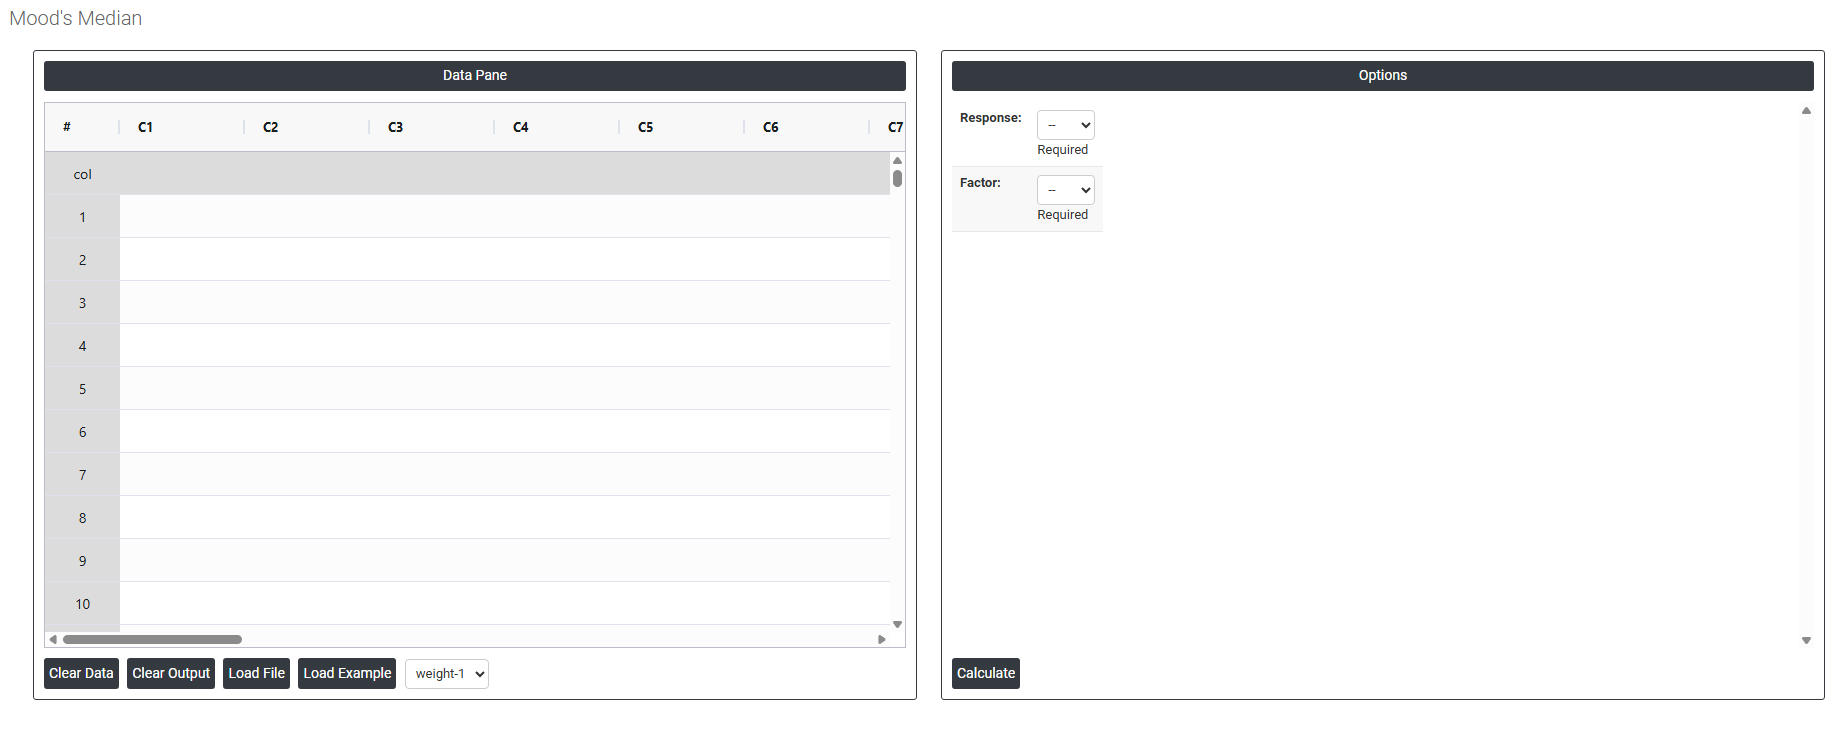
On the left part, Data Pane is present. In the Data Pane, each row makes one subgroup. Data can be fed manually or the one can completely copy (Ctrl+C) the data from excel sheet and paste (Ctrl+V) it here.
Load example: Sample data will be loaded.
Load File: It is used to directly load the excel data.
On the right part, there are many options present as follows:
- Response Select the column that contains the actual measurement values you want to compare across groups such as dimensions, weights, scores, or any continuous or ordinal variable being studied. This is the outcome variable whose median the test will evaluate and compare between the different groups.
- Factor Select the column that identifies which group each observation belongs to such as machine type, shift, supplier, or treatment condition. The factor column defines the groups being compared, and the test uses this to split the response data into separate groups before comparing their medians against the overall combined median.