What is Nested GRR?
Nested GRR (Nested Gauge Repeatability and Reproducibility) is a measurement system analysis designed for situations where it is not possible for every operator to measure every part. Instead of the standard crossed design — where all operators measure all parts — in a nested design each operator measures a unique, non-overlapping set of parts.
This design is necessary when parts are consumed, destroyed, or permanently altered during measurement — such as in destructive testing, chemical analysis, or any process where measuring a part changes it. Because each part is only measured by one operator, the nested design separates reproducibility from part-to-part variation without requiring the same part to be re-measured by another operator.
Simple Definitions: A measurement system study for situations where each part can only be measured by one operator — such as destructive testing where the standard crossed Gage R&R design is not physically possible.
When to use Nested GRR?
- Use when parts are destroyed or permanently altered during measurement — making it impossible for a second operator to measure the same part.
- Use when parts cannot be re-identified or re-presented to another operator after the first measurement.
- Use when the measurement process is inherently destructive — such as tensile strength testing, hardness testing, or chemical concentration analysis.
- Use when a crossed Gage R&R is not feasible due to the nature of the part or the measurement method.
Guidelines for correct usage of Nested GRR
- Assign unique, non-overlapping parts to each operator — no part should be measured by more than one operator in the nested design.
- Use at least 3 operators, each measuring at least 5 parts with 2 or more replicates per part to obtain reliable variance estimates.
- Parts assigned to each operator should be representative of the full range of process variation, not cherry-picked or limited to a narrow range.
- Understand that reproducibility and part-to-part variation are confounded in a nested design — the analysis cannot fully separate these two sources as cleanly as a crossed design can.
- Analyse results using the Gage R&R (Nested) analysis tool — do not use the crossed Gage R&R analysis, as it assumes a different data structure.
Alternatives: When not to use Nested GRR
- If all operators can measure all parts, always use Crossed Gage R&R (Create Gage R&R Study Worksheet) instead — it provides a cleaner and more complete separation of variance components.
- If the measurement characteristic is attribute-based (pass/fail), use Attribute Agreement Analysis
Example of Nested GRR
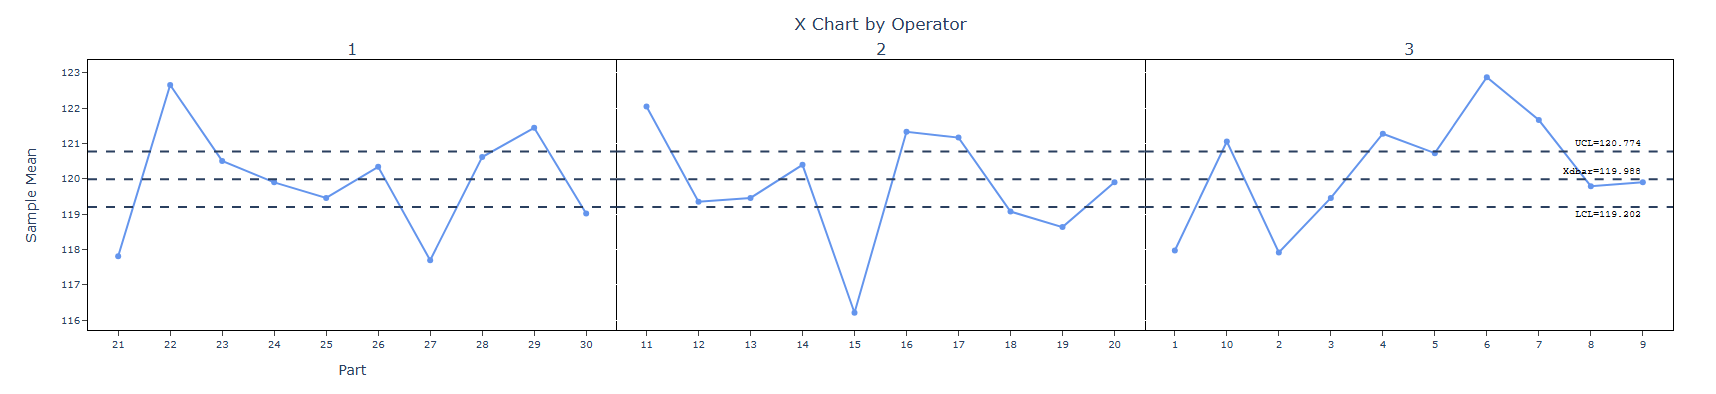
An engineer wants to monitor the impact strength of ceramic components. The engineer randomly selects 30 samples that represent the expected range of the process variation and gives 10 random samples to 3 randomly selected operators. The 3 operators measure the temperature of the 10 different samples twice, for a total of 60 measurements. Each part (sample) is unique to operator; no 2 operators measured the same part. The following steps:
- Gathered the necessary data.
- Now analyses the data with the help of https://qtools.zometric.com/ or https://intelliqs.zometric.com/.
- To find Nested GRR choose https://intelliqs.zometric.com/> Statistical module> Measurement System Analysis>Nested GRR.
- Inside the tool, feeds the data along with other inputs as follows:
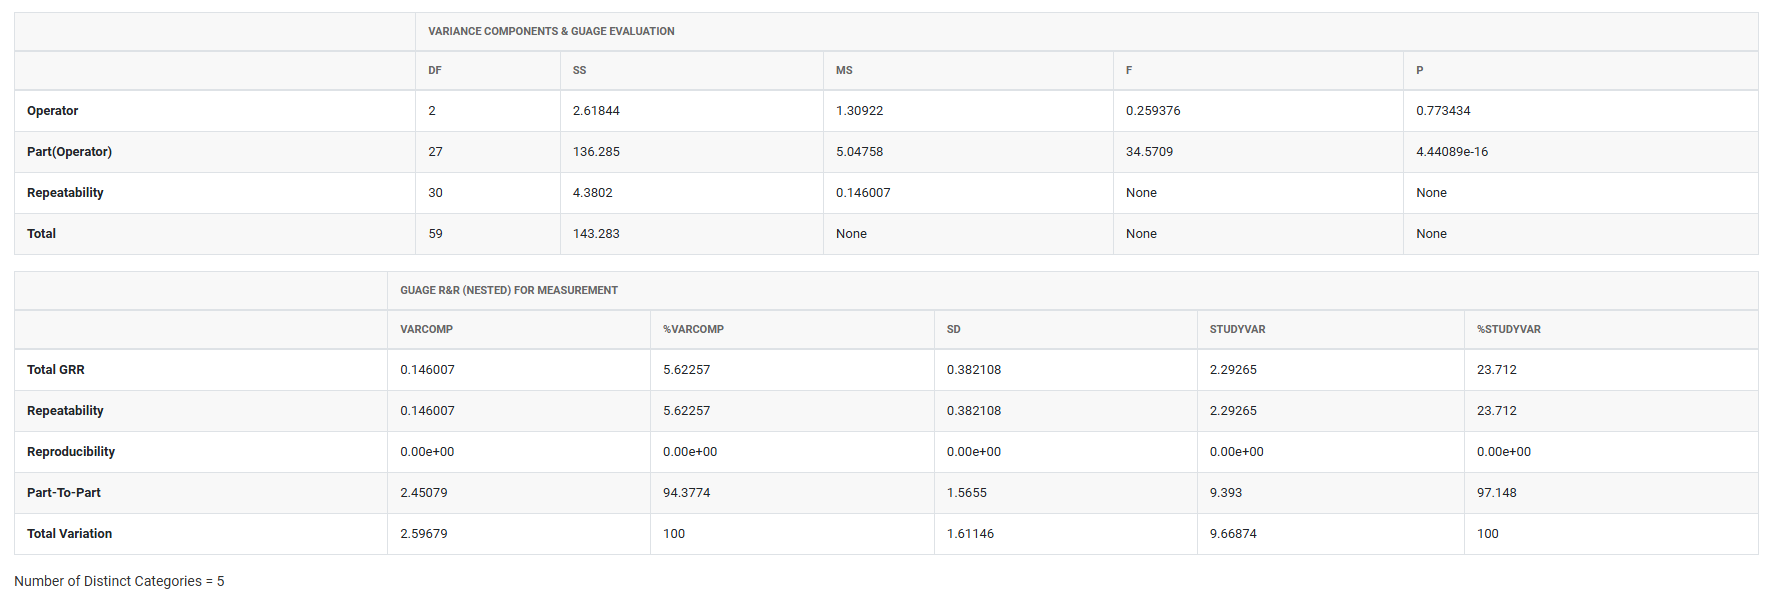
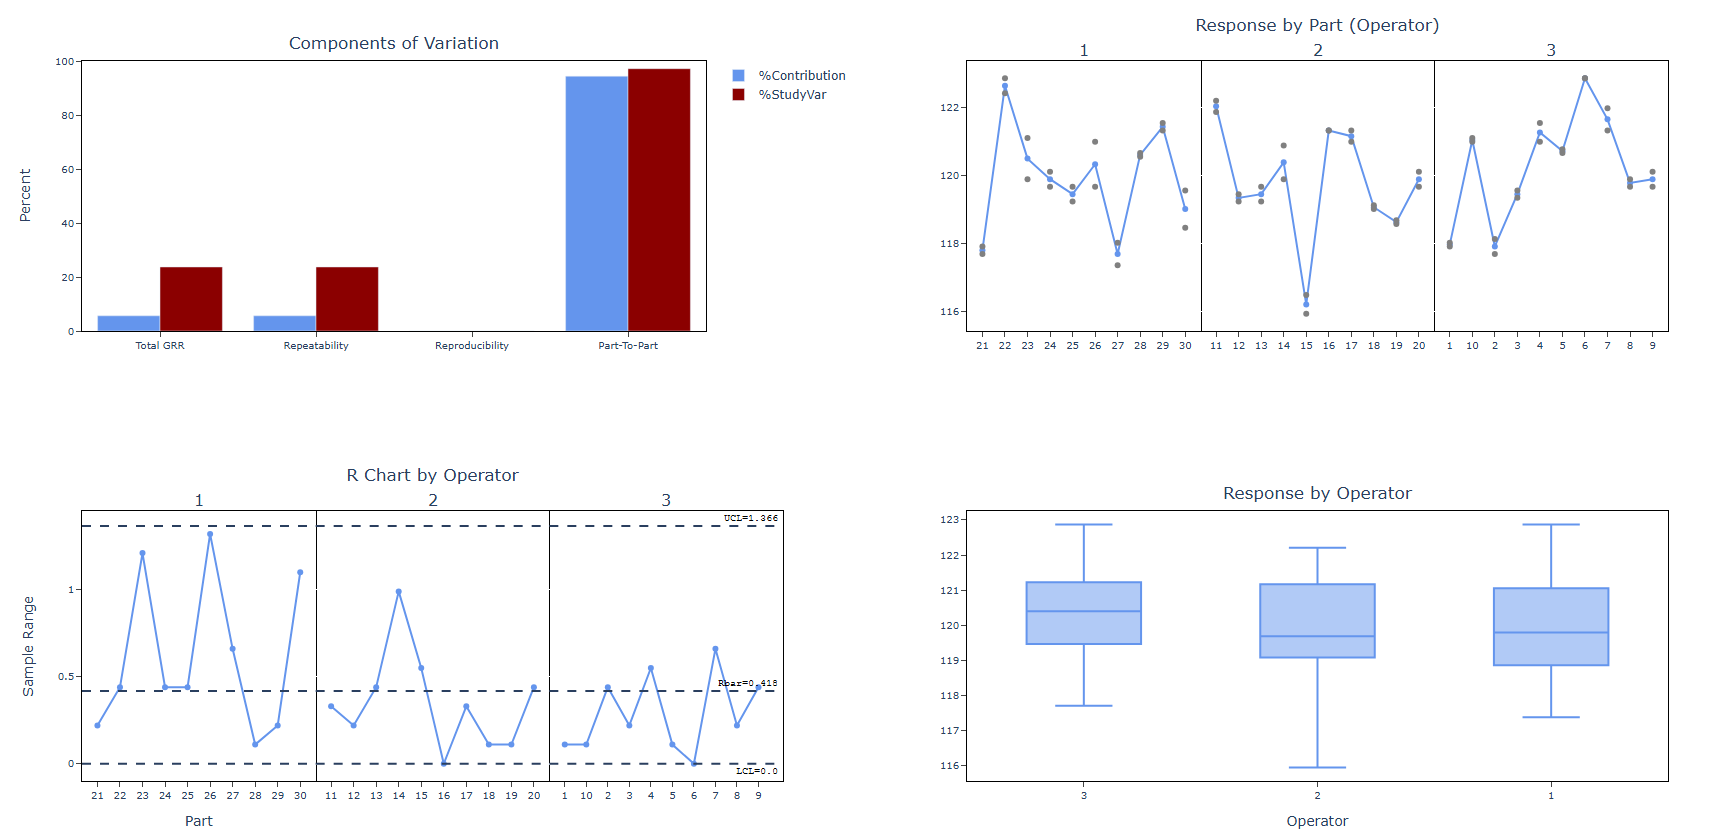
5. After using the above mentioned tool, fetches the output as follows:
How to do Nested GRR
The guide is as follows:
- Login in to QTools account with the help of https://qtools.zometric.com/ or https://intelliqs.zometric.com/
- On the home page, choose Statistical Tool> Measurement System Analysis >Nested GRR
- Next, update the data manually or can completely copy (Ctrl+C) the data from excel sheet and paste (Ctrl+V) it here.
- Fill the required options.
- Finally, click on calculate at the bottom of the page and you will get desired results.
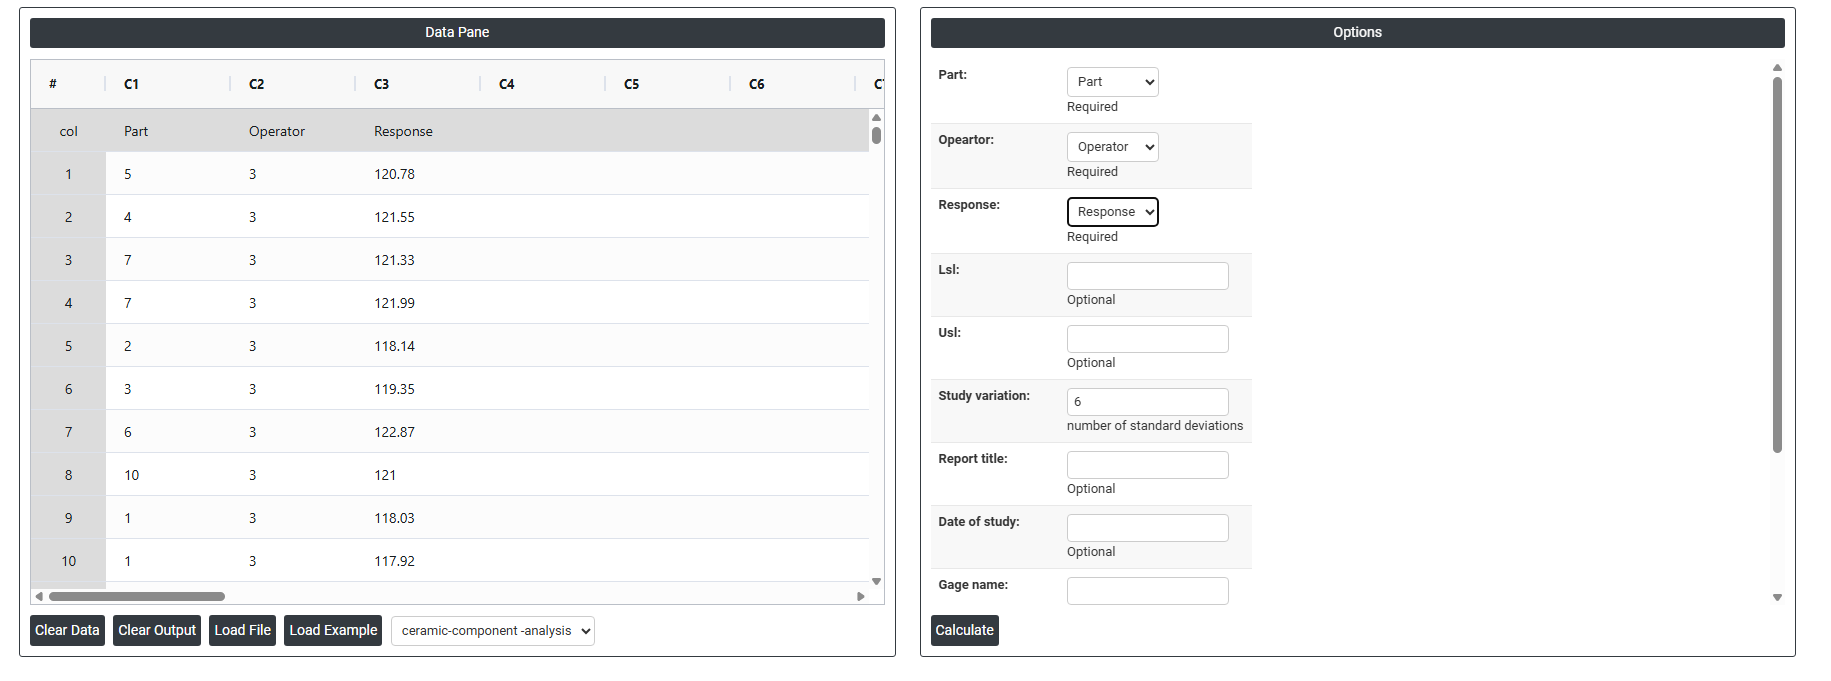
On the dashboard of Nested GRR, the window is separated into two parts.
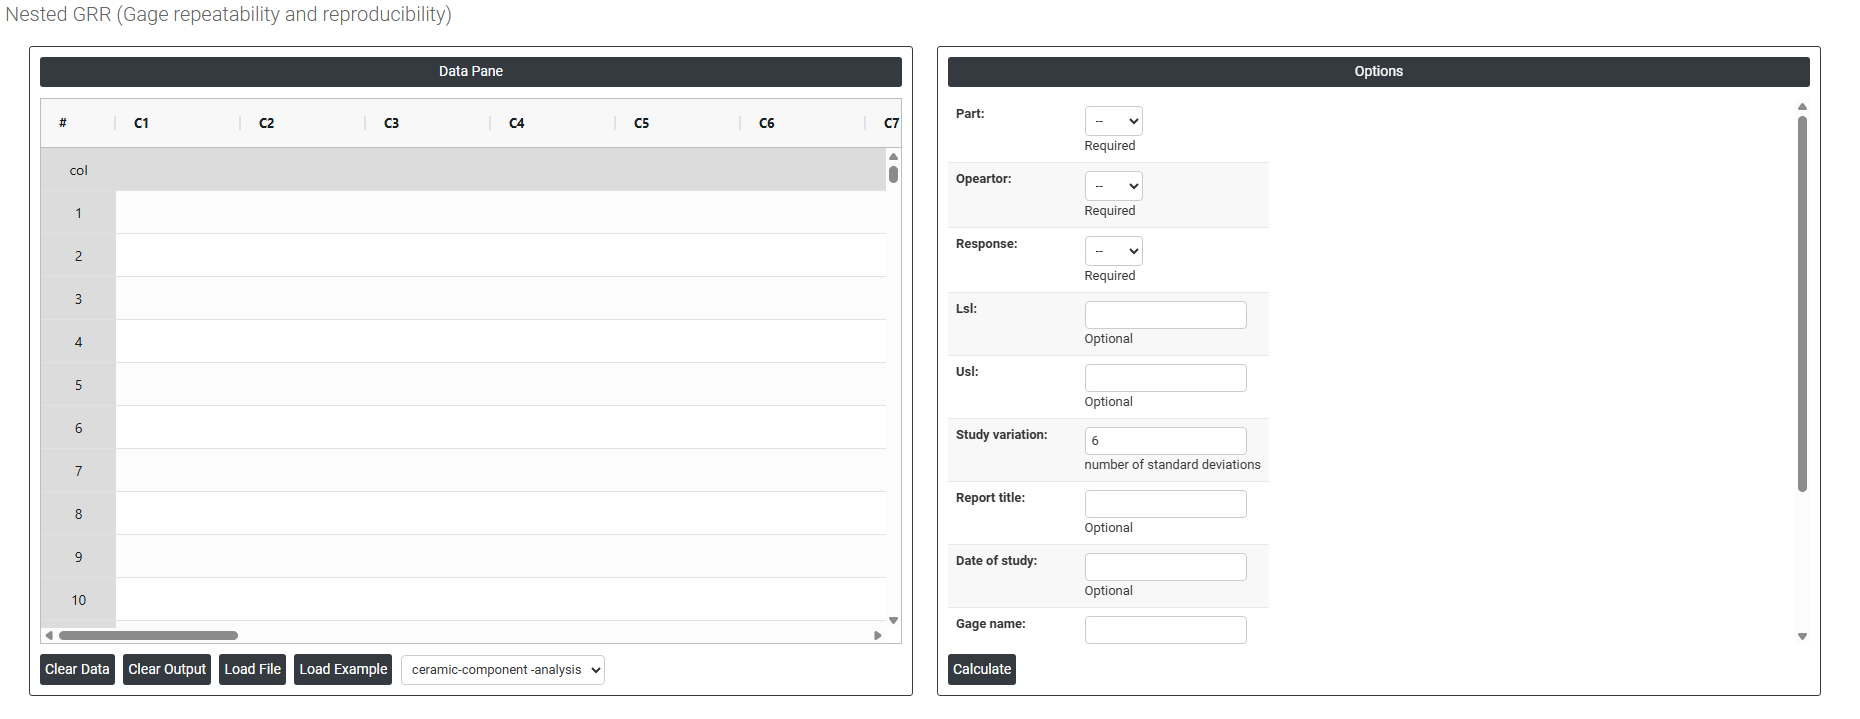
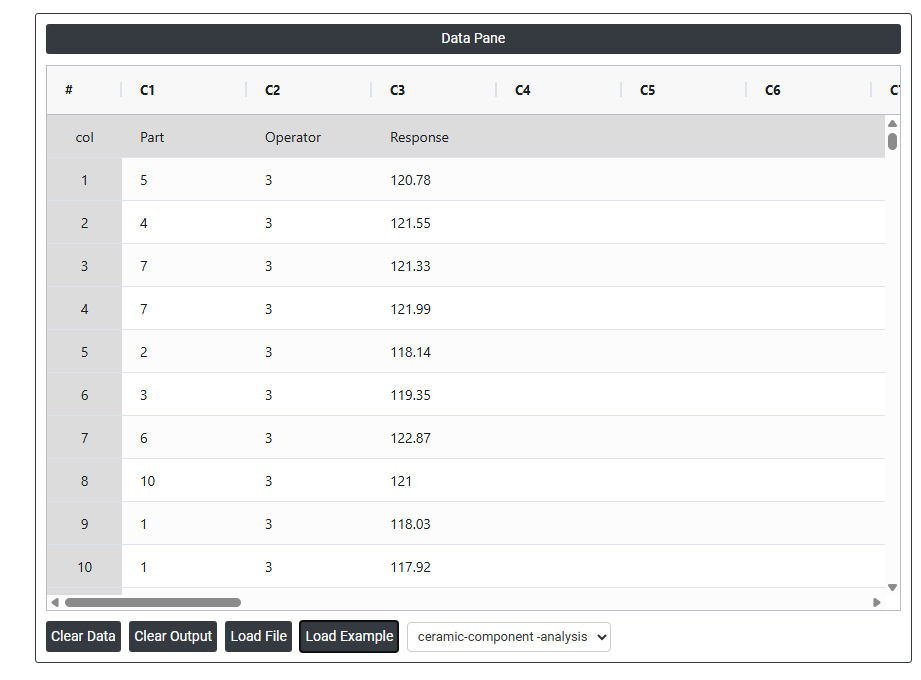
On the left part, Data Pane is present. In the Data Pane, each row makes one subgroup. Data can be fed manually or the one can completely copy (Ctrl+C) the data from excel sheet and paste (Ctrl+V) it here.
Load example: Sample data will be loaded.
Load File: It is used to directly load the excel data.
On the right part, there are many options present as follows:
- Part Select the column that identifies which part each measurement belongs to. This is a required field. In a nested design, each part is measured by only one operator so the part column must clearly distinguish between all parts across all operators. The analysis uses this column to estimate part-to-part variation within each operator's assigned set of parts.
- Operator Select the column that identifies which operator performed each measurement. This is a required field. Since each operator measures a unique set of parts in a nested design, this column is used to estimate reproducibility the variation attributable to differences between operators. Ensure operator labels are consistent throughout the column (e.g. do not mix "Op1" and "Operator 1" for the same person).
- Response Select the column containing the actual measurement values recorded during the study. This is a required field. These must be continuous numeric values — such as dimensions, weights, or test readings — recorded by each operator for their assigned parts. The response column is the core data from which all repeatability, reproducibility, and variation statistics are calculated.
- LSL (Lower Specification Limit) Optional. Enter the lower specification limit for the measured characteristic. When provided, the analysis uses this value to calculate the %Tolerance statistic — expressing measurement system variation as a percentage of the total specification width. This helps determine whether the gauge is capable of reliably distinguishing conforming from nonconforming parts.
- USL (Upper Specification Limit) Optional. Enter the upper specification limit for the measured characteristic. Used together with the LSL to define the total tolerance range. When both LSL and USL are provided, the %Tolerance statistic gives the most complete picture of whether the measurement system is fit for purpose relative to the specification.
- Study Variation (Number of Standard Deviations) Defines the multiplier used to calculate the study variation range from the estimated standard deviation. The default is 6, representing ±3 standard deviations and covering approximately 99.73% of the measurement distribution. This is the industry standard used in most Gage R&R studies. A value of 5.15 is sometimes used to represent 99% of the distribution — choose based on your industry standard or customer requirement.
- Report Title Optional. Enter a descriptive title for the study report — for example, "Calliper Gage R&R Study — Line 3". This appears as a header in the output and helps identify the study when reports are saved, shared, or reviewed at a later date.
- Date of Study Optional. Enter the date on which the study was conducted. Including the date is recommended for traceability, especially when multiple studies are conducted on the same gauge over time or when study results are included in quality documentation or regulatory submissions.
- Gage Name Optional. Enter the name, model, or identification number of the measurement instrument used in the study — for example, "Digital Calliper DC-200" or "Gauge ID: G-042". This ensures the study output is clearly linked to the specific instrument evaluated and supports calibration traceability.
- Reported By Optional. Enter the name of the person who conducted or is responsible for the study. This is useful for accountability and traceability, particularly in regulated industries where documented evidence of who performed each study is required.
- Remarks Optional. Enter any additional notes, observations, or contextual information relevant to the study — such as environmental conditions, any deviations from the standard procedure, or important context about the parts or operators involved. This field helps future reviewers understand the study conditions without needing to search for separate records.
- Download as Excel Exports the underlying data used to generate the main effects plot including the mean response values calculated at each factor level into an Excel file.