What is Normality test ?
When to use Normality test?
- Use before running t tests, ANOVA, regression, or capability analysis to confirm that the normality assumption is satisfied.
- Use when selecting the appropriate control chart or capability method — non-normal data requires different chart types or transformations.
- Use when validating a new dataset or process where the distribution shape is unknown.
- Use when deciding whether to apply a transformation (e.g. Box-Cox or Johnson) before further analysis.
Guidelines for correct usage of Normality test
- Collect at least 20 data points before running a normality test — very small samples lack the power to reliably detect non-normality.
- Use the Anderson-Darling test as the default — it is the most widely accepted method and gives greater weight to the tails of the distribution, which is where non-normality typically shows up.
- A p-value greater than 0.05 indicates insufficient evidence to reject normality — the data is consistent with a normal distribution.
- A p-value less than 0.05 indicates the data significantly departs from normality — consider transformation or a non-parametric method.
- Always review the probability plot alongside the p-value — a visual check reveals the nature and severity of any departure from normality.
- For large sample sizes (n > 100), the test becomes very sensitive to minor, practically insignificant deviations — always combine the p-value with a visual assessment.
Alternatives: When not to use Normality test
- If you already know the data is non-normal, skip the normality test and proceed directly to Individual Distribution Identification to find the best-fitting distribution.
- If your sample size is very small (fewer than 10), the normality test has very low power — consider collecting more data before drawing conclusions.
- If you are working with attribute data (counts or proportions), normality testing is not applicable — these data types follow binomial or Poisson distributions.
Example of Normality test
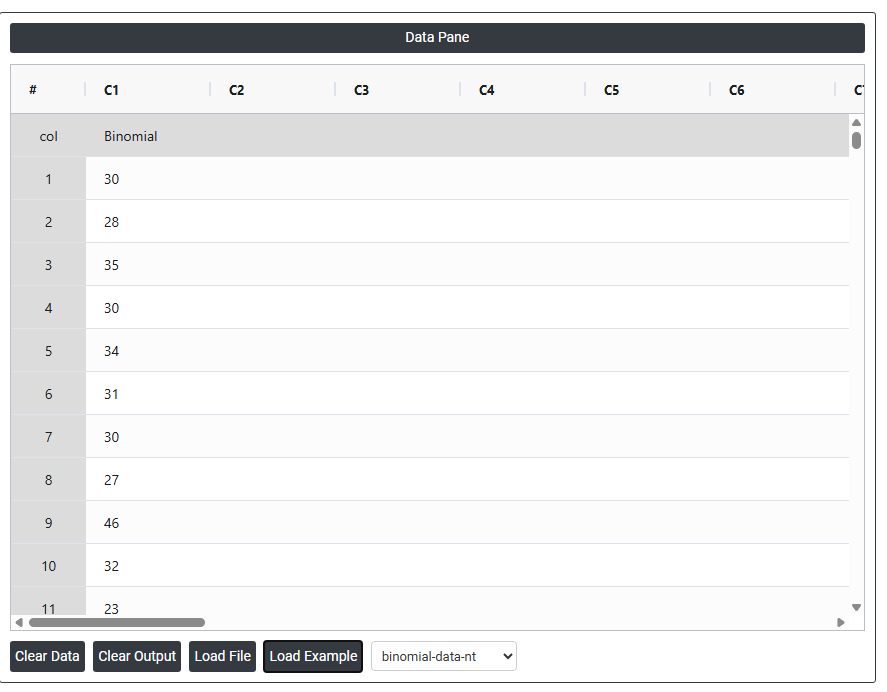
This is a random sample of data from a Binomial distribution. Let us do an anderson-darling normality test on this data. The test in following steps:
- Gathered the necessary data.
- Now analyses the data with the help of https://qtools.zometric.com/ or https://intelliqs.zometric.com/.
- To find Normality test choose https://intelliqs.zometric.com/> Statistical module> Hypothesis Test> Normality test.
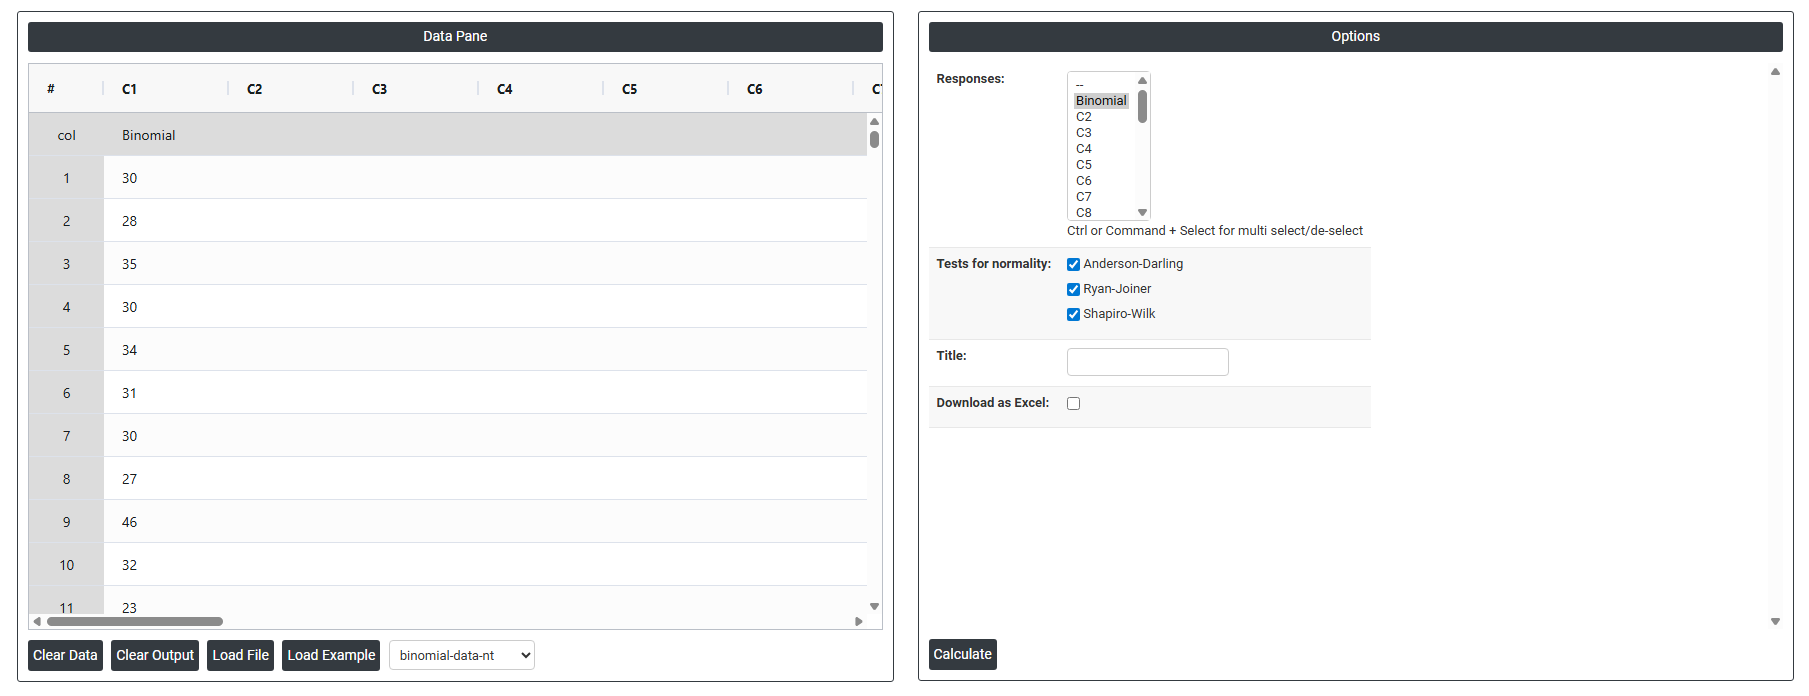
- Inside the tool, feeds the data along with other inputs as follows:
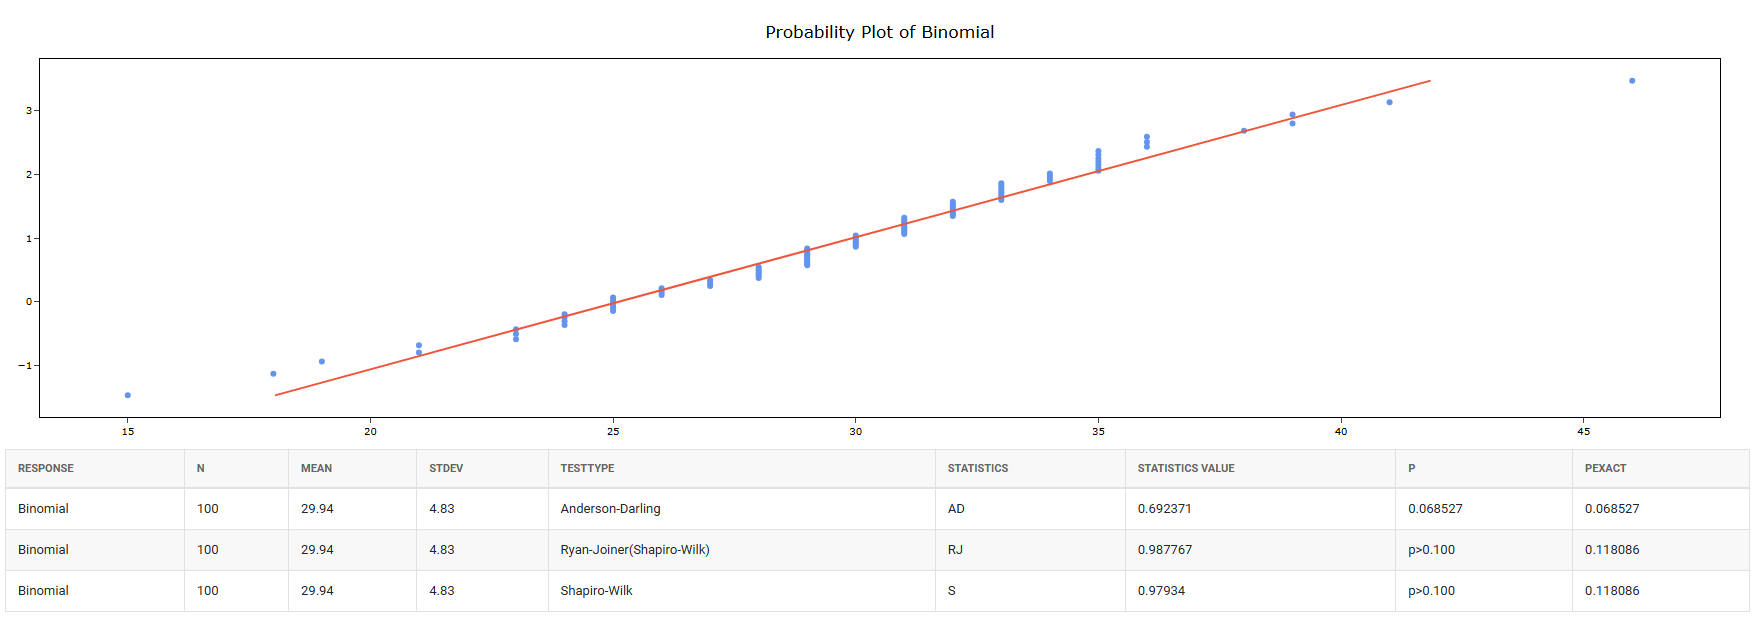
5. After using the above mentioned tool, fetches the output as follows:
How to do Normality test
The guide is as follows:
- Login in to QTools account with the help of https://qtools.zometric.com/ or https://intelliqs.zometric.com/
- On the home page, choose Statistical Tool> Hypothesis Test >Normality test .
- Next, update the data manually or can completely copy (Ctrl+C) the data from excel sheet and paste (Ctrl+V) it here.
- Fill the required options.
- Finally, click on calculate at the bottom of the page and you will get desired results.
On the dashboard of Normality test, the window is separated into two parts.
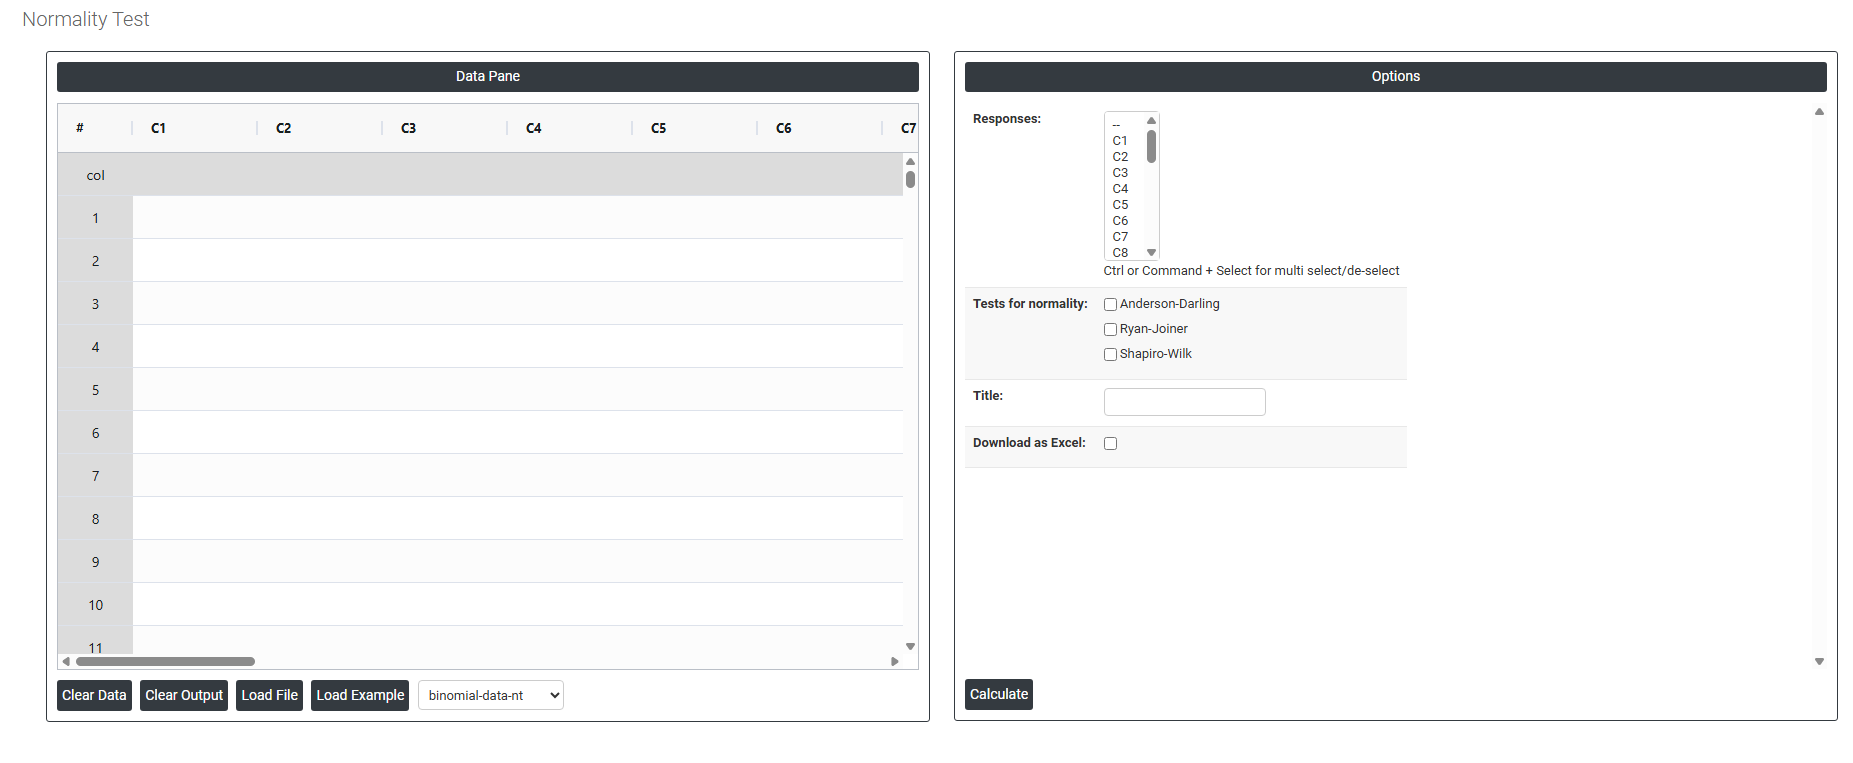
On the left part, Data Pane is present. In the Data Pane, each row makes one subgroup. Data can be fed manually or the one can completely copy (Ctrl+C) the data from excel sheet and paste (Ctrl+V) it here.
Load example: Sample data will be loaded.
Load File: It is used to directly load the excel data.
On the right part, there are many options present as follows:
- Responses Select the column(s) containing the continuous data you want to test for normality. Use Ctrl or Command + Click to select multiple columns if you want to test several variables at once. Each selected column is tested and plotted independently — the tool generates a separate probability plot and result for each variable selected.
- Tests for Normality Choose the statistical method used to assess whether the data follows a normal distribution. Three options are available — each uses a different mathematical approach but all produce a p-value and probability plot:
- Anderson-Darling — the most widely used and recommended default. It gives greater weight to the tails of the distribution, making it more sensitive to deviations that occur at the extremes of the data. Best for general-purpose normality testing across most industries and applications.
- Ryan-Joiner — similar in approach to the Shapiro-Wilk test, it measures how closely the data points follow a straight line on a normal probability plot. A good alternative when you want a correlation-based assessment of normality. Note that this method is an approximation of Shapiro-Wilk.
- Shapiro-Wilk — widely regarded as one of the most powerful normality tests, particularly for small sample sizes (fewer than 50 observations). It calculates a W statistic that measures how well the data fits a normal distribution and is the preferred choice when sample sizes are small and precision matters.
- Title Allows you to enter a custom title that will appear at the top of the probability plot output. This is useful for labelling the chart with the variable name, product, study reference, or date — making it easier to identify and present the result in reports or documentation.
- Download as Excel Exports the normality test results, including the test statistic, p-value, and summary statistics, into an Excel file for reporting, sharing with colleagues, or maintaining a formal record of the analysis.