What is One Sample Sign ?
The One-Sample Sign Test determines whether the median of a single sample is statistically equal to a specified target value. It works by counting how many observations fall above and how many fall below the target considering only the sign (direction) of each difference, not its size. It is the simplest nonparametric test for a single sample, requiring no assumptions about distribution shape.
Simple Definitions:A simple test that checks whether the median of your data matches a target value, by counting how many measurements fall above versus below that target.
When to use One Sample Sign?
- Use when testing whether a single sample median equals a specified target.
- Use when data is not normally distributed and symmetry cannot be assumed.
- Use when significant outliers make mean-based tests unreliable.
- Use when only direction of difference matters, not the magnitude.
- Use on ordinal data where exact numerical differences are not meaningful.
Guidelines for correct usage of One Sample Sign
- Specify a meaningful target median before collecting data not based on the data itself.
- Observations exactly equal to the target are excluded many ties reduce test reliability.
- Collect at least 10 observations the sign test has low power with small samples.
- A non-significant result does not confirm the median equals the target only that insufficient evidence was found to reject it.
Alternatives: When not to use One Sample Sign
- If data is approximately symmetric but non-normal, use One-Sample Wilcoxon Test more powerful as it uses magnitude.
- If data is normally distributed, use One-Sample T-Test
- If comparing two independent groups, use Mann-Whitney Test
- If comparing three or more groups, use Kruskal-Wallis Test
Example of One Sample Sign
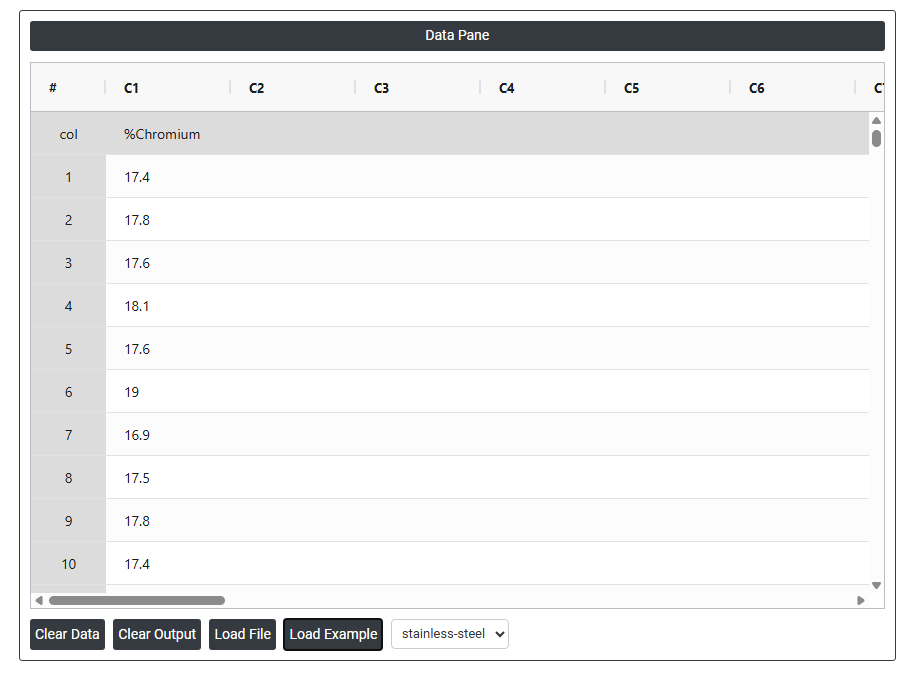
A metallurgical engineer is investigating whether the typical chromium level in stainless steel is 18%. To study this, the engineer takes 12 random samples, measures their chromium content, and applies a one-sample sign test to check if the median differs from 18%. The following steps:
- Gathered the necessary data.
- Now analyses the data with the help of https://qtools.zometric.com/ or https://intelliqs.zometric.com/.
- To find One Sample Sign choose https://intelliqs.zometric.com/> Statistical module> Nonparametric > One Sample Sign.
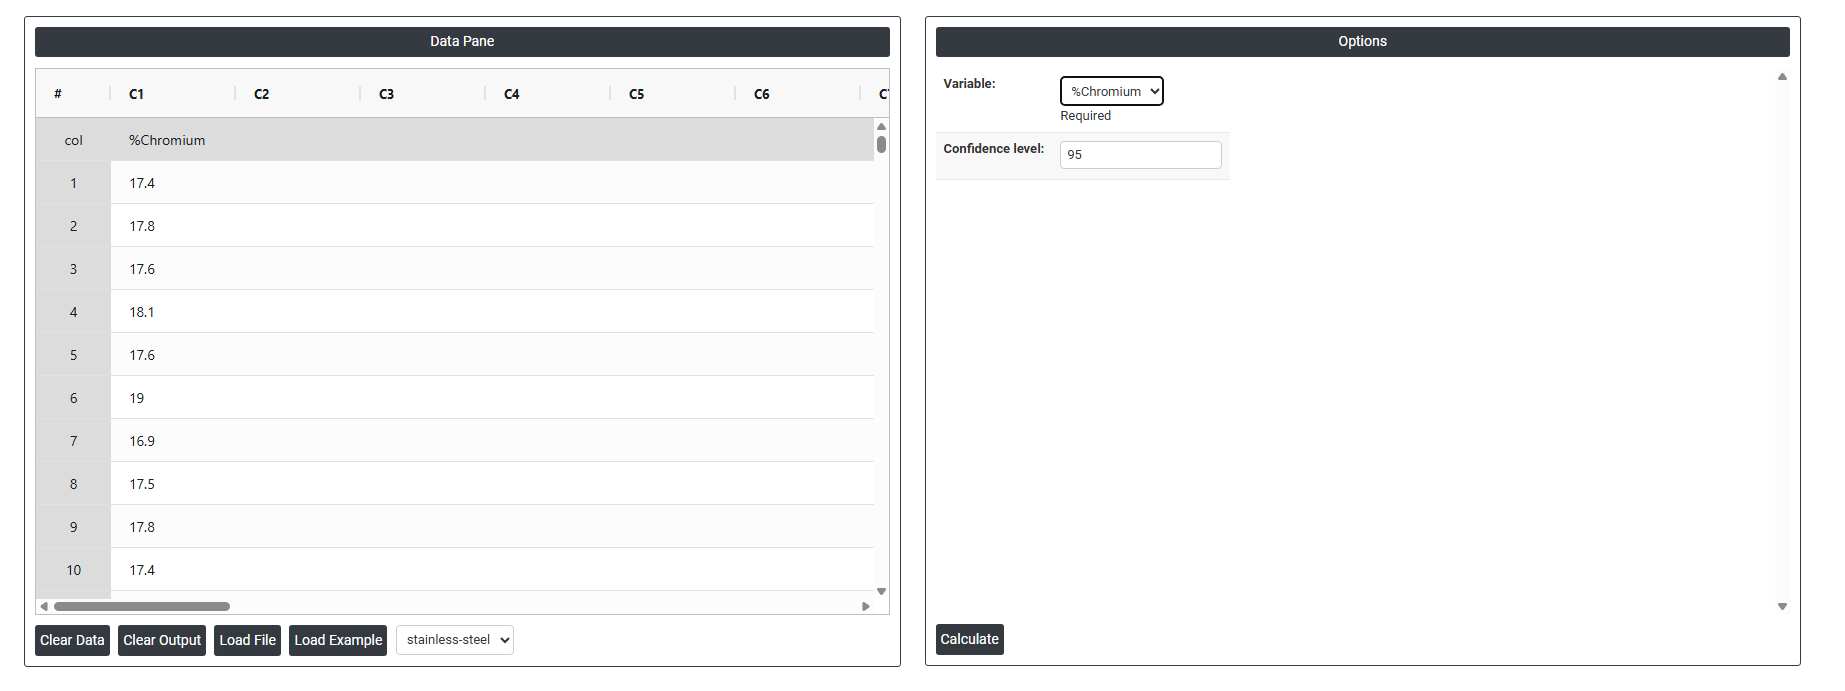
- Inside the tool, feeds the data along with other inputs as follows:
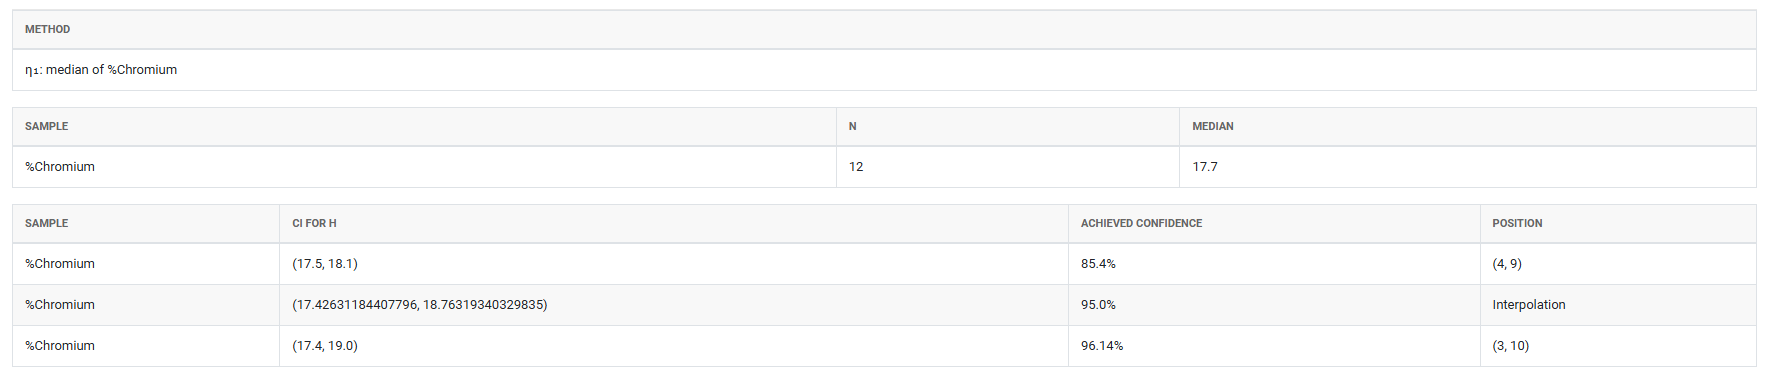
5. After using the above mentioned tool, fetches the output as follows:
How to do Fried Man
The guide is as follows:
- Login in to QTools account with the help of https://qtools.zometric.com/ or https://intelliqs.zometric.com/
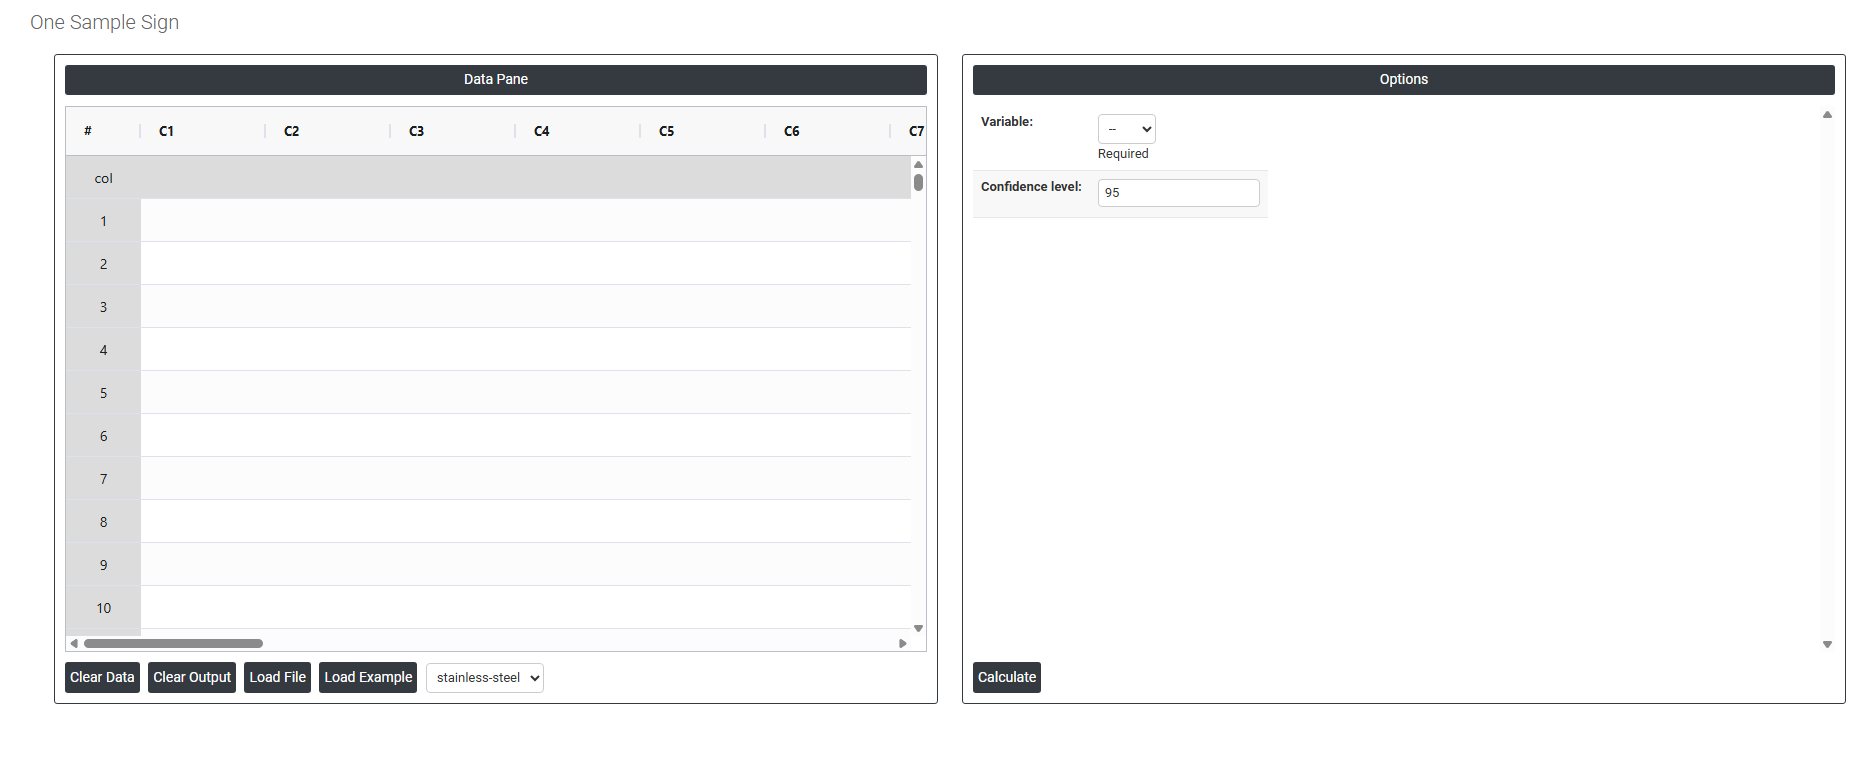
- On the home page, choose Statistical Tool> Nonparametric>One Sample Sign.
- Next, update the data manually or can completely copy (Ctrl+C) the data from excel sheet and paste (Ctrl+V) it here.
- Next, you need to fill the required options.
- Finally, click on calculate at the bottom of the page and you will get desired results.
On the dashboard of One Sample Sign, the window is separated into two parts.
On the left part, Data Pane is present. In the Data Pane, each row makes one subgroup. Data can be fed manually or the one can completely copy (Ctrl+C) the data from excel sheet and paste (Ctrl+V) it here.
Load example: Sample data will be loaded.
Load File: It is used to directly load the excel data.
On the right part, there are many options present as follows:
- Variable (Required): Select the column containing your measurement data for example, %Chromium in this case. This is the single sample you want to test. The test will analyse the values in this column to determine whether the sample median is statistically equal to the target value you specify. The variable must be continuous or ordinal.
- Confidence Level (Default 95%): Sets the certainty level for the confidence interval calculated around the sample median. The default of 95% means you are 95% confident that the true population median falls within the reported interval. It is set at 95% by default because it is the universally accepted standard in statistical analysis it balances being cautious enough to draw reliable conclusions while remaining practical for real-world use. A lower confidence level (e.g. 90%) produces a narrower interval but with less certainty; a higher level (e.g. 99%) produces a wider interval with greater certainty but requires stronger evidence to detect a significant difference.