What is One Sample Wilcoxon?
The One-Sample Wilcoxon Signed-Rank Test determines whether the median of a single sample equals a specified target value. Unlike the Sign Test which only considers direction, the Wilcoxon test also uses the magnitude of each difference — ranking the absolute differences and assigning signs based on direction. This makes it significantly more powerful at detecting true departures from the target.
Simple Definitions:A more powerful version of the Sign Test that checks whether the sample median matches a target, using both direction and size of each difference for a more sensitive and reliable result.
When to use One Sample Wilcoxon?
- Use when testing whether a single sample median equals a specified target and data is approximately symmetric but not normal.
- Use as a more powerful alternative to the One-Sample Sign Test when symmetry around the median is a reasonable assumption.
- Use when the data is continuous and not normally distributed with no severe skewness.
- Use when both direction and magnitude of differences from the target are meaningful.
Guidelines for correct usage of One Sample Wilcoxon
- The distribution of differences from the target should be approximately symmetric the Wilcoxon test assumes symmetry even if the original data is not normal.
- Observations exactly equal to the target are excluded many ties reduce reliability.
- Collect at least 10 to 15 observations for adequate statistical power.
- Define the target median before data collection to avoid biasing the test selection.
Alternatives: When not to use One Sample Wilcoxon
- If data is normally distributed, use One-Sample T-Test
- If data is heavily skewed or contains many outliers, use One-Sample Sign Test it does not assume symmetry.
- If comparing two independent groups, use Mann-Whitney Test
- If analysing paired measurements (before/after), compute the differences first, then apply this test to those differences.
Example of One Sample Wilcoxon
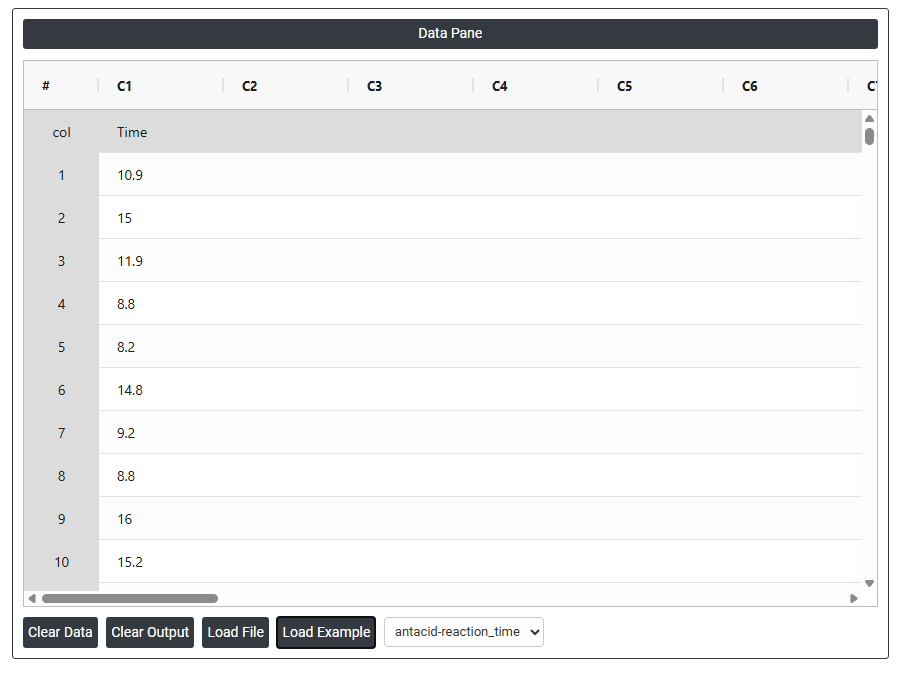
A pharmaceutical researcher wants to test whether the median reaction time of a newly formulated antacid is shorter than 12 minutes. Sixteen samples of the antacid are prepared, and the reaction time of each sample is recorded. The following steps:
- Gathered the necessary data.
- Now analyses the data with the help of https://qtools.zometric.com/ or https://intelliqs.zometric.com/.
- To find One Sample Wilcoxon choose https://intelliqs.zometric.com/> Statistical module> Nonparametric > One Sample Wilcoxon.
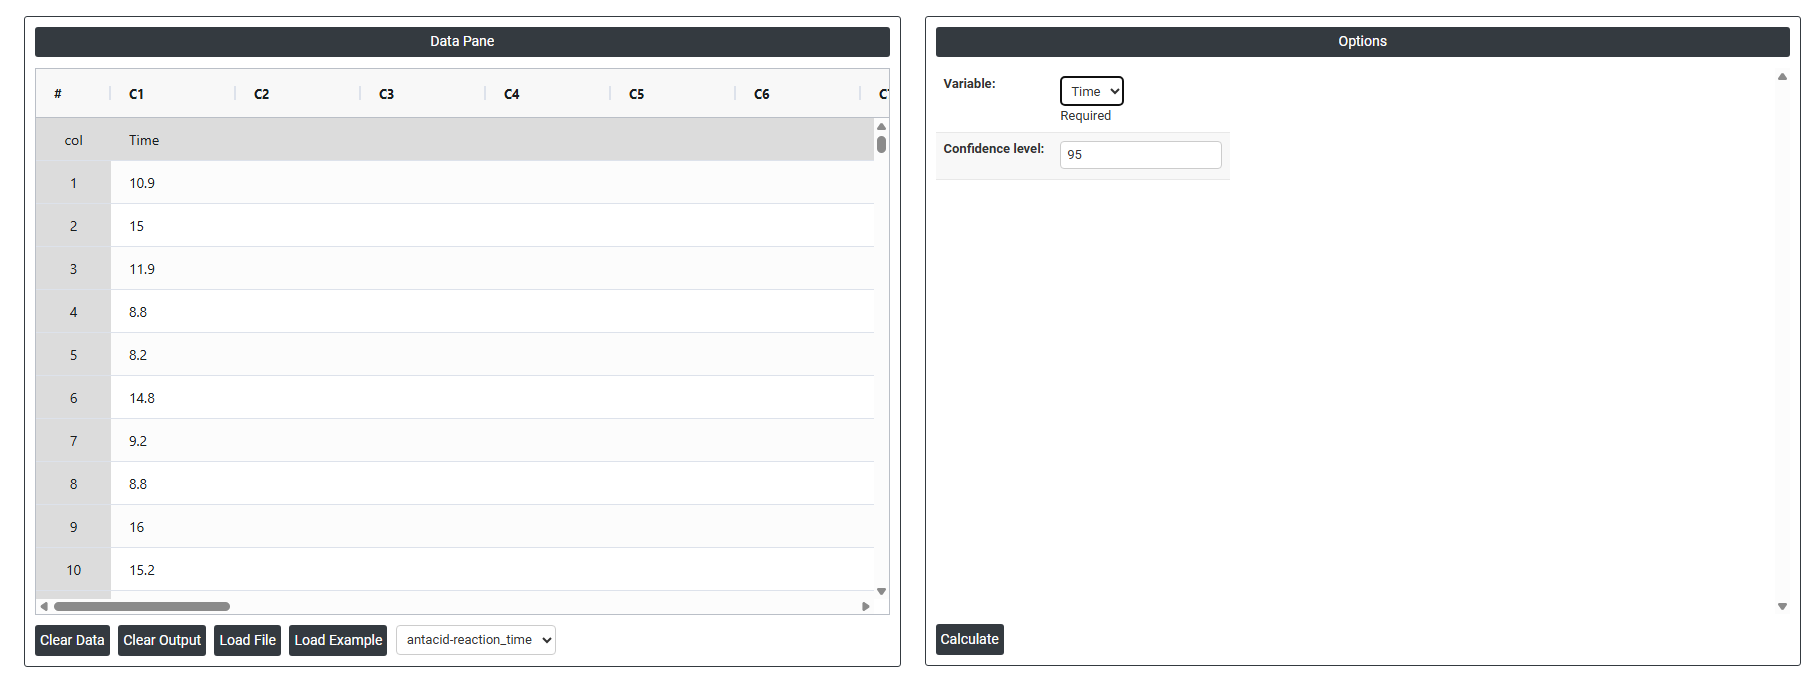
- Inside the tool, feeds the data along with other inputs as follows:
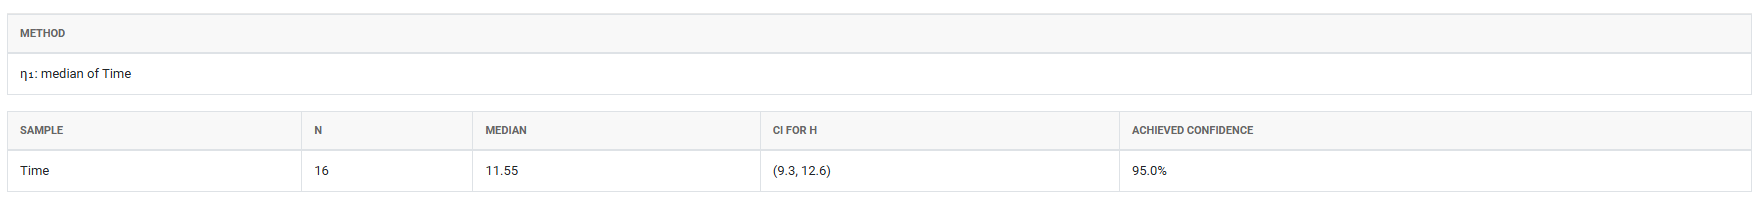
5. After using the above mentioned tool, fetches the output as follows:
How to do One Sample Wilcoxon
The guide is as follows:
- Login in to QTools account with the help of https://qtools.zometric.com/ or https://intelliqs.zometric.com/
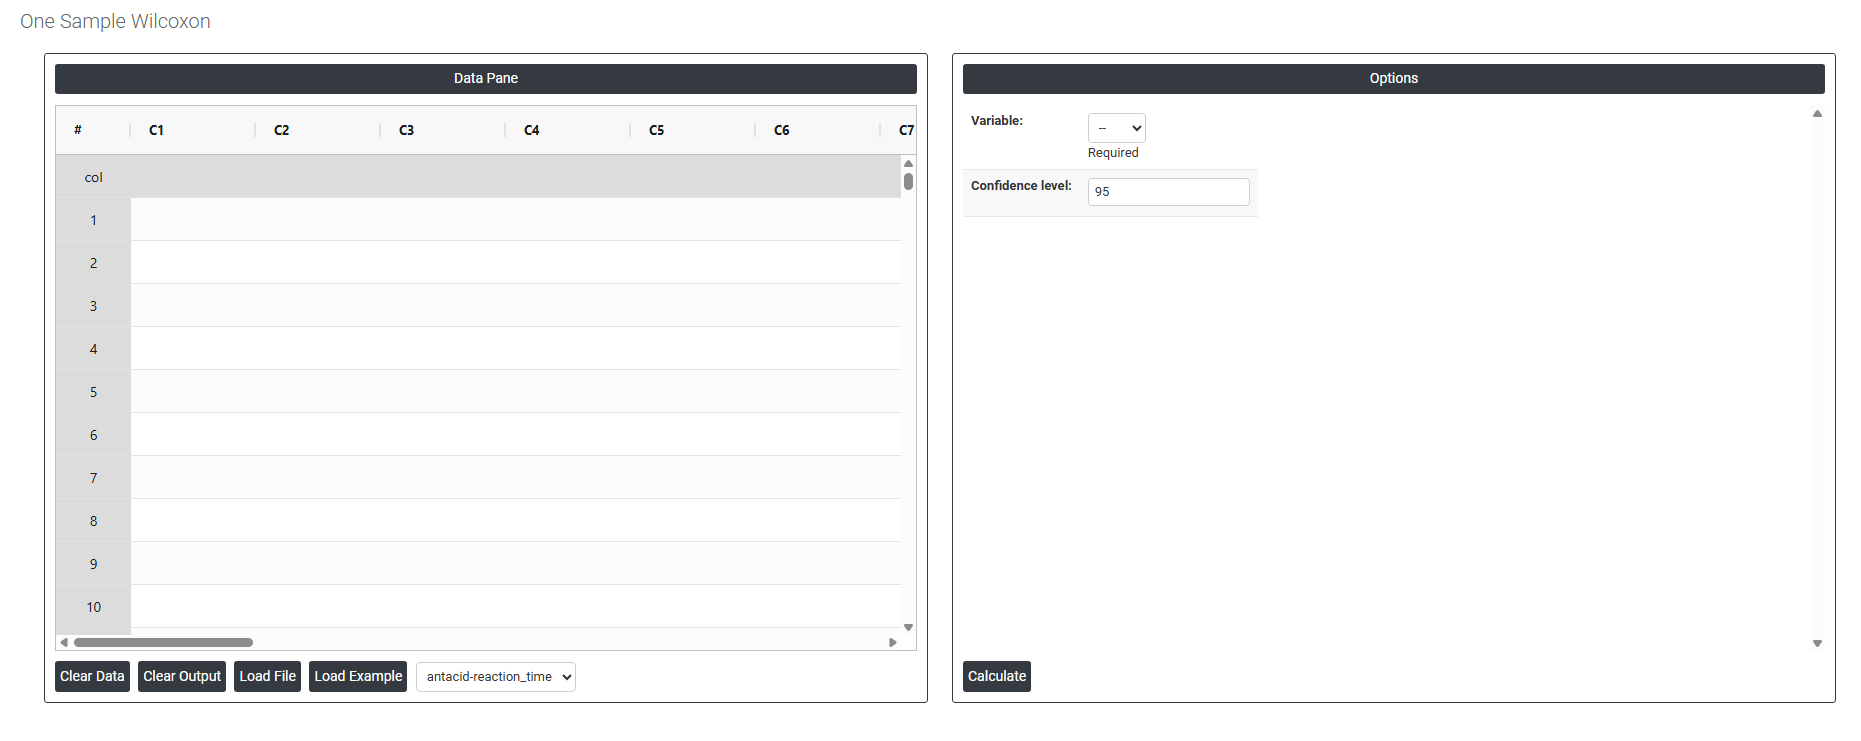
- On the home page, choose Statistical Tool> Nonparametric>One Sample Wilcoxon.
- Next, update the data manually or can completely copy (Ctrl+C) the data from excel sheet and paste (Ctrl+V) it here.
- Next, you need to fill the required options.
- Finally, click on calculate at the bottom of the page and you will get desired results.
On the dashboard of One Sample Wilcoxon, the window is separated into two parts.
On the left part, Data Pane is present. In the Data Pane, each row makes one subgroup. Data can be fed manually or the one can completely copy (Ctrl+C) the data from excel sheet and paste (Ctrl+V) it here.
Load example: Sample data will be loaded.
Load File: It is used to directly load the excel data.
On the right part, there are many options present as follows:
- Variable (Required): Select the column containing your measurement data for example, time, weight, or any continuous quality characteristic. This is the single sample you want to test against a specified target median. The column must contain continuous numeric values and should have no meaningful grouping or pairing structure.
- Confidence Level (Default 95%): Sets the confidence level for the interval estimate of the population median. The default of 95% means you are 95% confident that the true population median falls within the calculated confidence interval. It is set at 95% by default because it is the widely accepted standard in statistical analysis — balancing sufficient certainty with a practical interval width. A higher confidence level (e.g. 99%) produces a wider interval with greater certainty; a lower level (e.g. 90%) produces a narrower interval but with less confidence that the true median is captured.