
One sample z-test
A one-sample z-test is a fundamental procedure in inferential statistics used to determine if the mean of a sample is significantly different from a known population mean. This parametric test is applicable when the population standard deviation is known and the sample size is 30 or greater, ensuring the data follows a normal distribution with independent data points.
Last reviewed
Key takeaway
A one-sample z-test is a fundamental procedure in inferential statistics used to determine if the mean of a sample is significantly different from a known population mean.
On this page
What is One Sample z-test?
A one-sample z-test is a fundamental procedure in inferential statistics used to determine if the mean of a sample is significantly different from a known population mean. This parametric test is applicable when the population standard deviation is known and the sample size is 30 or greater, ensuring the data follows a normal distribution with independent data points. It is versatile, being applicable to one sample, two samples, or proportions in hypothesis testing. The z-test can be classified into left-tailed, right-tailed, and two-tailed tests based on the nature of the data and the hypothesis being tested. The test involves comparing the sample mean to the population mean using the standard normal distribution to compute critical values.
The one-sample z-test assesses whether the sample mean is significantly greater than, less than, or not equal to the population mean. The null hypothesis states that there is no significant difference between the sample mean and the population mean. The test statistic is calculated and compared to critical values; if it falls in the critical region, the null hypothesis is rejected.
When to use One Sample z-test?
It is generally used when you have a single sample and want to compare it to a known population value.
Conditions for Using a One-Sample Z-Test:
- Known Population Standard Deviation: The population standard deviation (σ\sigmaσ) must be known.
- Sample Size (n≥30n \geq 30n≥30): The sample size should be 30 or larger.
- Normal Distribution: The underlying population from which the sample is drawn should follow a normal distribution, especially for smaller sample sizes (less than 30). However, with larger sample sizes, the z-test is robust to non-normality.
- Independent Data Points: The data points in the sample must be independent of each other. This means the value of one data point does not influence the value of another.
Here are some scenarios where you might want to use a one sample z-test:
- Quality control: A factory produces widgets, and you want to know if the weight of the widgets is consistent with the specification of the customer. In this case, you can take a sample of widgets, measure their weight, and compare it to the customer's specification.
- Medical research: A new drug has been developed to lower blood pressure, and you want to know if it is effective. You can take a sample of patients with high blood pressure, give them the drug, and measure their blood pressure after a certain period of time. You can then compare the average blood pressure of the sample to the population mean.
- Customer satisfaction: A company wants to know if its customers are satisfied with its products. In this case, the company can take a random sample of customers and ask them to rate their satisfaction on a scale of 1 to 10. The company can then compare the average satisfaction score of the sample to the population mean.
Guidelines for correct usage of One sample z-test
- Use One sample z if the population standard deviation is known
- Use continuous data for analysis, such as weights of packages
- Use One sample Poisson Rate for count data and One Proportion for pass/fail type data
- Sample size should be greater than 20 and data should not be severely skewed
- Select the sample data randomly and ensure each observation is independent
- Determine an appropriate sample size to ensure precise estimates and narrow confidence intervals, and protection errors.
Alternatives: When not to use One sample z-test
In case you are unaware of the population's standard deviation, you should utilize the One sample t-test.
Example of One sample z-test?
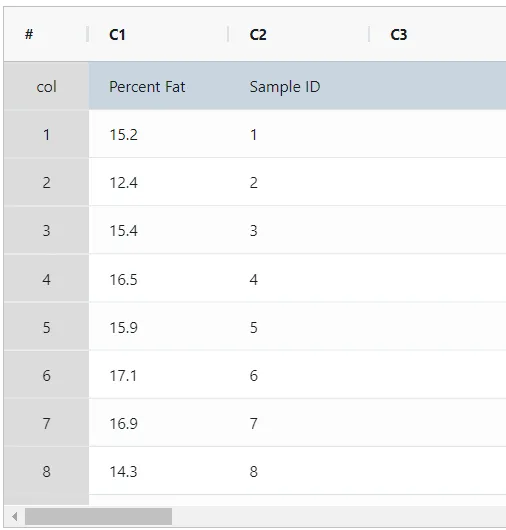
A scientist for a company that manufactures processed food wants to assess the percentage of fat in the company's bottled sauce. The advertised percentage is 15%. The scientist measures the percentage of fat in 20 random samples. Previous measurements found that the population standard deviation is 2.6%. The scientist performs a One sample z-test to determine whether the fat percentage differs from 15%. The following steps:
- Gathered the necessary data.
- Now analyses the data with the help of https://qtools.zometric.com/ or https://intelliqs.zometric.com/.
- To find One sample z-test choose https://intelliqs.zometric.com/> Statistical module> Graphical analysis> One sample z-test.
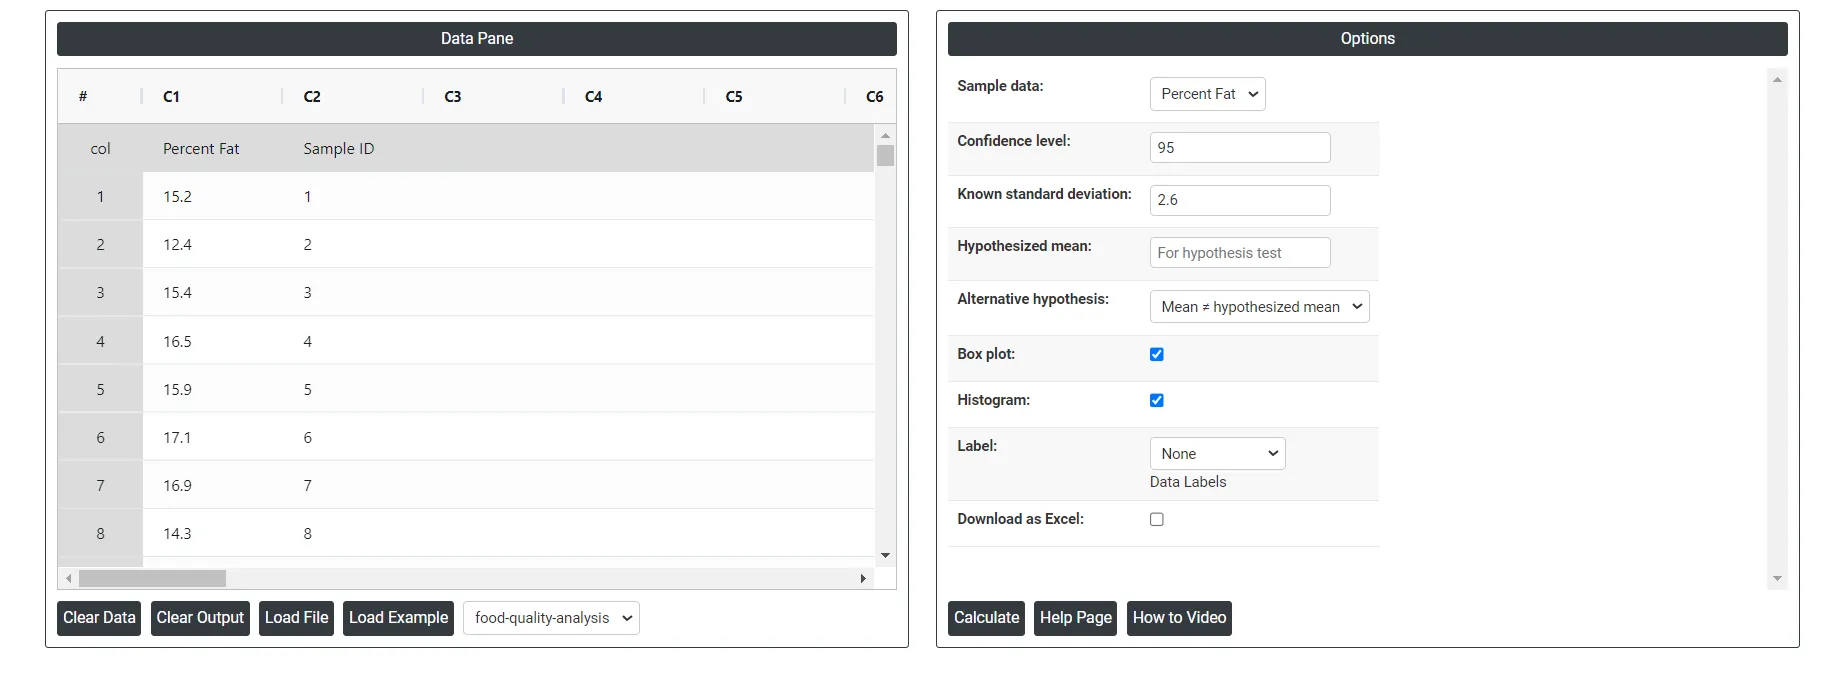
- Inside the tool, feeds the data along with other inputs as follows:
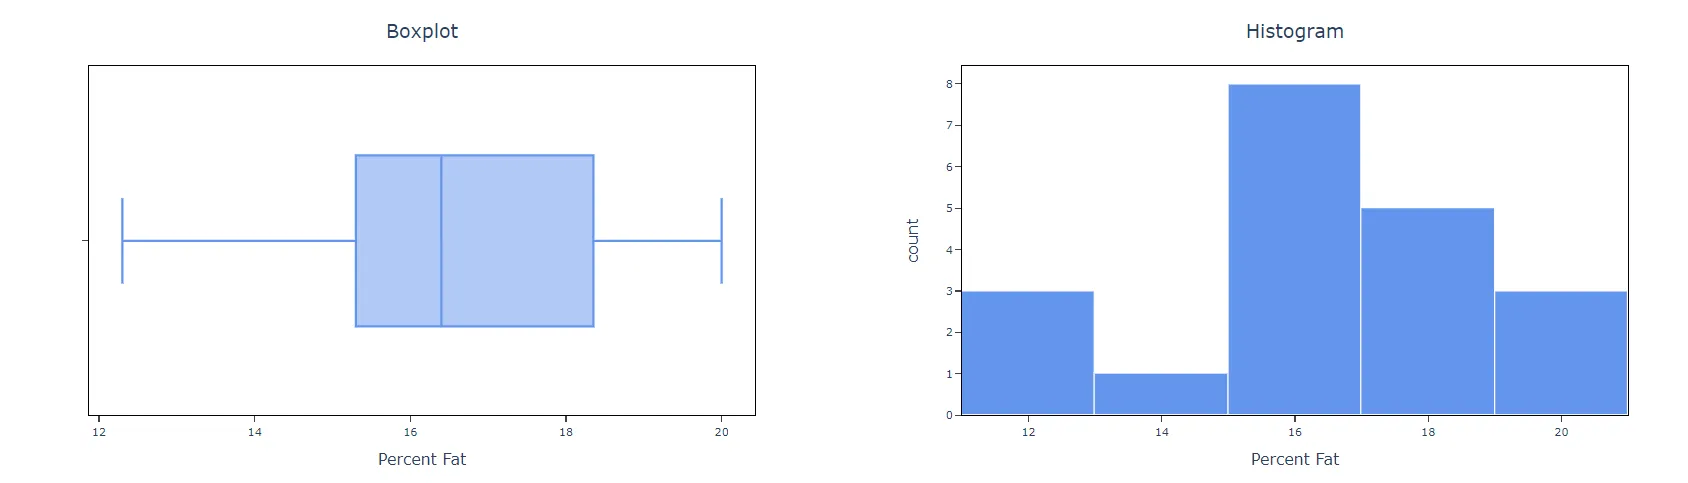
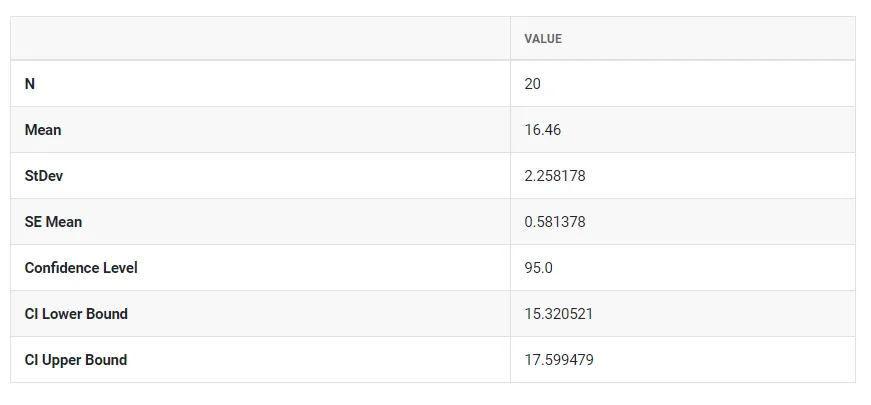
- After using the above mentioned tool, fetches the output as follows:
How to do One sample z-test
The guide is as follows:
- Login in to QTools account with the help of https://qtools.zometric.com/or https://intelliqs.zometric.com/
- On the home page, choose Statistical Tool> Graphical analysis >One sample z-test .
- Click on One sample z-test and reach the dashboard.
- Next, update the data manually or can completely copy (Ctrl+C) the data from excel sheet and paste (Ctrl+V) it here.
- Next, you need to put the values of confidence level, known standard deviation and hypothesized mean.
- Finally, click on calculate at the bottom of the page and you will get desired results.
On the dashboard of One sample z-test, the window is separated into two parts.
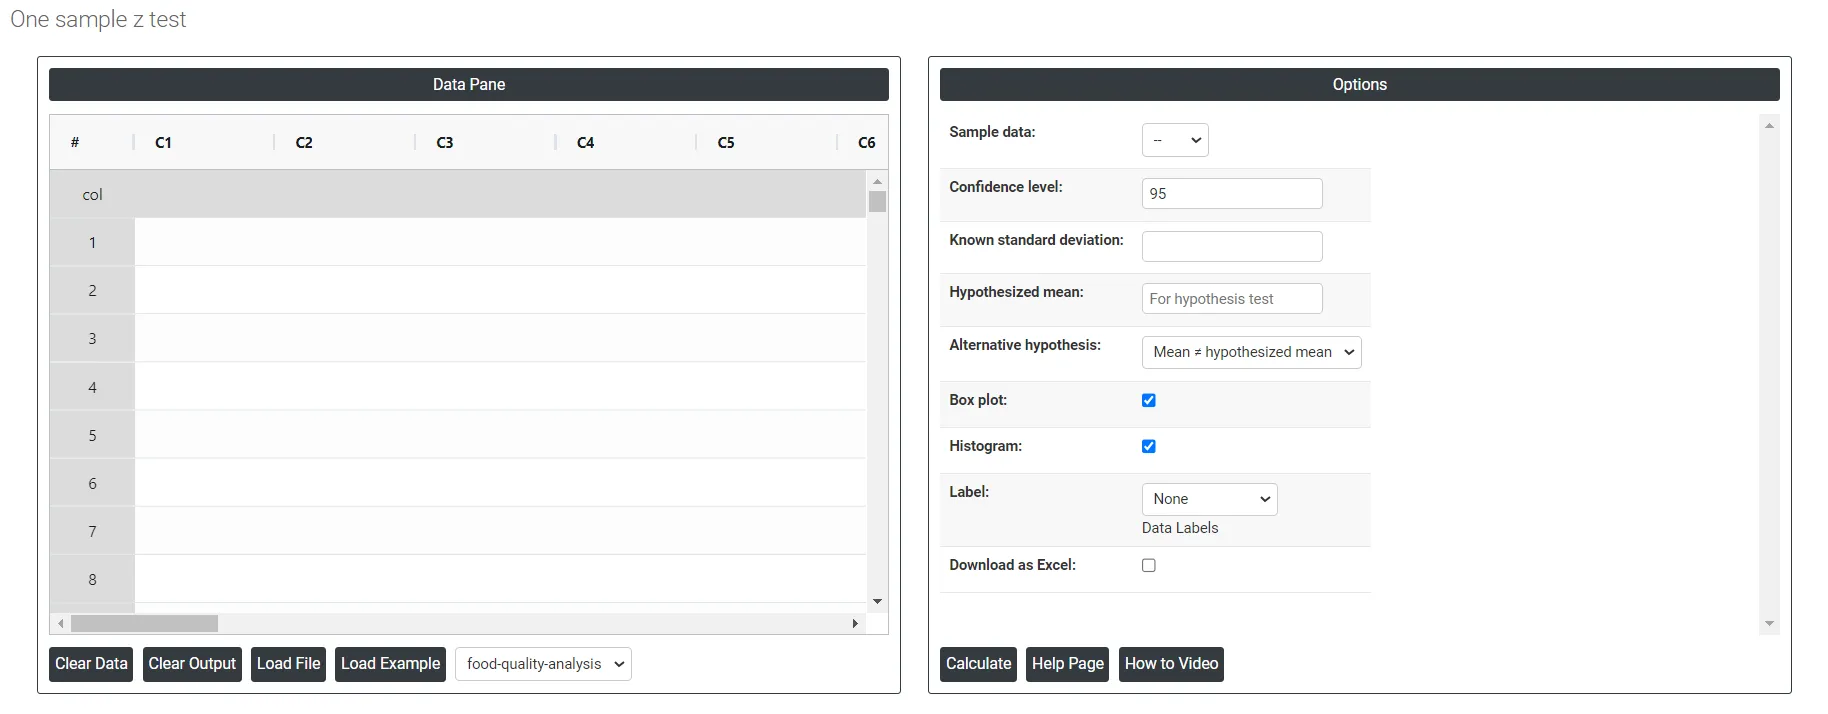
On the left part, Data Pane is present. In the Data Pane, each row makes one subgroup. Data can be fed manually or the one can completely copy (Ctrl+C) the data from excel sheet and paste (Ctrl+V) it here.
Load example: Sample data will be loaded.
Load File: It is used to directly load the excel data.
On the right part, there are many options present as follows:
- Confidence level: In hypothesis testing, the confidence level represents the degree of certainty or level of confidence that we have in our statistical analysis. It is a probability value that indicates the likelihood that the true population parameter falls within the specified range of values.Typically, the confidence level is expressed as a percentage and is denoted by (1 - α), where α is the level of significance or the probability of rejecting a true null hypothesis. For example, if we have a confidence level of 95%, then we are saying that we are 95% confident that the true population parameter lies within our interval estimate, and there is a 5% chance of making a type I error (rejecting a true null hypothesis). In practical terms, a higher confidence level means that we are more confident in our statistical analysis and results. However, increasing the confidence level also increases the width of the confidence interval, making it more difficult to detect small effects. Therefore, the choice of the confidence level depends on the context of the study and the goals of the researcher.
- Known standard deviation: In hypothesis testing, the standard deviation is a measure of the spread of a set of data around its mean. It is used in conjunction with the sample mean to calculate the test statistic, which is then used to determine the p-value of a hypothesis test. The standard deviation of a sample is denoted by the symbol s, and it is calculated as the square root of the sample variance. The sample variance is the average of the squared differences of each observation from the sample mean. In hypothesis testing, the standard deviation is used to determine the significance of the difference between the observed sample mean and the expected population mean under the null hypothesis. Specifically, the test statistic (usually denoted by t) is calculated as the difference between the sample mean and the population mean (assumed under the null hypothesis), divided by the standard error of the mean (which is equal to the standard deviation of the sample divided by the square root of the sample size).
- Hypothesized mean: The hypothesized mean, also known as the expected mean or population mean, is a value specified in the null hypothesis that represents the average value of the variable being tested. It is a theoretical value that is used to compare the actual sample mean to determine whether the difference is statistically significant or due to chance.
- Alternative hypothesis: In hypothesis testing, the alternative hypothesis (also called the research hypothesis) is a statement that represents a different conclusion than the null hypothesis. The null hypothesis typically represents the status quo or the assumption that there is no significant difference or relationship between two or more groups or variables. The alternative hypothesis is the statement that is being tested, and it proposes that there is a significant difference or relationship between the groups or variables being studied.
- Box Plot: Check in will provide you box plot chart or else not.
- Histogram: Check in will provide you histogram chart or else not.
- Label: This will do the data labels, which contains three options:
- Outlier: Data values that are far away from other data values, can strongly affect your results.
- All quartiles: Quartiles are values that divide a sample of data into four equal parts. Quickly evaluate a data set's spread and central tendency.
- Mean: The mean in a box plot to provide additional information about the data's central tendency.
- Individual Data: An individual data point is a single observation or value in a dataset.
- Download as Excel: This will display the result in an Excel format, which can be easily edited and reloaded for calculations using the load file option.
How to do One sample z-test for summarized data
The guide is as follows:
- Login in to QTools account with the help of https://qtools.zometric.com/ or https://intelliqs.zometric.com/
- On the home page, choose Statistical Tool> Graphical analysis >One sample z-test for summarized data
- Click on One sample z-test for summarized data and reach the dashboard.
- Next, update the data manually or can completely copy (Ctrl+C) the data from excel sheet and paste (Ctrl+V) it here.
- Next, you need to put the values of sample size, sample mean, known standard deviation, hypothesized mean and confidence level.
- Finally, click on calculate at the bottom of the page and you will get desired results.
On the dashboard of One sample z-test for summarized data, the window is having only left part.
Load File: It is used to directly load the excel data.
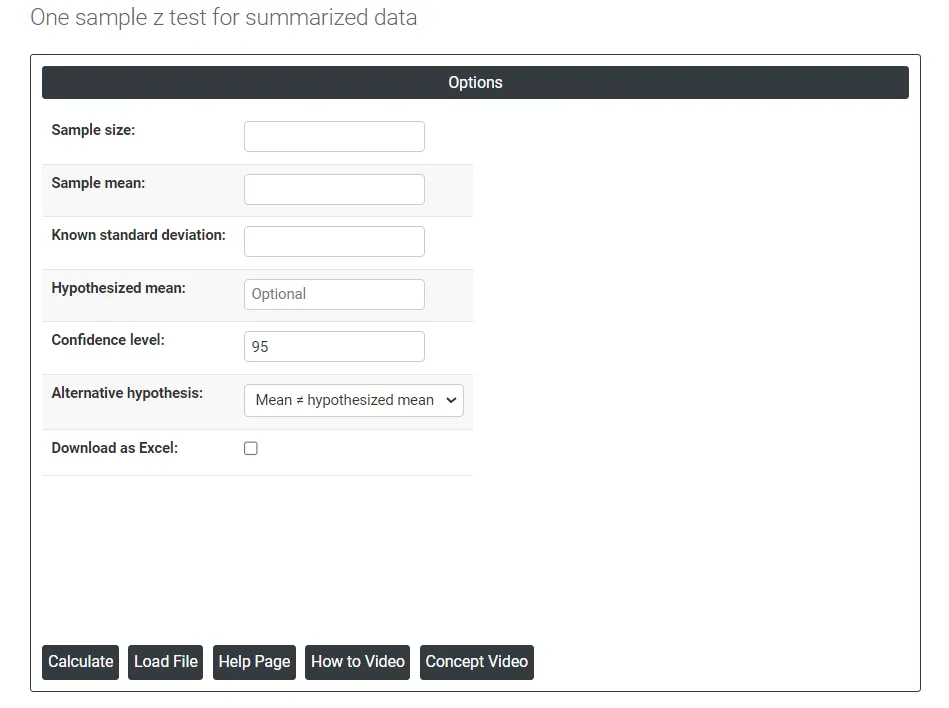
In this part, there are many options present as follows:
- Sample size: Sample size refers to the number of individuals, objects, or events selected from a population to be studied in order to draw conclusions about the whole population. In other words, it is the number of observations or participants included in a study. The size of the sample can have a significant impact on the accuracy and reliability of the study's results. A larger sample size typically provides a more representative picture of the population and helps to reduce the effects of random sampling error. Therefore, it is important to determine an appropriate sample size before conducting research to ensure that the results are statistically valid and reliable.
- Sample mean: The sample mean is the average value of a set of observations or data points selected from a larger population. It is calculated by adding up all the values in the sample and dividing by the number of observations. The sample mean is often used as an estimator of the population mean, which is the average value of the entire population.
- Confidence level: In hypothesis testing, the confidence level represents the degree of certainty or level of confidence that we have in our statistical analysis. It is a probability value that indicates the likelihood that the true population parameter falls within the specified range of values. Typically, the confidence level is expressed as a percentage and is denoted by (1 - α), where α is the level of significance or the probability of rejecting a true null hypothesis. For example, if we have a confidence level of 95%, then we are saying that we are 95% confident that the true population parameter lies within our interval estimate, and there is a 5% chance of making a type I error (rejecting a true null hypothesis). In practical terms, a higher confidence level means that we are more confident in our statistical analysis and results. However, increasing the confidence level also increases the width of the confidence interval, making it more difficult to detect small effects. Therefore, the choice of the confidence level depends on the context of the study and the goals of the researcher.
- Known standard deviation: In hypothesis testing, the standard deviation is a measure of the spread of a set of data around its mean. It is used in conjunction with the sample mean to calculate the test statistic, which is then used to determine the p-value of a hypothesis test. The standard deviation of a sample is denoted by the symbol s, and it is calculated as the square root of the sample variance. The sample variance is the average of the squared differences of each observation from the sample mean. In hypothesis testing, the standard deviation is used to determine the significance of the difference between the observed sample mean and the expected population mean under the null hypothesis. Specifically, the test statistic (usually denoted by t) is calculated as the difference between the sample mean and the population mean (assumed under the null hypothesis), divided by the standard error of the mean (which is equal to the standard deviation of the sample divided by the square root of the sample size).
- Hypothesized mean: The hypothesized mean, also known as the expected mean or population mean, is a value specified in the null hypothesis that represents the average value of the variable being tested. It is a theoretical value that is used to compare the actual sample mean to determine whether the difference is statistically significant or due to chance.
- Alternative hypothesis: In hypothesis testing, the alternative hypothesis (also called the research hypothesis) is a statement that represents a different conclusion than the null hypothesis. The null hypothesis typically represents the status quo or the assumption that there is no significant difference or relationship between two or more groups or variables. The alternative hypothesis is the statement that is being tested, and it proposes that there is a significant difference or relationship between the groups or variables being studied.
- Download as Excel: This will display the result in an Excel format, which can be easily edited and reloaded for calculations using the load file. option.