What is one way ANOVA?
The one-way analysis of variance (ANOVA) is a statistical technique used to determine if there are significant differences between the means of three or more independent groups. It involves one independent variable and compares group means to assess factor impacts. The test checks the null hypothesis that all group means are equal against the alternative that at least one is different. One-way ANOVA is widely used in fields like psychology, education, and medicine, with results presented in an ANOVA table.
When to use one way ANOVA?
This test is appropriate when you have a continuous dependent variable and a categorical independent variable with three or more levels.
- Comparing Multiple Groups: When you need to compare the means of three or more independent groups to determine if there is a significant difference among them.
- Single Factor Influence: When the study focuses on the effect of a single factor (independent variable) on a dependent variable.
- Experimental Design: When you have an experimental design where subjects are randomly assigned to different groups representing different levels of the independent variable.
- Normal Distribution: When the data for the dependent variable in each group is approximately normally distributed.
- Homogeneity of Variances: When the variances of the populations are assumed to be equal (homoscedasticity).
- Independent Observations: When the observations within each group are independent of each other.
Some common examples of when one way ANOVA might be used include:
- Comparing the average scores of students who took different types of classes (e.g., online vs. in-person vs. hybrid).
- Analyzing the effectiveness of three or more different drugs in treating a disease.
- Comparing the average salaries of employees in three or more different departments within a company.
Guidelines for correct usage of one way ANOVA
Guidelines for data collection, analysis, and result interpretation:
- Include only one categorical variable as a fixed factor, using appropriate models for multiple fixed or random factors.
- Ensure the response variable is continuous, using specific logistic models for categorical responses.
- Samples should be from a normal population or have sufficient size (>15 or 20) for accurate analysis.
- Each observation should be independent to ensure valid results.
- Collect data representing the population with precision and accuracy, recording in the order collected.
- Ensure the model fits the data well, using diagnostic and summary statistics for validation.
Alternatives: When not to use one way ANOVA
- In case you have multiple categorical factors that are fixed, use the Fit General Linear Model if all of them are fixed factors.
- If there are random factors, use the Fit Mixed Effects Model instead.
- If you wish to visualize the connection between a continuous predictor and response, use the Fitted Line Plot.
- When you have more than one predictor, use the Fit Regression Model.
Example of one way ANOVA?
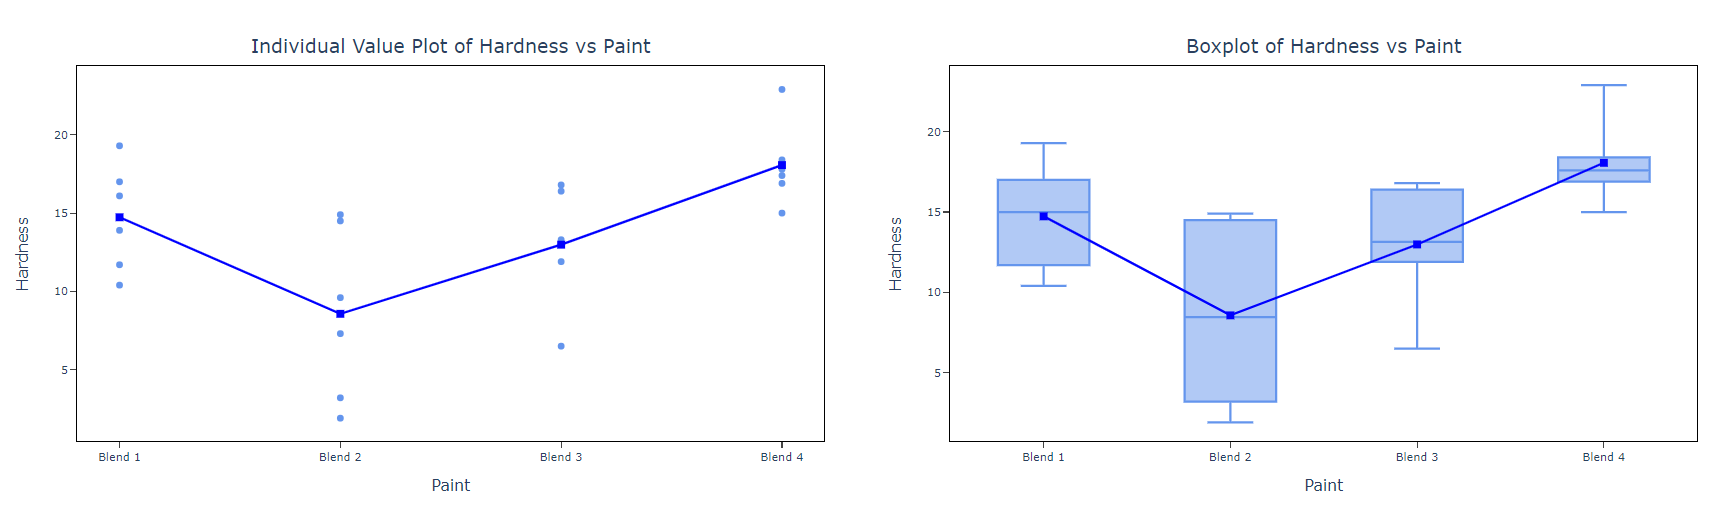
The chemical engineer intends to evaluate the hardness of four different paint blends by applying six samples of each blend to a metal piece, curing them, and measuring their hardness. To test for the similarity of means and to examine the variations between pairs of means, the analyst employs one-way ANOVA with multiple comparisons. The following steps:
- Gathered the necessary data.
- Now analyses the data with the help of https://qtools.zometric.com/ or https://intelliqs.zometric.com/.
- To find One way anova choose https://intelliqs.zometric.com/> Statistical module> Anova>One way anova.
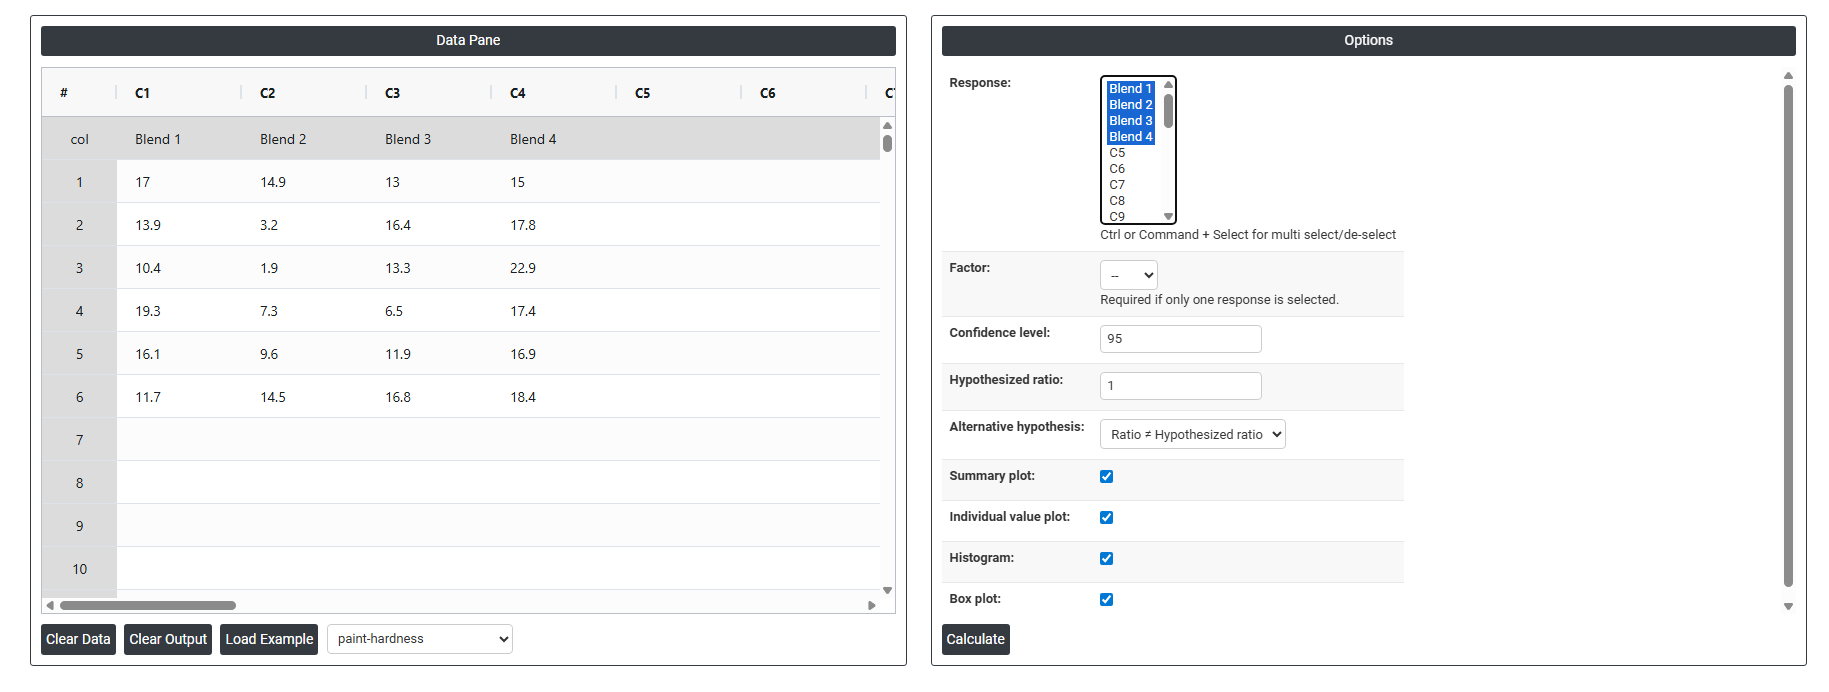
- Inside the tool, feeds the data along with other inputs as follows:
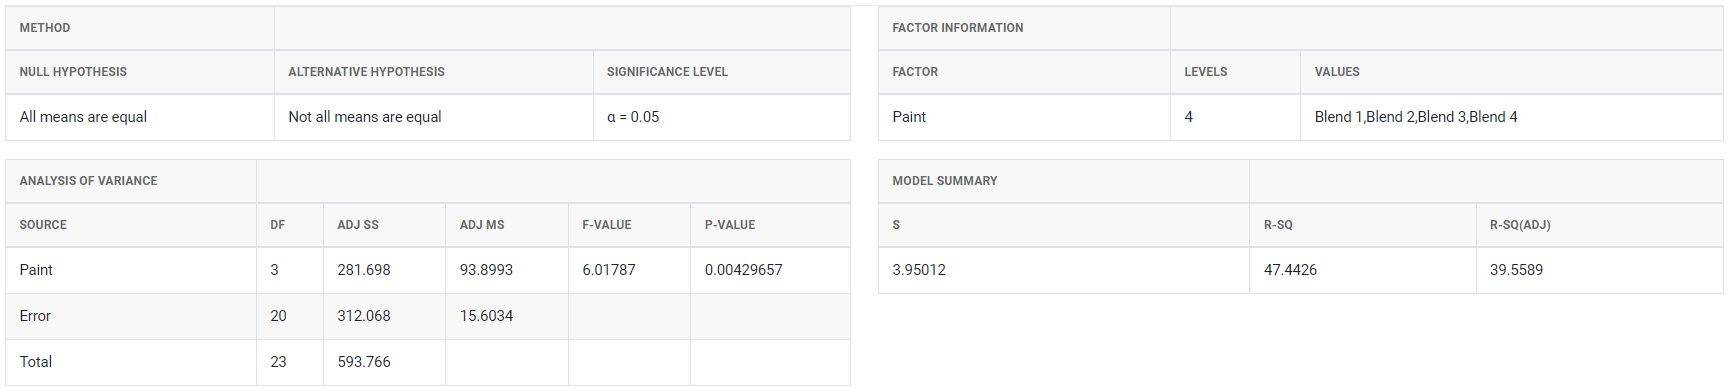
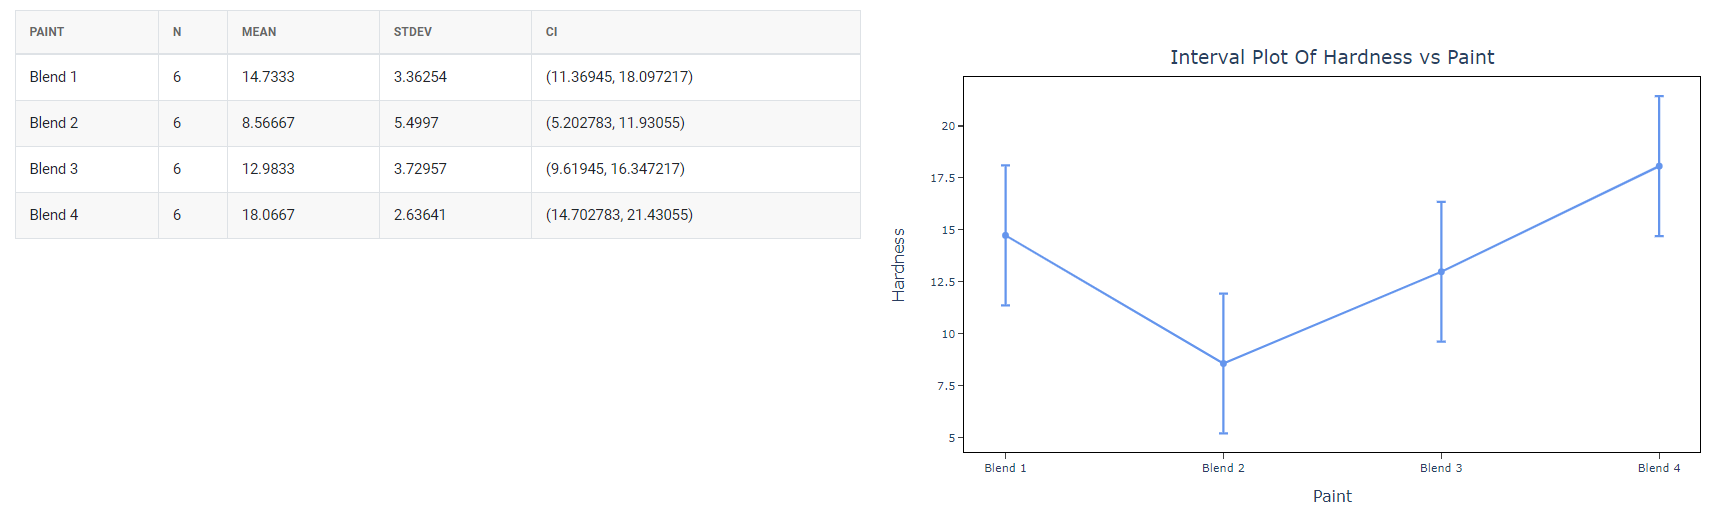
5. After using the above mentioned tool, fetches the output as follows:
How to do one way ANOVA
The guide is as follows:
- Login in to QTools account with the help of https://qtools.zometric.com/ or https://intelliqs.zometric.com/
- On the home page, choose Statistical Tool> Anova >one way ANOVA.
- Click on one way ANOVA and reach the dashboard.
- Next, update the data manually or can completely copy (Ctrl+C) the data from excel sheet and paste (Ctrl+V) it here.
- Next, you need to put the value of confidence level.
- Finally, click on calculate at the bottom of the page and you will get desired results.
On the dashboard of one way ANOVA, the window is separated into two parts.
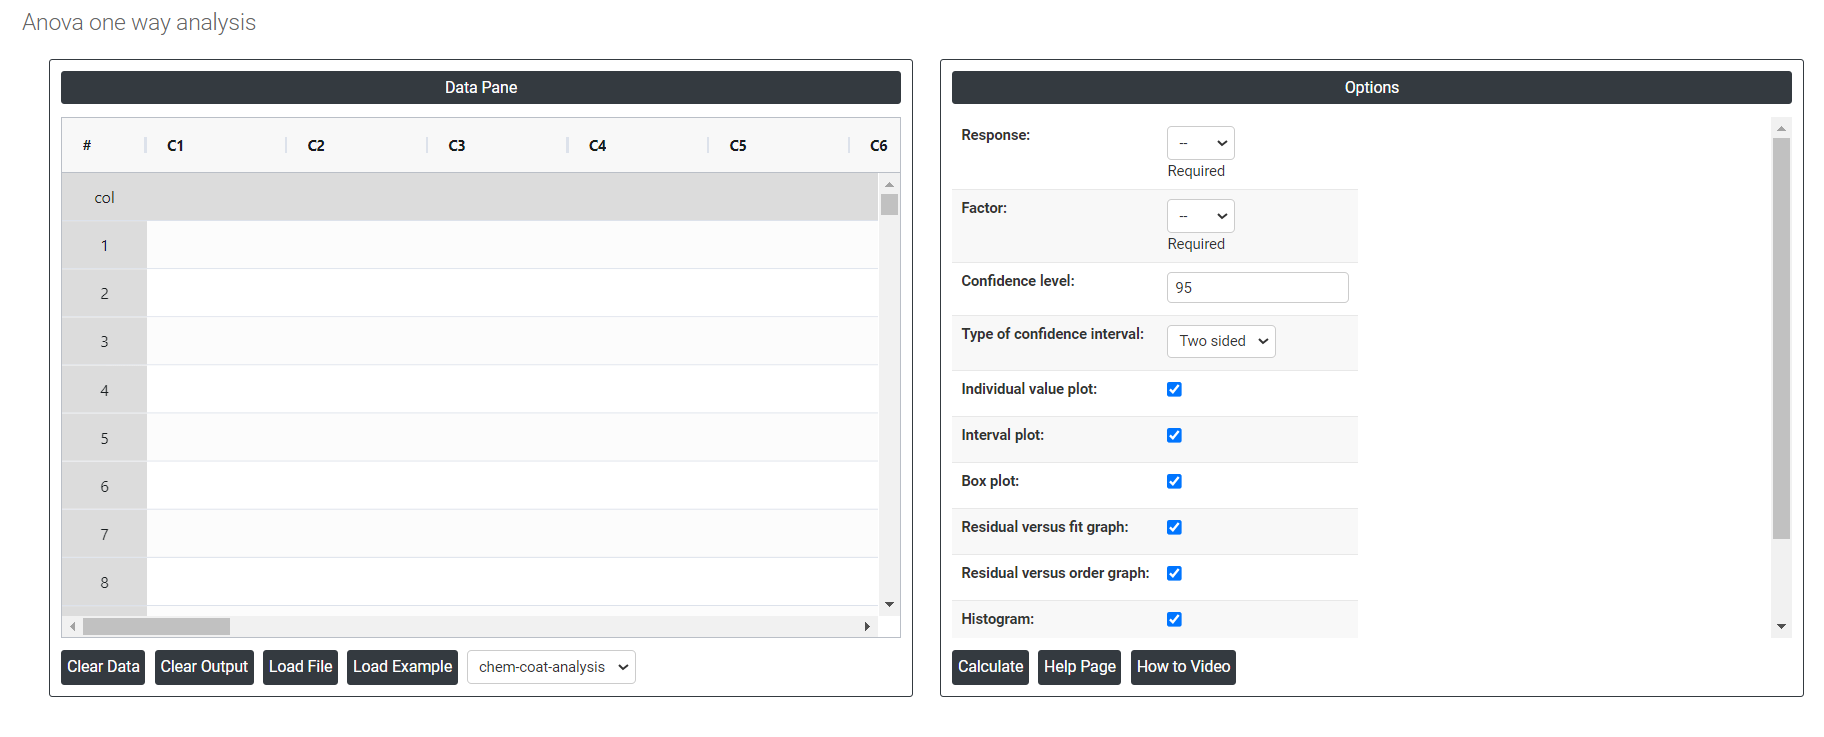
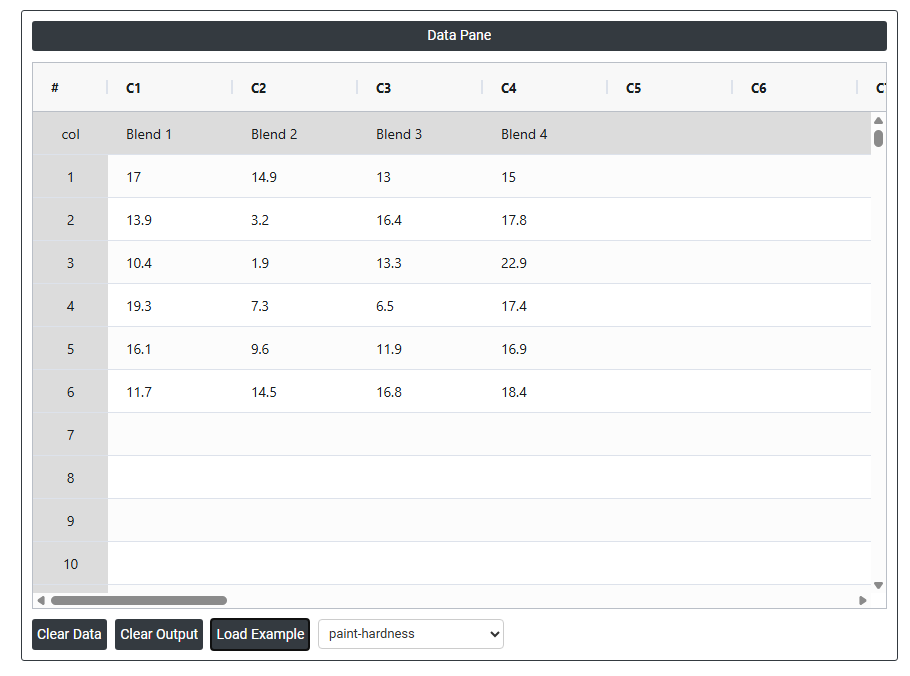
On the left part, Data Pane is present. In the Data Pane, each row makes one subgroup. Data can be fed manually or the one can completely copy (Ctrl+C) the data from excel sheet and paste (Ctrl+V) it here.
Load example: Sample data will be loaded.
Load File: It is used to directly load the excel data.
On the right part, there are many options present as follows:
- Confidence level: In one-way ANOVA (analysis of variance), the confidence level refers to the degree of certainty that a statistical analysis provides. It is the probability that the difference observed between the groups in the study is not due to random chance. The confidence level is typically expressed as a percentage, and it represents the degree of certainty that the results obtained from the sample data will be representative of the larger population. A common confidence level used in statistical analysis is 95%.
- Two sided confidence level: Use a two-sided confidence interval in one-way ANOVA to estimate both the lower and upper bounds for the mean response, providing a range of values that likely contains the true population mean. This interval estimate reflects the difference in means between groups in both directions, above and below the sample mean, with a specified level of confidence.
- Individual value plot: An Individual Value Plot (IVP) is a graphical tool best suited for small sample sizes (fewer than 50 observations) that displays individual data points to facilitate detailed examination of distribution, central tendency, variability, and outliers, and is also effective for comparing distributions across multiple small groups.
- Interval plot: Use an interval plot, also known as a mean plot or confidence interval plot, to assess and compare the 95% confidence intervals of group means in a one-way ANOVA. This graphical representation displays each group's mean as a dot or symbol on the horizontal axis, with the vertical axis representing the measured variable. Horizontal lines or vertical bars above and below each mean indicate the confidence intervals. This method works best with sample sizes of at least 20 per group, as larger sample sizes yield smaller and more precise confidence intervals. In one-way ANOVA, interval plots help determine if there are significant differences between the means of three or more groups.
- Box plot: A box plot is a graphical representation of data that shows the distribution of a variable within different groups in a one-way ANOVA analysis. In a one-way ANOVA, we compare the means of a continuous variable across different levels of a categorical variable. The box plot displays the distribution of the continuous variable for each group, including the median, interquartile range (IQR), and any outliers.
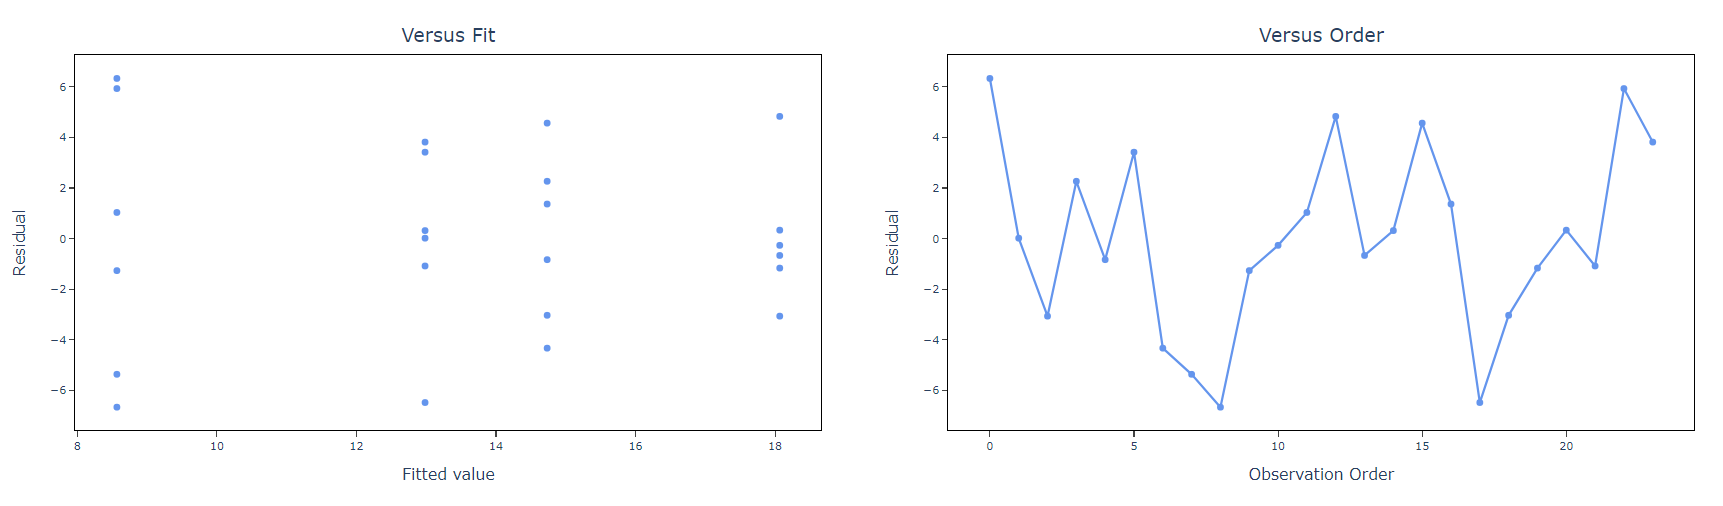
- Residual versus fit graph: A residual versus fit graph, also known as a residual plot, is a graphical tool used in one-way ANOVA to assess the goodness of fit of the model. The plot displays the residuals, which are the differences between the observed values and the predicted values, on the y-axis and the predicted values on the x-axis.
- Residual versus order graph: In one-way ANOVA, a residual versus order graph is a graphical tool used to assess the assumption of equal variance of the residuals across different levels of the factor or independent variable. In this graph, the residuals (i.e., the differences between the observed values and the predicted values) are plotted against the order of the observations, which can be simply the sequence of the data points or the level of the factor. The residuals should be randomly scattered around zero and should not show any systematic pattern or trend as the order or level of the factor changes.
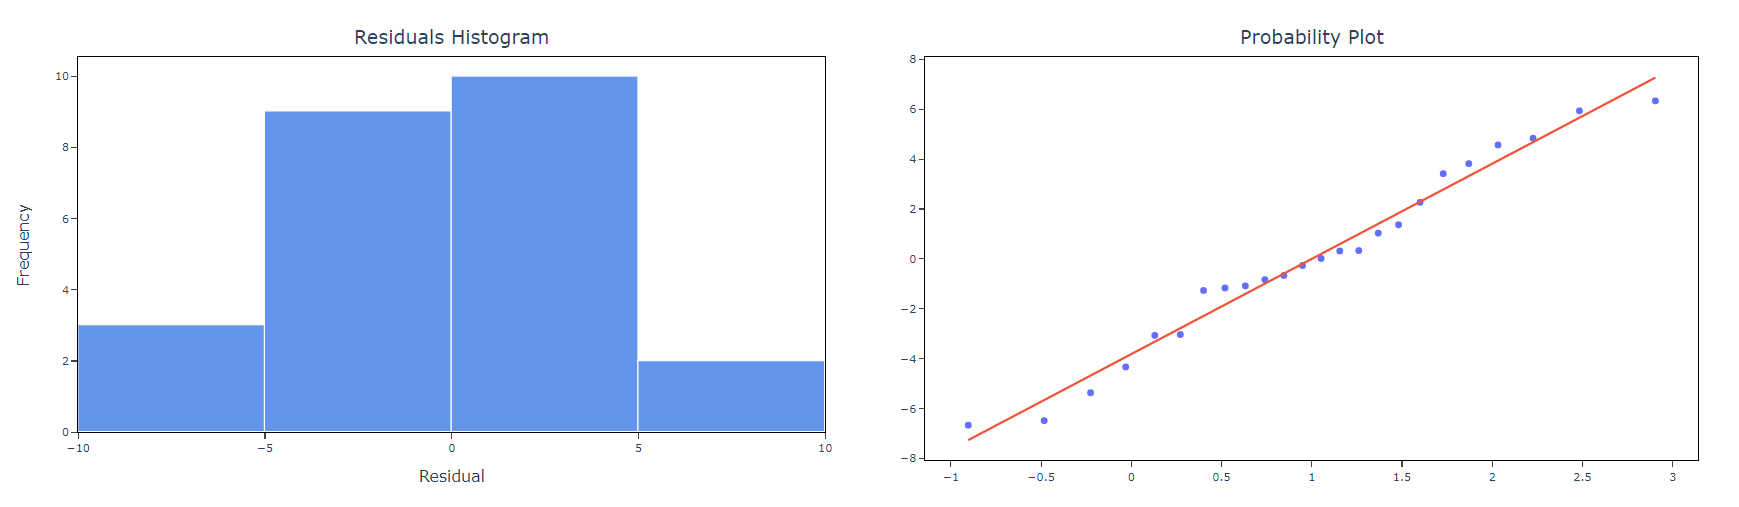
- Histogram: A histogram is a graphical representation of the distribution of a set of data. In the context of one-way ANOVA (analysis of variance), a histogram is often used to visualize the distribution of the dependent variable (i.e., the variable being analyzed) for each group in the study.
- Probability plot: A probability plot, also known as a quantile-quantile (Q-Q) plot, is a graphical tool that is often used in statistical analysis to assess whether a set of data follows a particular distribution. In the context of one-way ANOVA (analysis of variance), a probability plot can be used to assess whether the assumption of normality holds for the residuals (the differences between the observed data and the model predictions) of the ANOVA model.
- Download as Excel: This will display the result in an Excel format, which can be easily edited and reloaded for calculations using the load file option.