What is Ordinal Logistic Regression?
Ordinal Logistic Regression is a statistical model used to analyze the relationship between one or more predictor variables and a response variable that has three or more ordered categories. The categories have a natural rank or sequence such as low/medium/high or disagree/neutral/agree — but the exact distance between them is not measurable. It predicts the probability of falling into each category based on the predictors.
When to use Ordinal Logistic Regression?
Predictor Variables
- Predictors can be continuous, categorical, or a mix of both
- Discrete variables can be treated as continuous or categorical depending on the number of levels and the purpose of analysis
- Only one continuous predictor with a continuous response → use Fit Line Model
- Multiple predictors with a continuous response → use Fit Regression Model
Response Variable
- The response must have three or more ordered categories with a natural rank (e.g. low/medium/high, never/sometimes/always)
- The order matters — but the gap between categories does not need to be equal
- Response has only two categories (pass/fail) → use Fit Binary Logistic Model
- Response has unordered categories (scratch/dent/tear) → use Nominal Logistic Regression
- Response is continuous → use Fit Regression Model or Fit Line Model
Guidelines for correct usage of Ordinal Logistic Regression
- Ensure the response variable has three or more categories with a meaningful order; if the order does not matter, use Nominal Logistic Regression instead.
- Predictors can be continuous or categorical; ensure each predictor is correctly classified before running the model.
- Ensure the data accurately represents the target population; biased or incomplete data will produce unreliable results.
- Collect sufficient data points per category to ensure stable and reliable probability estimates across all response levels.
- Measure all variables as accurately as possible; errors in classification or measurement directly affect model accuracy.
- Record data in the order it is collected to help detect any time-based trends or inconsistencies.
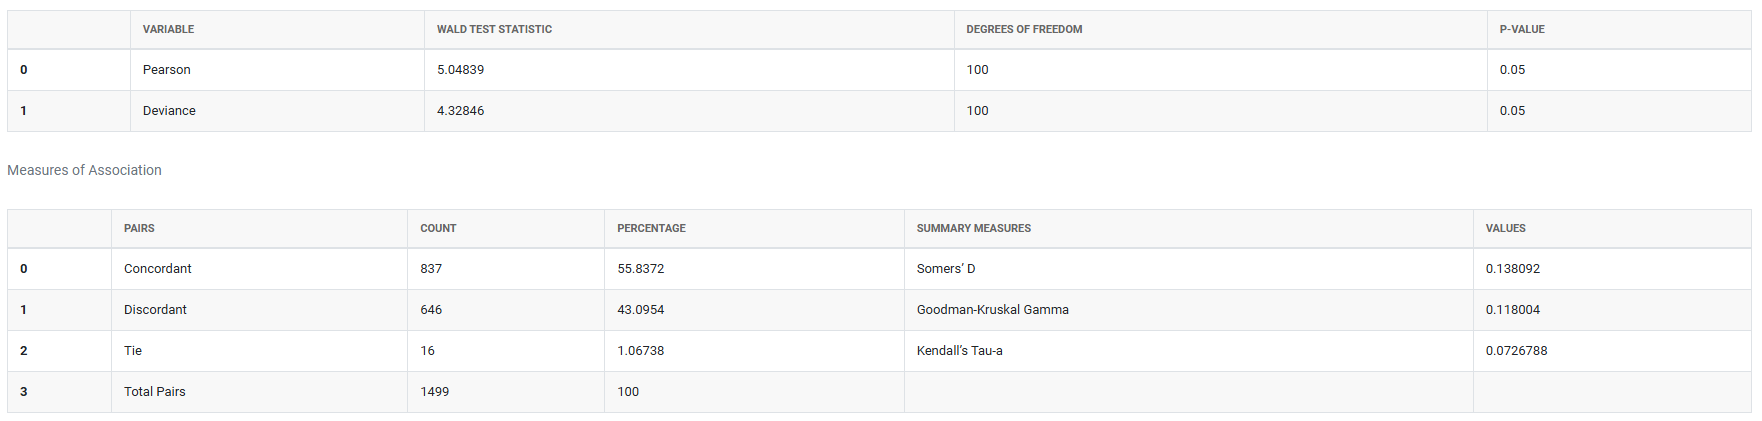
- After fitting, validate the model using the goodness-of-fit statistics and residual diagnostics; a poorly fitting model will produce misleading predictions.
- Check the proportional odds assumption — Ordinal Logistic Regression assumes that the relationship between each pair of outcome groups is consistent. If this assumption is violated, consider Nominal Logistic Regression instead.
Alternatives: When not to use Ordinal Logistic Regression
- If the response has only two categories (e.g. pass/fail), use Fit Binary Logistic Model instead.
- If the response categories have no natural order (e.g. scratch/dent/tear), use Nominal Logistic Regression instead.
- If the response variable is continuous, use Fit Regression Model or Fit Line Model instead.
- If you have only one continuous predictor and a continuous response, use Fit Line Model instead.
- If you have multiple predictors and a continuous response, use Fit Regression Model instead.
Example of Ordinal Logistic Regression?
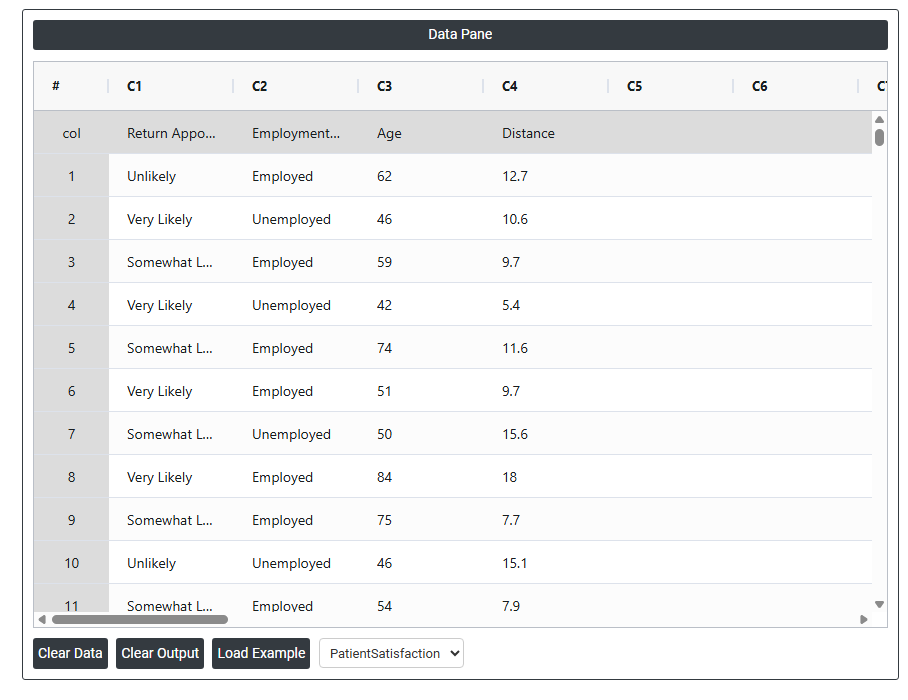
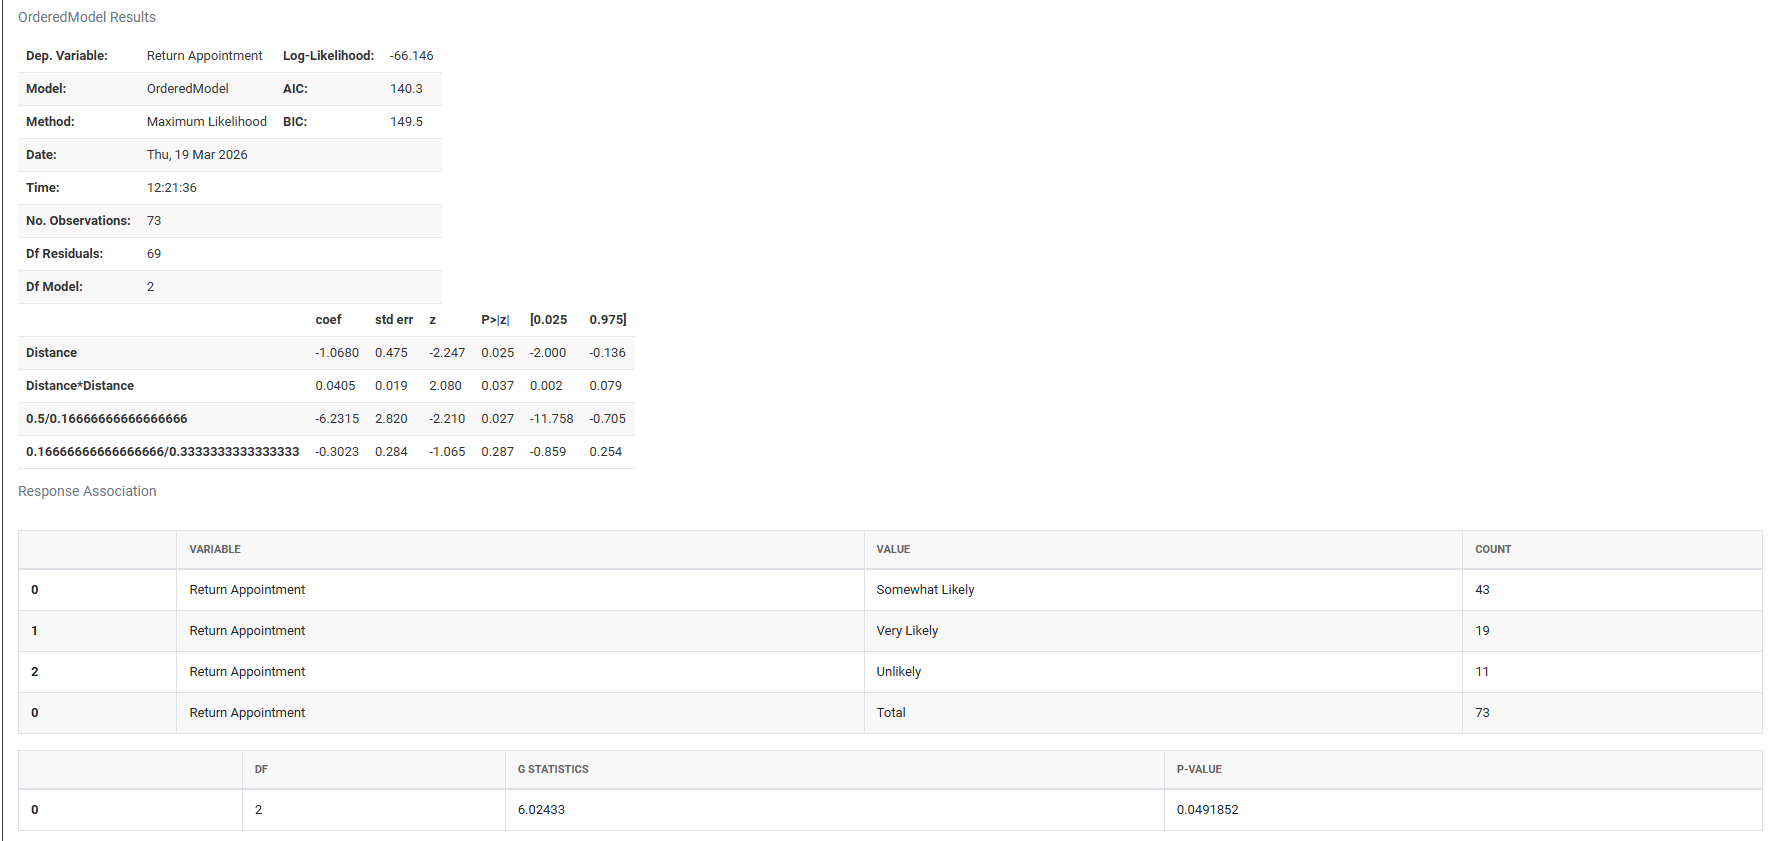
A manager at a physician’s office wants to identify which factors influence patient satisfaction. Patients are surveyed on how likely they are to return for follow-up care, with responses categorized as unlikely, somewhat likely, or very likely. Since these response categories have a natural order, the manager treats the outcome as an ordinal variable and uses ordinal logistic regression to examine the relationship between patient likelihood of returning and predictors such as employment status, age, and proximity to the office. A significance level of 0.05 is used to evaluate the statistical significance and goodness-of-fit of the model. The following steps:
- Gathered the necessary data.
- Now analyses the data with the help of https://qtools.zometric.com/ or https://intelliqs.zometric.com/.
- To find Ordinal Logistic Regression choose https://intelliqs.zometric.com/> Statistical module> Regression>Ordinal Logistic Regression.
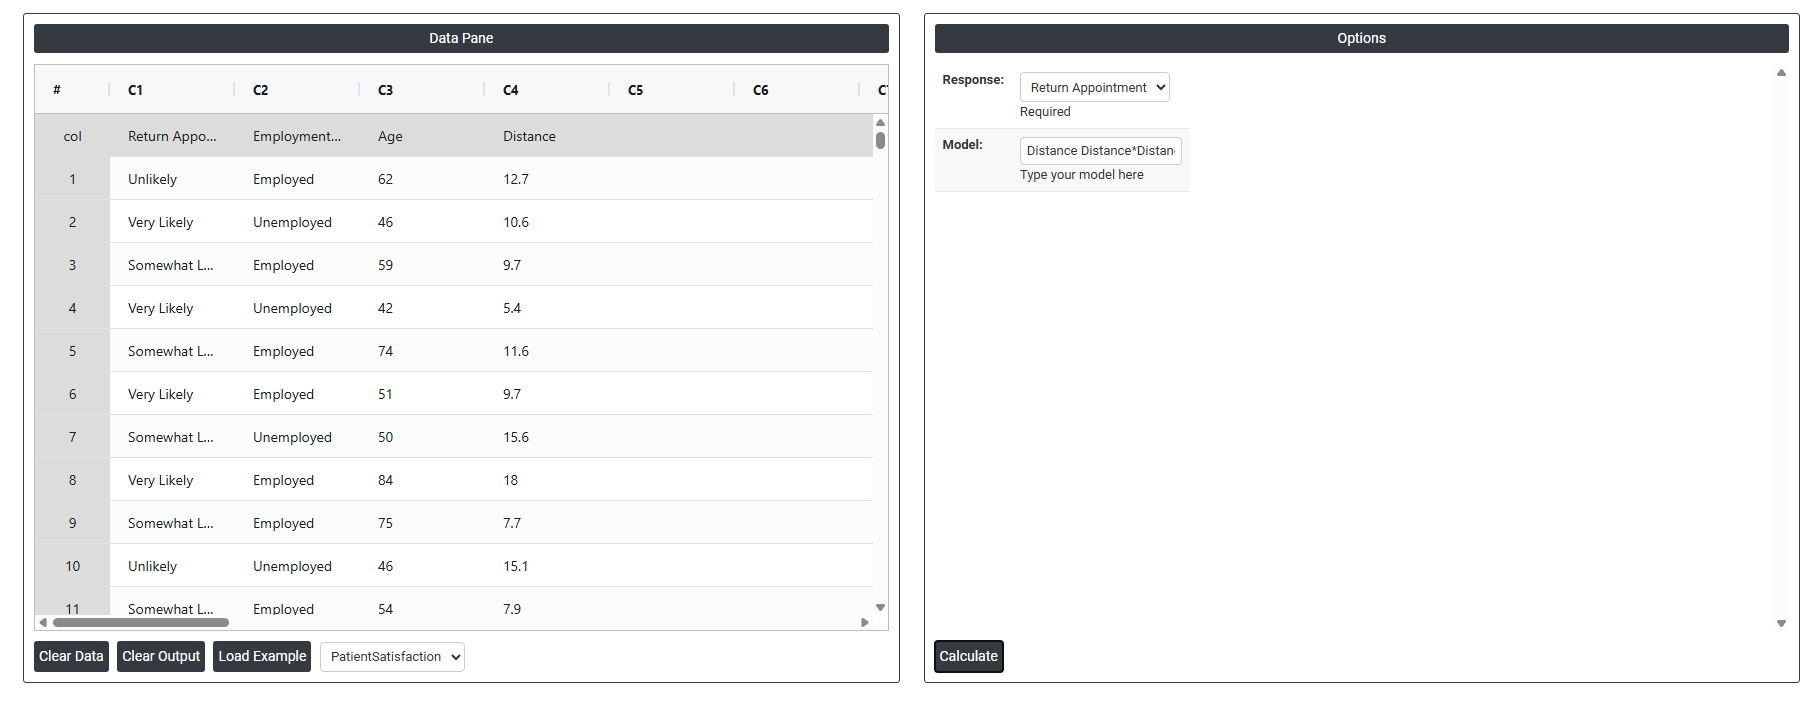
- Inside the tool, feed the data along with other inputs as follows:
5. After using the above mentioned tool, fetches the output as follows
How to do Ordinal Logistic Regression
The guide is as follows:
- Login in to QTools account with the help of https://qtools.zometric.com/ or https://intelliqs.zometric.com/
- On the home page, choose Statistical Tool> Regression > Ordinal Logistic Regression.
- Next, update the data manually or can completely copy (Ctrl+C) the data from excel sheet or paste (Ctrl+V) it or else there is say option Load Example where the example data will be loaded.
- Next, you need to fill the required options .
- Finally, click on calculate at the bottom of the page and you will get desired results.
On the dashboard of Ordinal Logistic Regression, the window is separated into two parts.
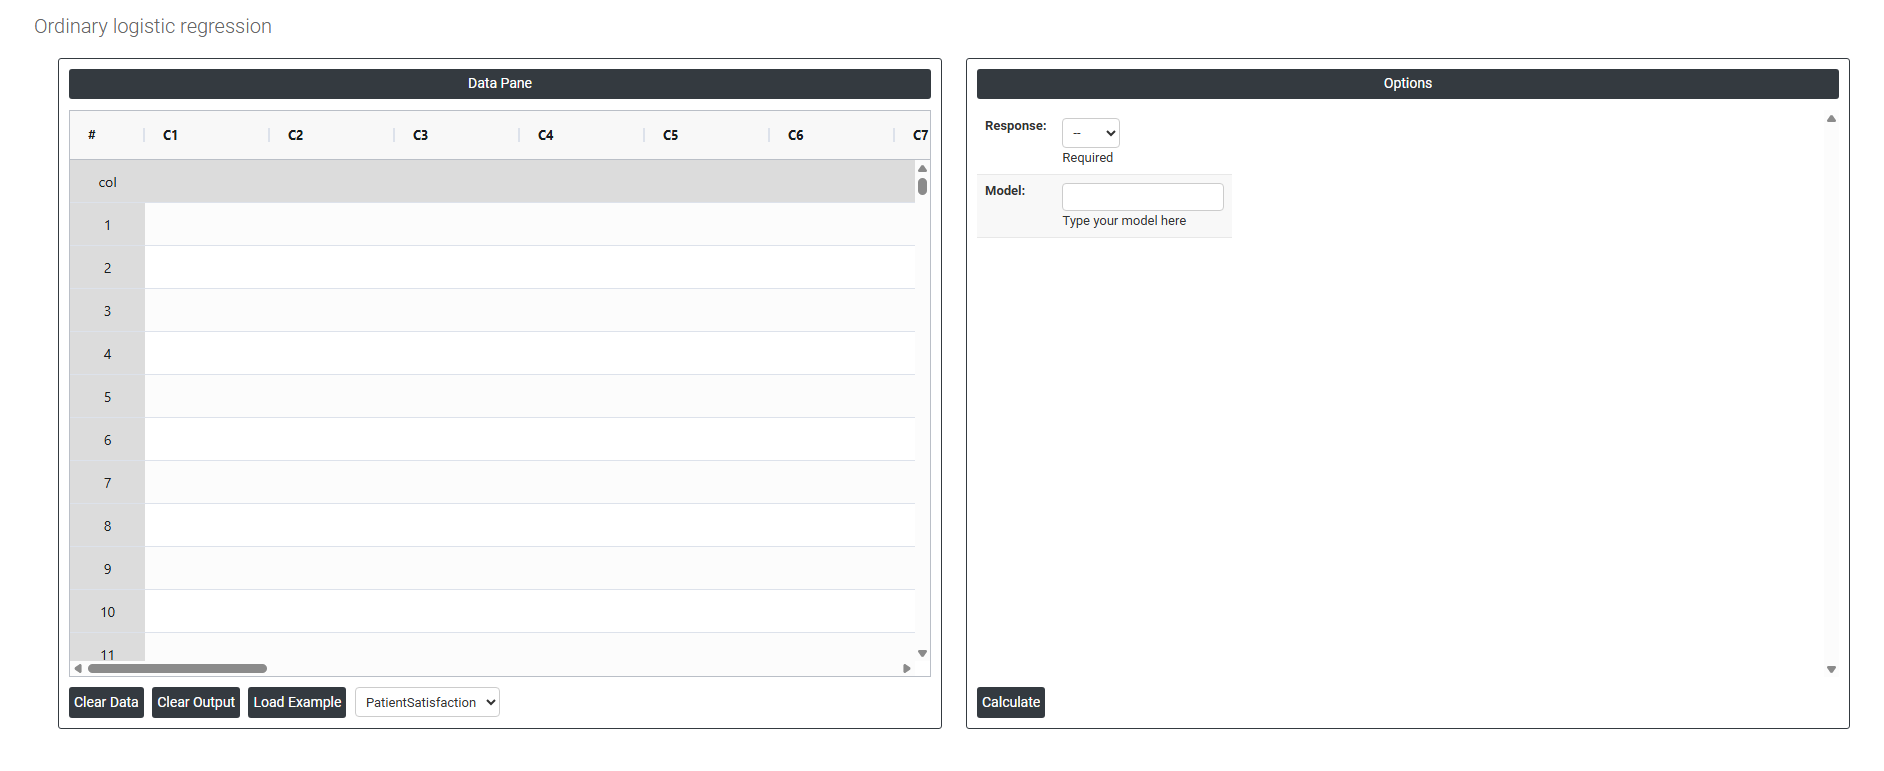
On the left part, Data Pane is present. In the Data Pane, each row makes one subgroup. Data can be fed manually or the one can completely copy (Ctrl+C) the data from excel sheet and paste (Ctrl+V) it here.
Load example: Sample data will be loaded.
Load File: It is used to directly load the excel data.
On the right part, there are many options present as follows:
- Response: The response is the outcome variable you want to predict or study. In Ordinal Logistic Regression, the response must contain three or more categories with a natural, meaningful order — where categories can be ranked but the gap between them does not need to be equal.
For example:
- Pain level → Mild / Moderate / Severe
- Survey response → Disagree / Neutral / Agree
The model then calculates the probability of an observation falling into each category based on the predictor variables.
-
Model Defines the structure of your analysis by specifying which predictors and interaction terms are included in the model. You can include:
- Continuous predictors — numeric variables such as temperature, age, or dosage
- Categorical predictors — grouped variables such as gender, material type, or region
- Interaction terms — combinations of two or more predictors that together may have an effect beyond their individual contributions