What is Out Of Spec Estimator?
The Out of Spec Estimator calculates the expected proportion or percentage of process output that falls outside defined specification limits. Rather than simply counting how many measured values violated the spec in your sample, it uses a statistical model fitted to your data to estimate how much non-conforming output the entire process is likely to be producing including parts that may not have been measured.
This makes it a forward-looking tool it tells you not just what happened in your current sample, but what your process is likely generating over the long run, providing a realistic and complete picture of process performance.
Simple Definitions: A tool that estimates the percentage of your total process output expected to fall outside specification limits based on the statistical behaviour of your data, not just the sample counts.
When to use Out Of Spec Estimator?
- Use when you need to quantify process non-conformance and understand what proportion of output is likely outside specification.
- Use during capability studies to complement Cp and Cpk indices with a practical, easy-to-communicate defect rate estimate.
- Use when your sample size is too small to directly observe defects but you want a statistically valid estimate of the defect rate.
- Use when comparing multiple process settings or time periods to identify which configuration produces the least out-of-spec output.
Guidelines for correct usage of Out Of Spec Estimator
- Data must be continuous and approximately normally distributed for the estimation to be statistically valid — verify normality before applying.
- Ensure the process is stable and in statistical control before running the estimator — results from an unstable process are unreliable and misleading.
- Clearly define both lower and upper specification limits before running the analysis — incorrect spec inputs will produce incorrect estimates.
- Collect at least 30 to 50 observations for a stable and trustworthy distributional fit.
- If data is non-normal, apply an appropriate transformation (e.g. Box-Cox) or fit a non-normal distribution before estimating the out-of-spec proportion.
Alternatives: When not to use Out Of Spec Estimator
| Situation | Use Instead |
| Data is non-normal and untransformed | Nonnormal Capability Analysis |
| Need full capability indices (Cp, Cpk, Pp, Ppk) | Process Capability Analysis |
| Data is attribute-based (pass/fail counts) | Binomial or Poisson Capability Analysis |
| Process is unstable or not in statistical control | Control Charts first, then capability analysis |
Example of Out Of Spec Estimator
The following steps to perform for Out of spec estimator:
- Fill the Required information data.
- Now analyses the data with the help of https://qtools.zometric.com/ or https://intelliqs.zometric.com/.
- To find Out Of Spec Estimator choose https://intelliqs.zometric.com/> Statistical module> Graphical analysis > Out Of Spec Estimator.
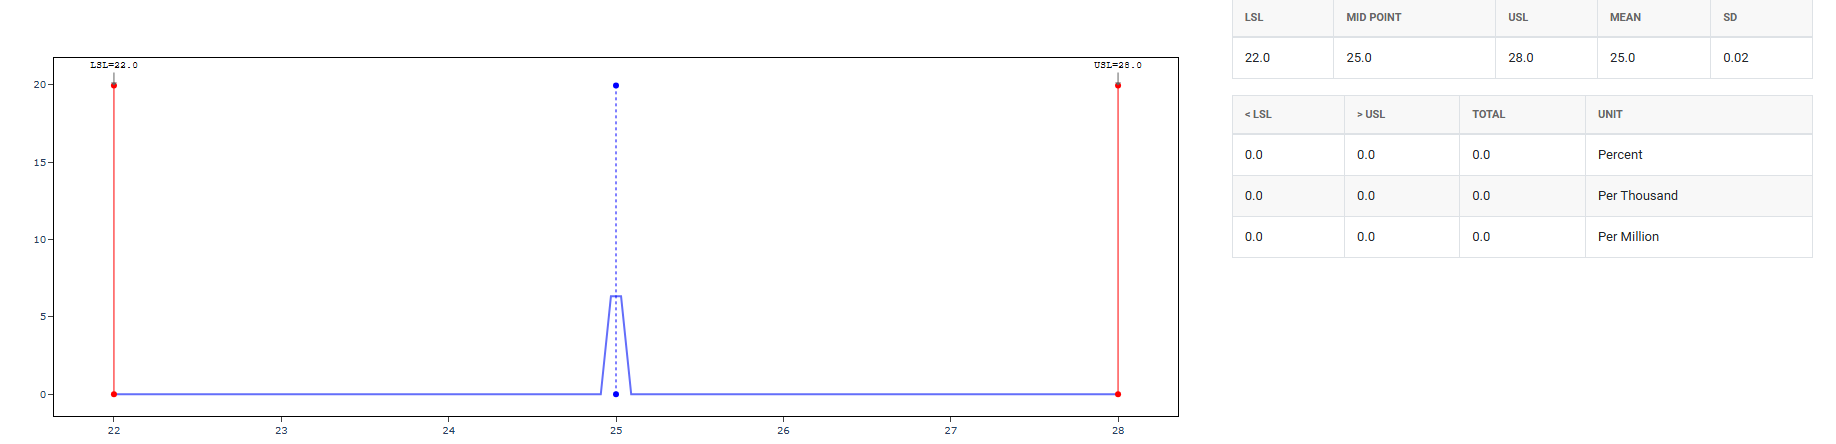
- After using the above-mentioned tool, fetches the output as follows:
How to do Out Of Spec Estimator
The guide is as follows:
- Login in to QTools account with the help of https://qtools.zometric.com/ or https://intelliqs.zometric.com/
- On the home page, choose Statistical Tool> Graphical analysis > Out Of Spec Estimator.
- Next, you need to fill the required columns.
- Finally, click on Submit at the bottom of the page and you will get desired results.
On the dashboard of Out Of Spec Estimator, the window is separated into two parts.
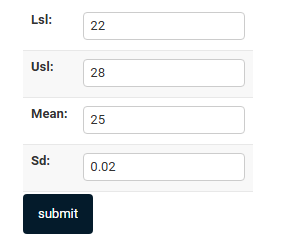
On the required form, we just need to give:
- LSL — Lower Specification Limit The minimum acceptable value. Anything below this is considered defective or out of spec. For example, a bolt must be at least 9.9mm long.
- USL — Upper Specification Limit The maximum acceptable value. Anything above this is out of spec. For example, the same bolt must be no longer than 10.1mm.
- Mean The average value of your process output — where the center of your distribution sits. If your process is perfectly centered, the mean falls exactly halfway between LSL and USL.
- SD — Standard Deviation Measures the spread or variability of your process. A small SD means most values cluster tightly around the mean; a large SD means values are spread out, increasing the chance of falling outside the spec limits.