What is Out of spec estimator?
An out of spec estimator is a statistical tool that can be used to determine the probability of a product being out of spec. The estimator takes into account the upper specification limit (USL), lower specification limit (LSL), mean, and standard deviation of the data.
The USL is the maximum acceptable value for a product, and the LSL is the minimum acceptable value. The mean is the average value of the data, and the standard deviation is a measure of how spread out the data is.
When to use Out of spec estimator?
The out of spec estimator is a statistical tool that can be used to determine the probability of a product being out of spec. It is useful in a variety of situations, including:
- Manufacturing: The out of spec estimator can be used to identify products that are not meeting specifications. This information can be used to improve the manufacturing process and reduce the number of defective products.
- Quality control: The out of spec estimator can be used to monitor the quality of products and identify any potential problems. This information can be used to prevent defective products from reaching customers.
- Research and development: The out of spec estimator can be used to test new products and identify any potential problems. This information can be used to improve the design of the product and reduce the number of defects.
The out of spec estimator is a powerful tool that can be used to improve the quality of products. It is a valuable tool for any organization that manufactures, sells, or uses products.
Guidelines for correct usage of Out of spec estimator
Here are some guidelines for the correct usage of the out of spec estimator:
- Make sure that the data you are using is representative of the population of products that you are interested in. If the data is not representative, the results of the estimator may be inaccurate.
- Make sure that the specifications are realistic. If the specifications are too tight, it may be impossible to meet them.
- Consider the cost of using the estimator. The estimator may be expensive to use, so you need to make sure that the benefits of using it outweigh the costs.
- Use the estimator in conjunction with other quality control tools. The estimator is just one tool that can be used to improve quality. You should also use other tools, such as inspection and testing, to ensure that your products are meeting specifications.
Alternatives: When not to use Out of spec estimator
There are a few situations where you should not use the out of spec estimator. These include:
- When the data is not representative of the population of products that you are interested in. For example, if you are using data from a small sample of products, the results of the estimator may not be accurate.
- When the specifications are too tight. If the specifications are too tight, it may be impossible to meet them. In this case, you may need to relax the specifications or use a different estimator.
- When the cost of using the estimator is too high. The estimator may be expensive to use, so you need to make sure that the benefits of using it outweigh the costs.
- When there are better alternatives available. There are a number of other statistical tools that can be used to determine the probability of a product being out of spec. If one of these tools is more accurate, efficient, or cost-effective, you should use it instead of the out of spec estimator.
Here are some better alternatives to the out of spec estimator:
- The control chart: A control chart is a graphical tool that can be used to monitor the quality of a product over time. It can be used to identify any potential problems before they cause a product to be out of spec.
- The hypothesis test: A hypothesis test is a statistical test that can be used to determine whether there is a significant difference between the mean of a population and a specified value. This can be used to determine whether a product is meeting specifications.
- The confidence interval: A confidence interval is a range of values that is likely to contain the true value of a population parameter. This can be used to estimate the probability of a product being out of spec.
Example of Out of spec estimator?
An engineer is manufacturing a product that has a USL of 100 units and a LSL of 90 units. The mean of the data is 95 units and the SD is 5 units. She has performed this in following steps:
- She analyzes the data with the help of https://qtools.zometric.com/
- Inside the tool, she feeds the inputs as usl, lsl, mean and standard deviation.
- After using the above mentioned tool, she fetches the output as follows:

How to do Out of spec estimator
The guide is as follows:
- Login in to QTools account with the help of https://qtools.zometric.com/
- On the home page, you can see Out of spec estimator under Graphical Analysis.
- Click on Out of spec estimator and reach the dashboard.
- Now feed the input as usl, lsl, mean and standard deviation.
- Finally, click on submit at the bottom of the page and you will get desired results.
On the dashboard of Out of spec estimator, the window has only left part.
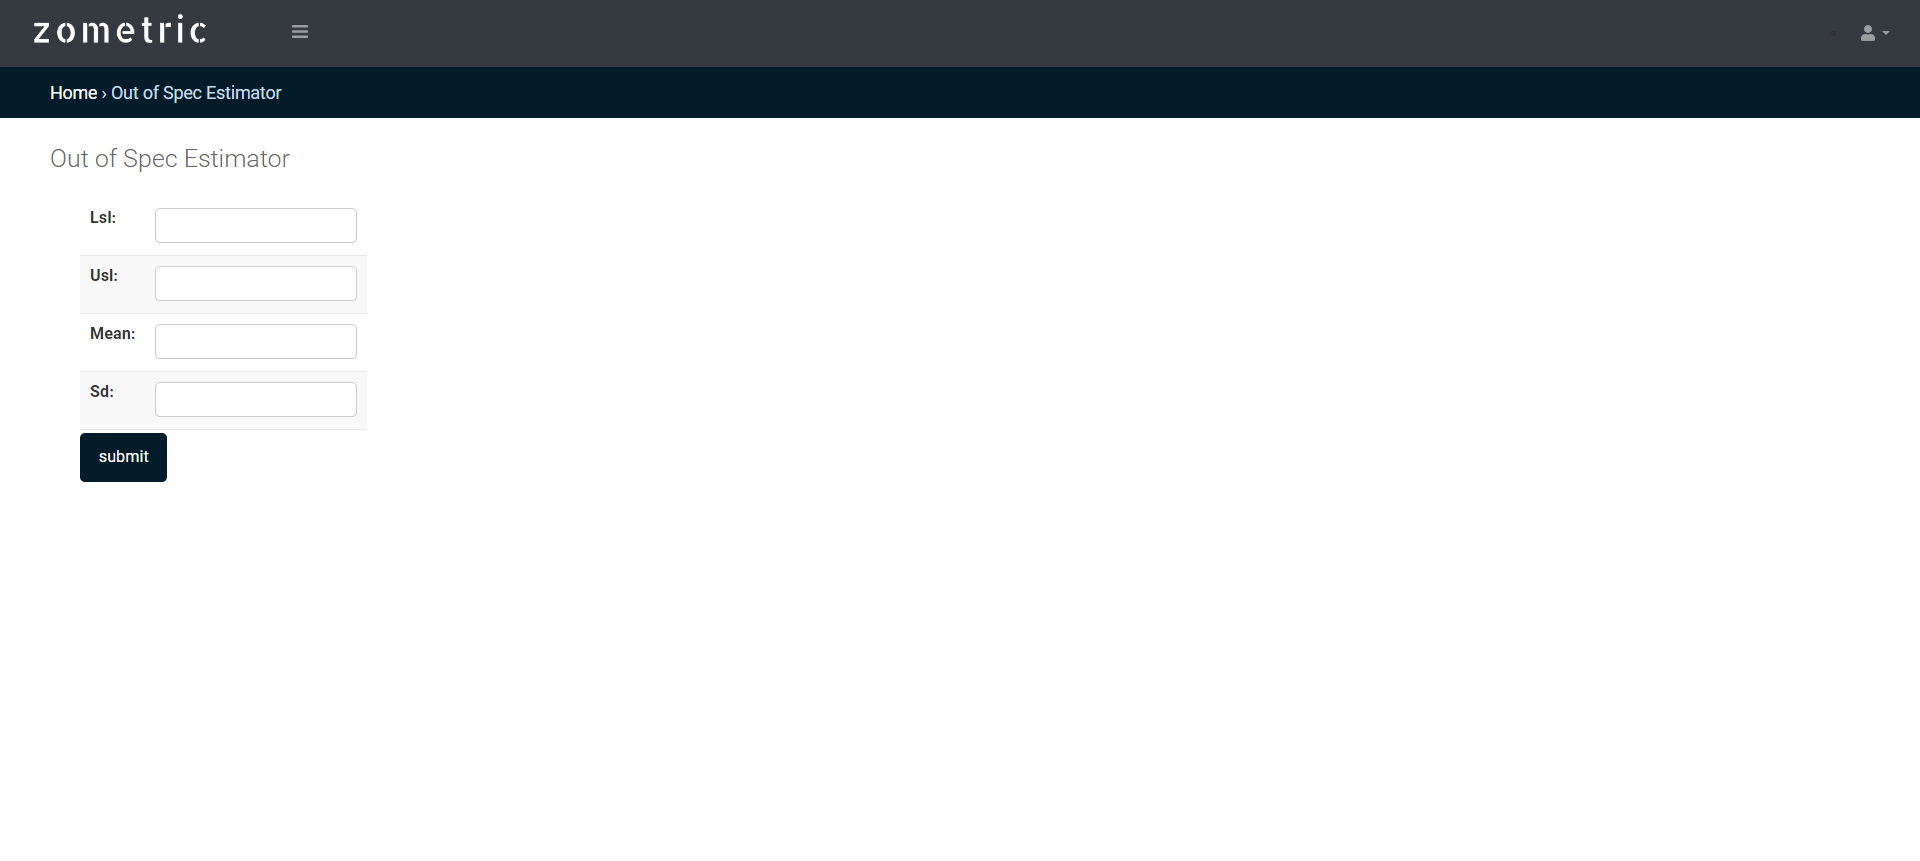
On the left part, there are many options present as follows:
- USL (Upper Specification Limit): It refers to the maximum acceptable value or limit for a particular parameter or characteristic. The USL is often defined based on the requirements or specifications of a product, process, or industry standard.
- LSL (Lower Specification Limit): LSL represents the minimum acceptable value or limit for a parameter or characteristic. Similar to the USL, the LSL is determined based on specific requirements or specifications.
- Mean: The mean, also known as the average, is a measure of central tendency. It is calculated by summing up all the values in a dataset and dividing it by the total number of values. The mean provides an estimate of the "typical" value or the center of the distribution.
- SD (Standard Deviation): The standard deviation is a measure of the dispersion or variability in a dataset. It quantifies how much the values deviate from the mean. A higher standard deviation indicates greater variability, while a lower standard deviation suggests less variability.