What is Outlier test?
When to use Outlier test?
- Use when you suspect unusual values may be present in your dataset before running capability analysis, regression, or hypothesis testing.
- Use during data cleaning and validation to confirm data integrity before making process decisions.
- Use when an individual data point looks visually extreme on a histogram or control chart and you need a formal test to confirm whether it is statistically unusual.
- Use when measurement errors, data entry mistakes, or special-cause events may have introduced atypical values into the dataset.
Guidelines for correct usage of Outlier test
- The data should be approximately normally distributed — the Grubbs test assumes normality and may not perform reliably on highly skewed data.
- Never automatically delete flagged outliers without investigation — always determine whether the outlier represents a genuine process event, a measurement error, or a data entry mistake.
- Test for one outlier at a time when using the Grubbs test — removing one outlier and re-testing is more reliable than testing for multiple outliers simultaneously.
- Document any outliers that are removed, along with the justification for removal — this is critical for audit trails and quality records.
- Set alpha at 0.05 as the standard default — a p-value below 0.05 indicates the flagged value is statistically unusual.
Alternatives: When not to use Outlier test
- If data is not normally distributed, use robust outlier detection methods such as the IQR method or median absolute deviation instead.
- If you want to visually inspect the spread of data rather than a formal test, use a Boxplot or Individual Value Plot
- If multiple outliers are expected, use the Generalised ESD (Extreme Studentized Deviate) test instead of repeated single-outlier Grubbs tests.
- If the outlier is due to a known special cause event, treat it as a process signal and investigate using control charts rather than simply removing it.
Example of Outlier test
A quality engineer at a wooden handle company tests the strength of a random sample of broom handles. The engineer records the force that is required to break each handle. The engineer creates a graph of the data and notices that one of the values in the sample seems unusually small. The test in following steps:
- Gathered the necessary data.
- Now analyses the data with the help of https://qtools.zometric.com/ or https://intelliqs.zometric.com/.
- To find Outlier test choose https://intelliqs.zometric.com/> Statistical module> Hypothesis Test> Outlier test.
- Inside the tool, feeds the data along with other inputs as follows:
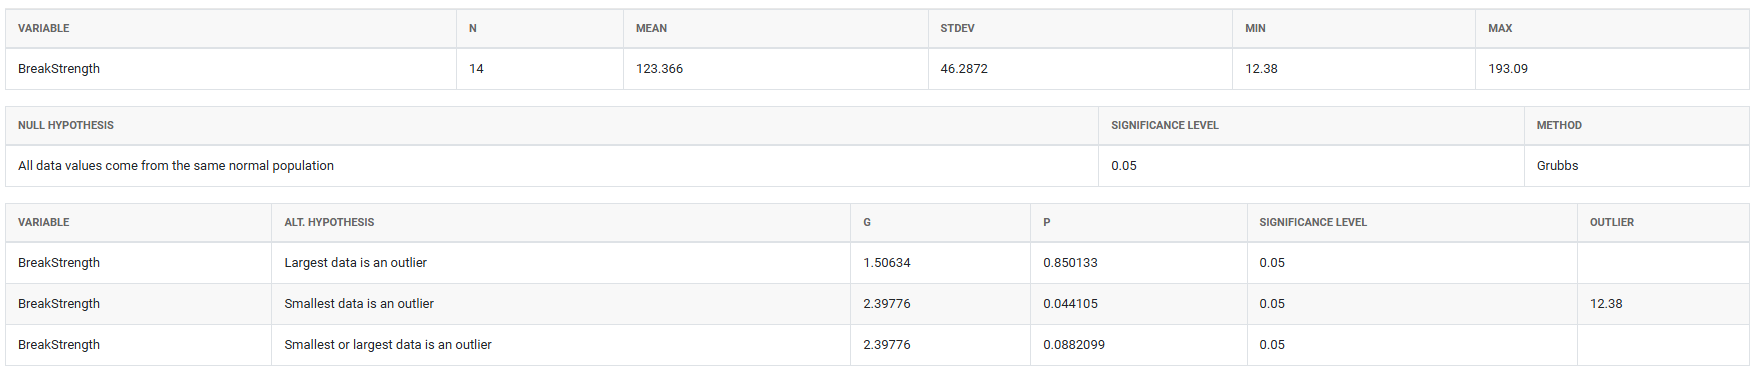
5. After using the above mentioned tool, fetches the output as follows:
How to do Outlier test
The guide is as follows:
- Login in to QTools account with the help of https://qtools.zometric.com/ or https://intelliqs.zometric.com/
- On the home page, choose Statistical Tool> Hypothesis Test >Outlier test .
- Next, update the data manually or can completely copy (Ctrl+C) the data from excel sheet and paste (Ctrl+V) it here.
- Fill the required options.
- Finally, click on calculate at the bottom of the page and you will get desired results.
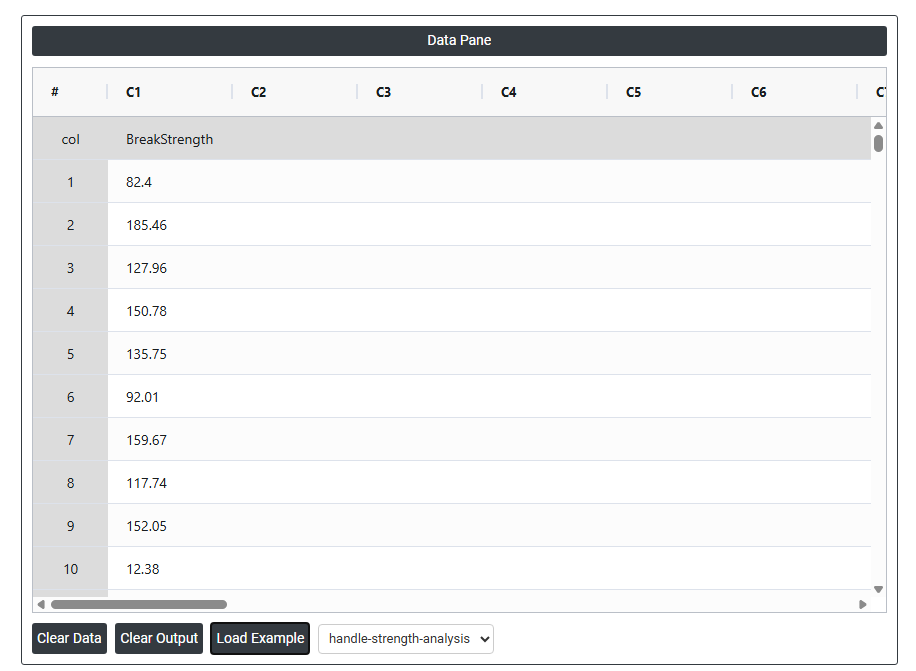
On the dashboard of Outlier test, the window is separated into two parts.
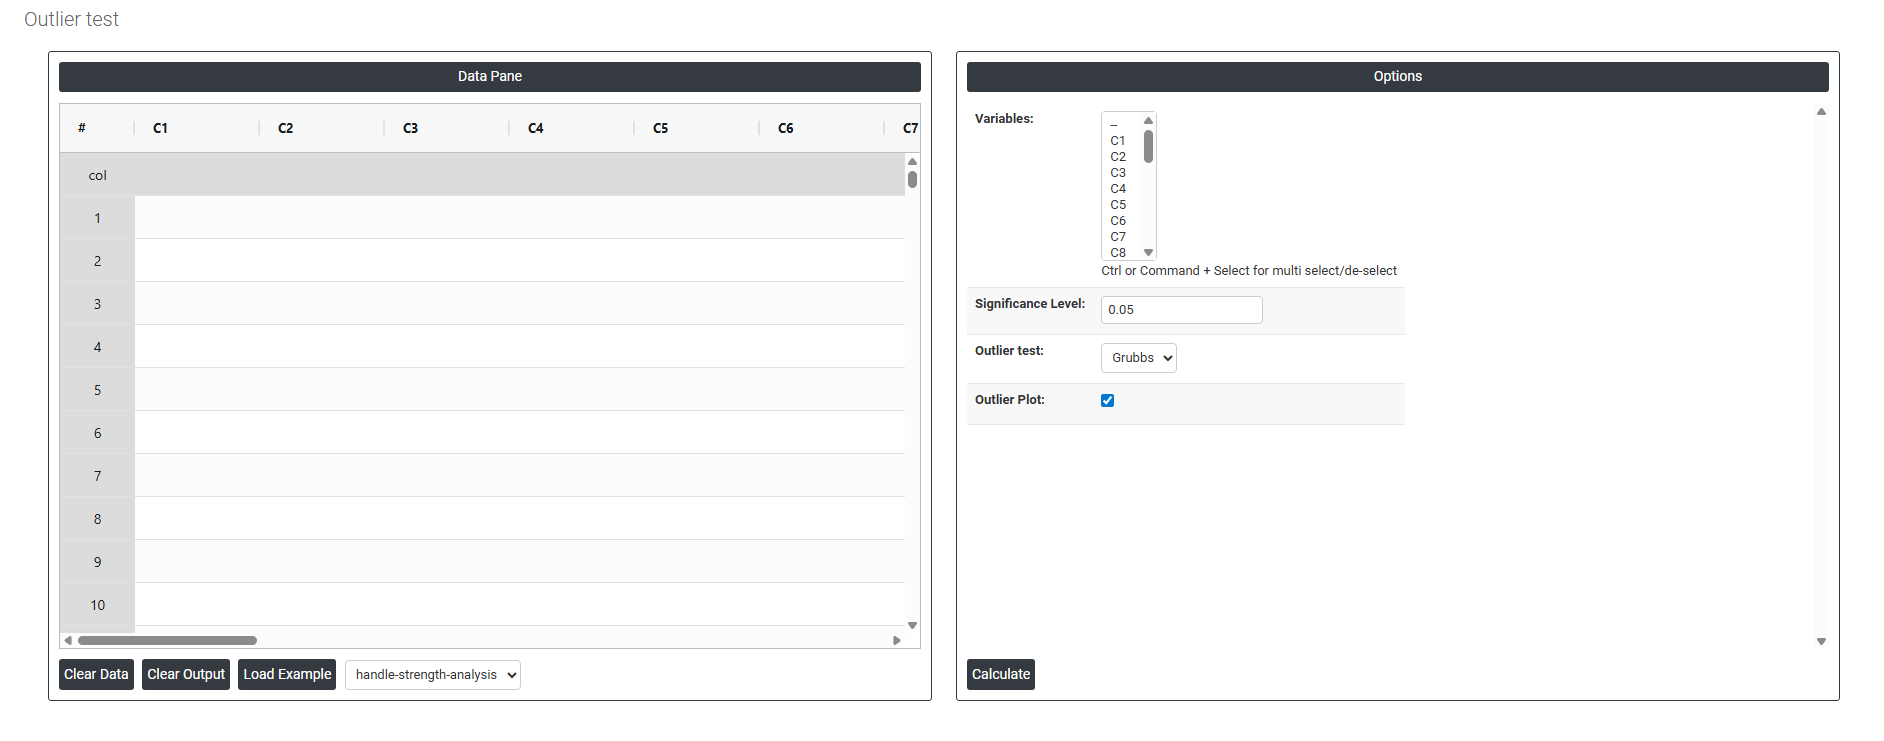
On the left part, Data Pane is present. In the Data Pane, each row makes one subgroup. Data can be fed manually or the one can completely copy (Ctrl+C) the data from excel sheet and paste (Ctrl+V) it here.
Load example: Sample data will be loaded.
Load File: It is used to directly load the excel data.
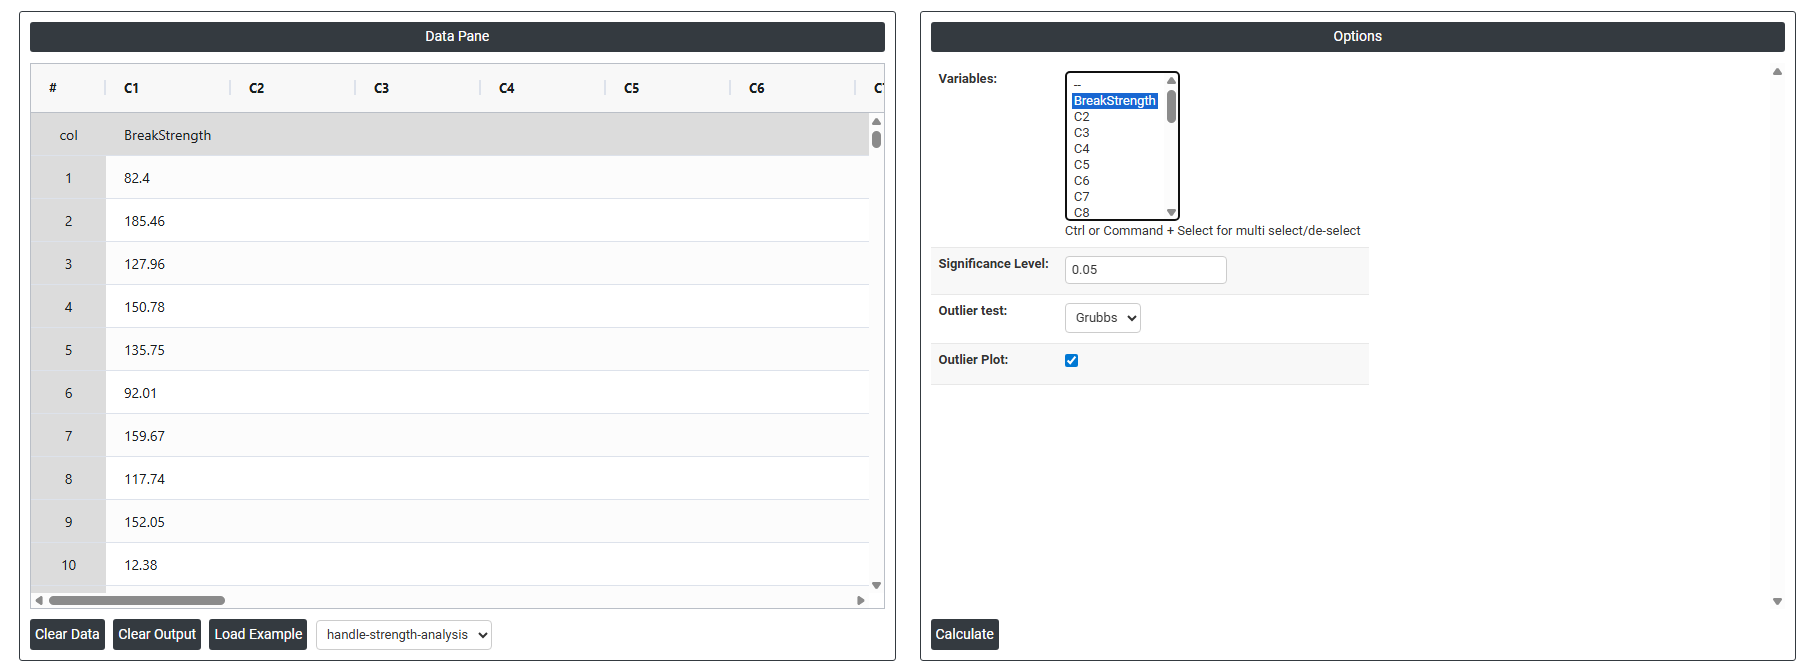
On the right part, there are many options present as follows:
- Variables: Select the column(s) containing the continuous data you want to test for outliers. Use Ctrl or Command + Click to select multiple columns if you want to check several variables at once. Each selected column is tested independently — the tool evaluates every variable separately and reports whether any statistically extreme values are present in each dataset.
- Significance Level: Sets the threshold for determining whether a flagged value is a statistically significant outlier. The standard default is 0.05, meaning there is a 5% risk of incorrectly identifying a normal data point as an outlier when none actually exists. A lower significance level (e.g. 0.01) makes the test more conservative and reduces false alarms, but may miss genuine outliers. A higher level (e.g. 0.10) makes the test more sensitive but increases the chance of flagging values that are simply part of natural process variation.
- Outlier Test: Grubbs The Grubbs test is the statistical method used to identify outliers. It works by calculating how many standard deviations the most extreme value in the dataset sits away from the mean, then comparing that distance against a critical value based on the sample size and significance level. If the most extreme value exceeds the critical threshold, it is flagged as a statistically significant outlier.
- The Grubbs test assumes the data is approximately normally distributed and tests one outlier at a time — it identifies the single most extreme value in the dataset. If that value is confirmed and removed, the test can be repeated on the remaining data to check for additional outliers. It is the most widely accepted and commonly used method for outlier detection in normally distributed continuous data.
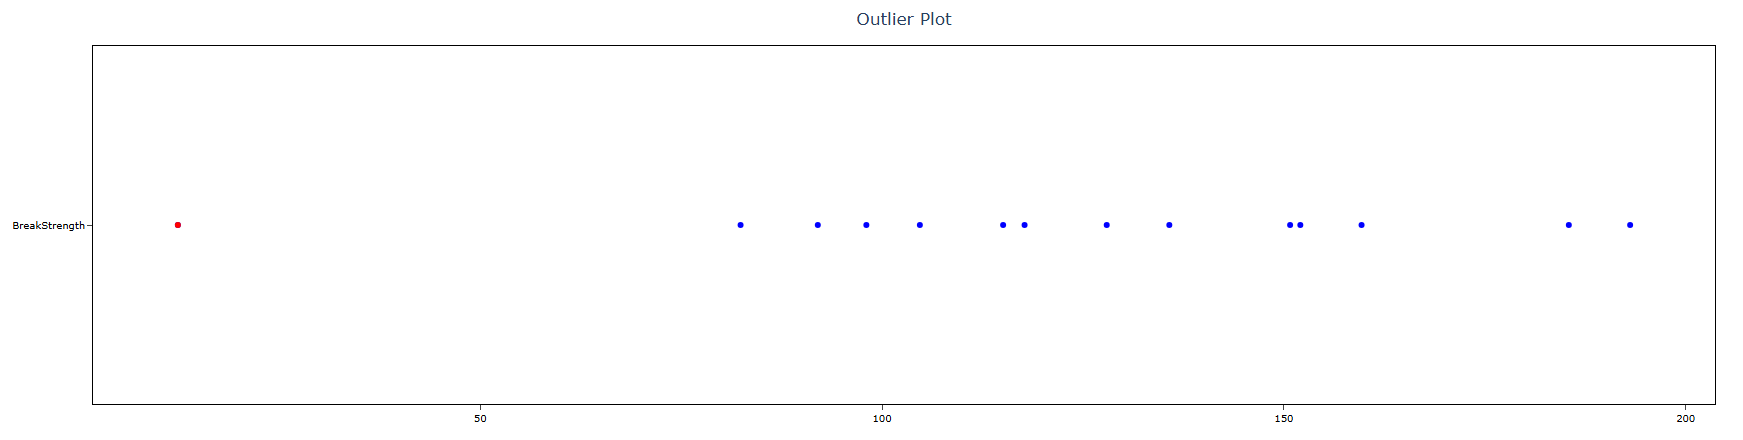
- Outlier Plot: When enabled, displays a visual plot of the data with the suspected outlier clearly marked. The plot shows all data points along a scale so you can immediately see how far the flagged value sits from the rest of the data. This visual confirmation is important because it helps you judge whether the outlier is a genuine extreme value or simply an observation at the natural tail of the distribution — supporting a more informed decision about whether to investigate or retain the flagged point.