What is Paired Equivalence Test?
When to use Paired Equivalence Test?
- Use when you want to confirm that two paired measurement methods or instruments are interchangeable — for example, comparing a new lab instrument to a reference instrument using the same samples.
- Use when you need to validate a process change and demonstrate that the updated process produces outcomes equivalent to the original.
- Use when the same subjects, parts, or samples are measured under both conditions, creating natural pairs in the data.
- Use when regulatory or quality standards require formal equivalence evidence — such as in pharmaceutical, medical device, or food safety applications.
Guidelines for correct usage of Paired Equivalence Test
- Define the equivalence interval before collecting data — this is the maximum acceptable difference between the two methods and must be based on scientific or practical knowledge, not the data itself.
- Ensure measurements are properly paired — each observation in Group 1 must correspond directly to a specific observation in Group 2 (same sample, same subject, same part).
- The differences between pairs should be approximately normally distributed for the test results to be valid.
- Use a sufficient sample size — equivalence tests generally require larger samples than standard difference tests to achieve adequate statistical power.
- Set alpha at 0.05 as the standard default — equivalence is concluded only when both the upper and lower confidence bounds fall entirely within the equivalence interval.
Alternatives: When not to use Paired Equivalence Test
- If the two samples are independent rather than paired, use Two Sample Equivalence Test
- If the goal is to detect a difference rather than prove similarity, use a standard Paired T Test
- If data is non-normal and sample sizes are small, consider a non-parametric equivalence approach instead.
- If you do not have a meaningful equivalence interval defined, do not use this test — the interval is essential and cannot be derived from the data alone.
Example of Paired Equivalence Test?
A vision care company's engineer seeks to verify whether a new contact lens cleaning solution performs as effectively as the leading brand. To do so, 14 participants wear lenses for a day; afterward, each participant cleans one lens with the new solution and the other with the leading brand. The engineer measures cleanliness using the contact angle of a water droplet, where a lower angle indicates a cleaner lens. To assess performance, the engineer conducts a paired equivalence test, considering the solutions equivalent if the mean difference in contact angles falls within ±0.5 degrees. The test in following steps:
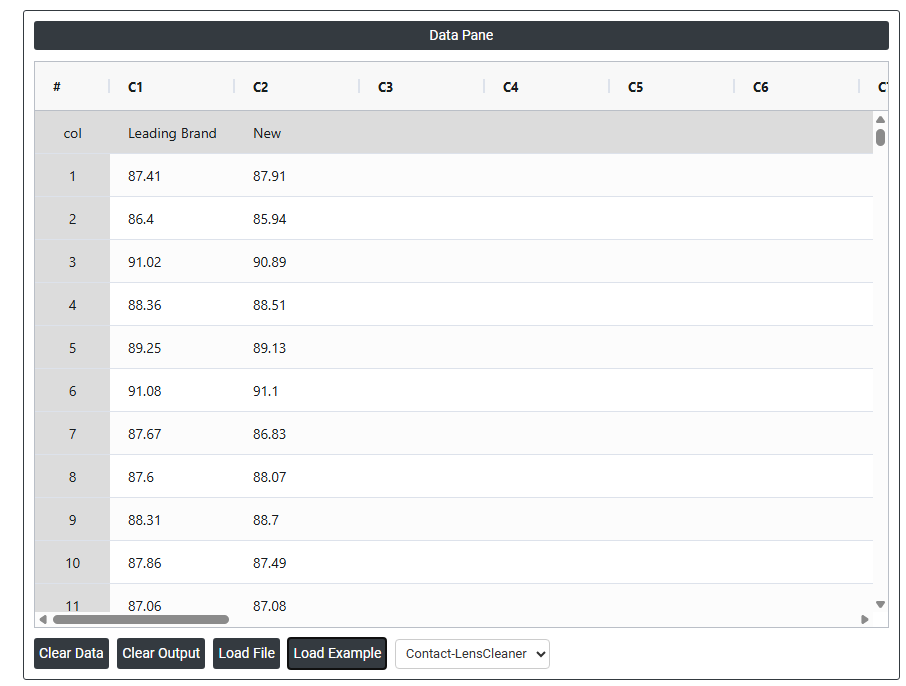
- Gathered the necessary data.
- Now analyses the data with the help of https://qtools.zometric.com/ or https://intelliqs.zometric.com/.
- To find Paired Equivalence Test choose https://intelliqs.zometric.com/> Statistical module> Hypothesis Test> Paired Equivalence Test.
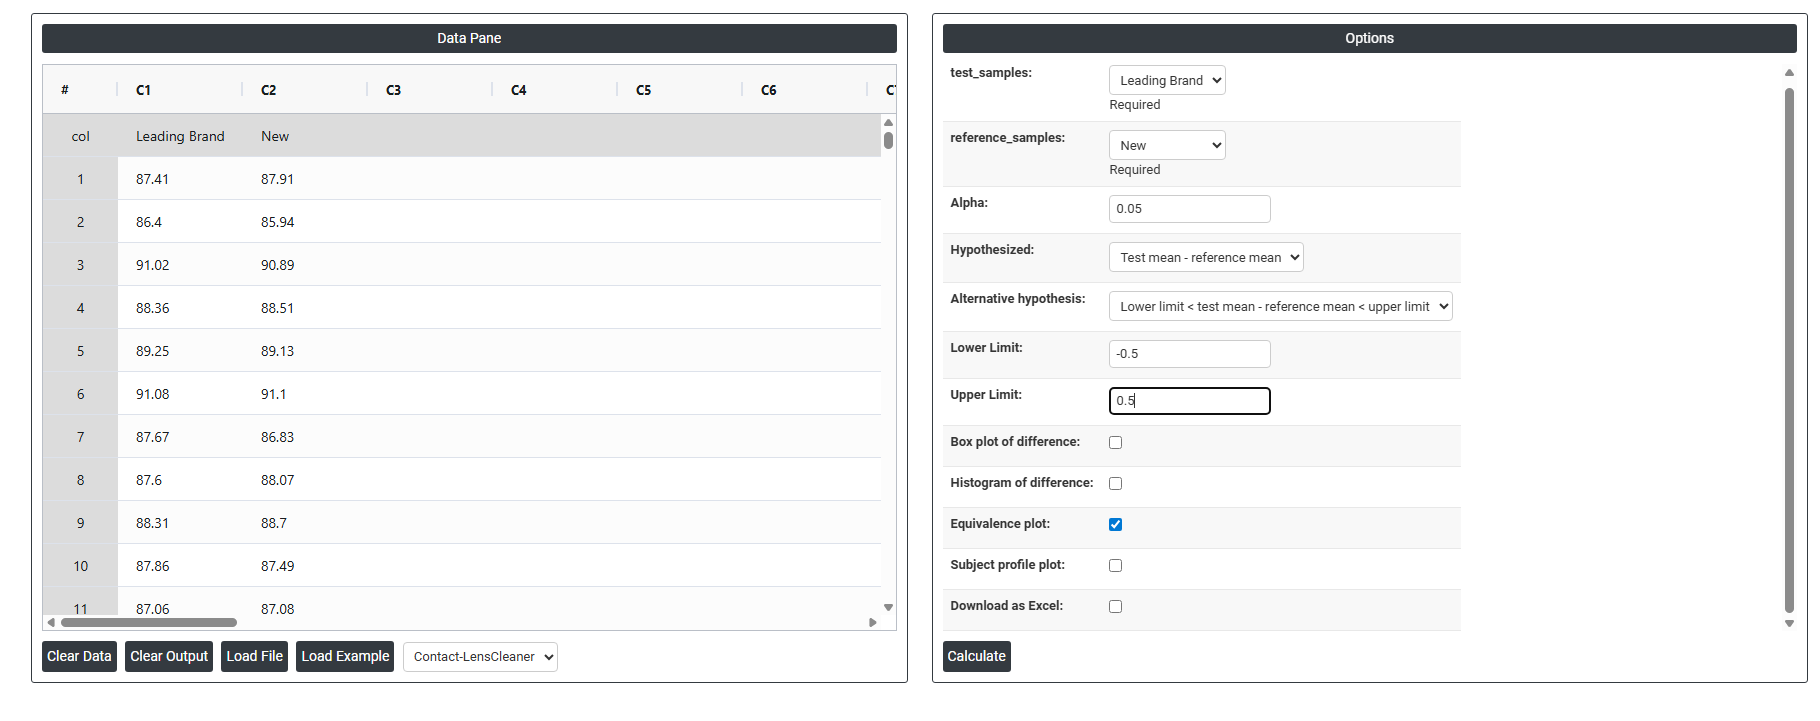
- Inside the tool, feeds the data along with other inputs as follows:
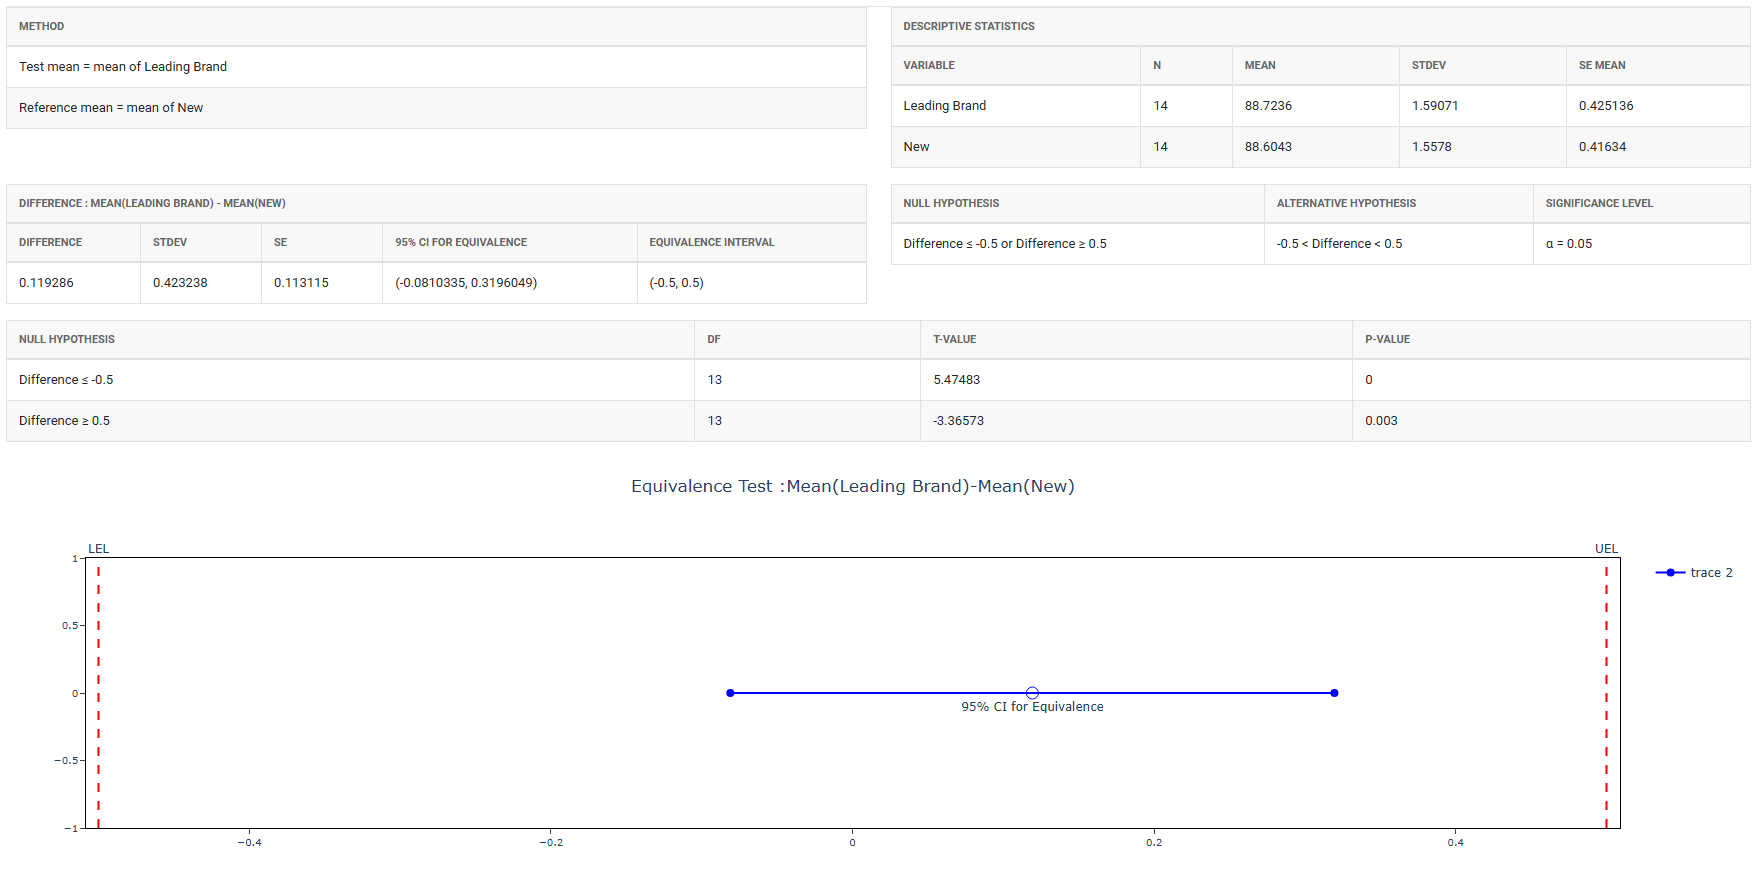
5. After using the above mentioned tool, fetches the output as follows:
How to do Paired Equivalence Test
The guide is as follows:
- Login in to QTools account with the help of https://qtools.zometric.com/ or https://intelliqs.zometric.com/
- On the home page, choose Statistical Tool> Hypothesis Test >Paired Equivalence Test .
- Next, update the data manually or can completely copy (Ctrl+C) the data from excel sheet and paste (Ctrl+V) it here.
- Fill the required options.
- Finally, click on calculate at the bottom of the page and you will get desired results.
On the dashboard of Paired Equivalence Test, the window is separated into two parts.
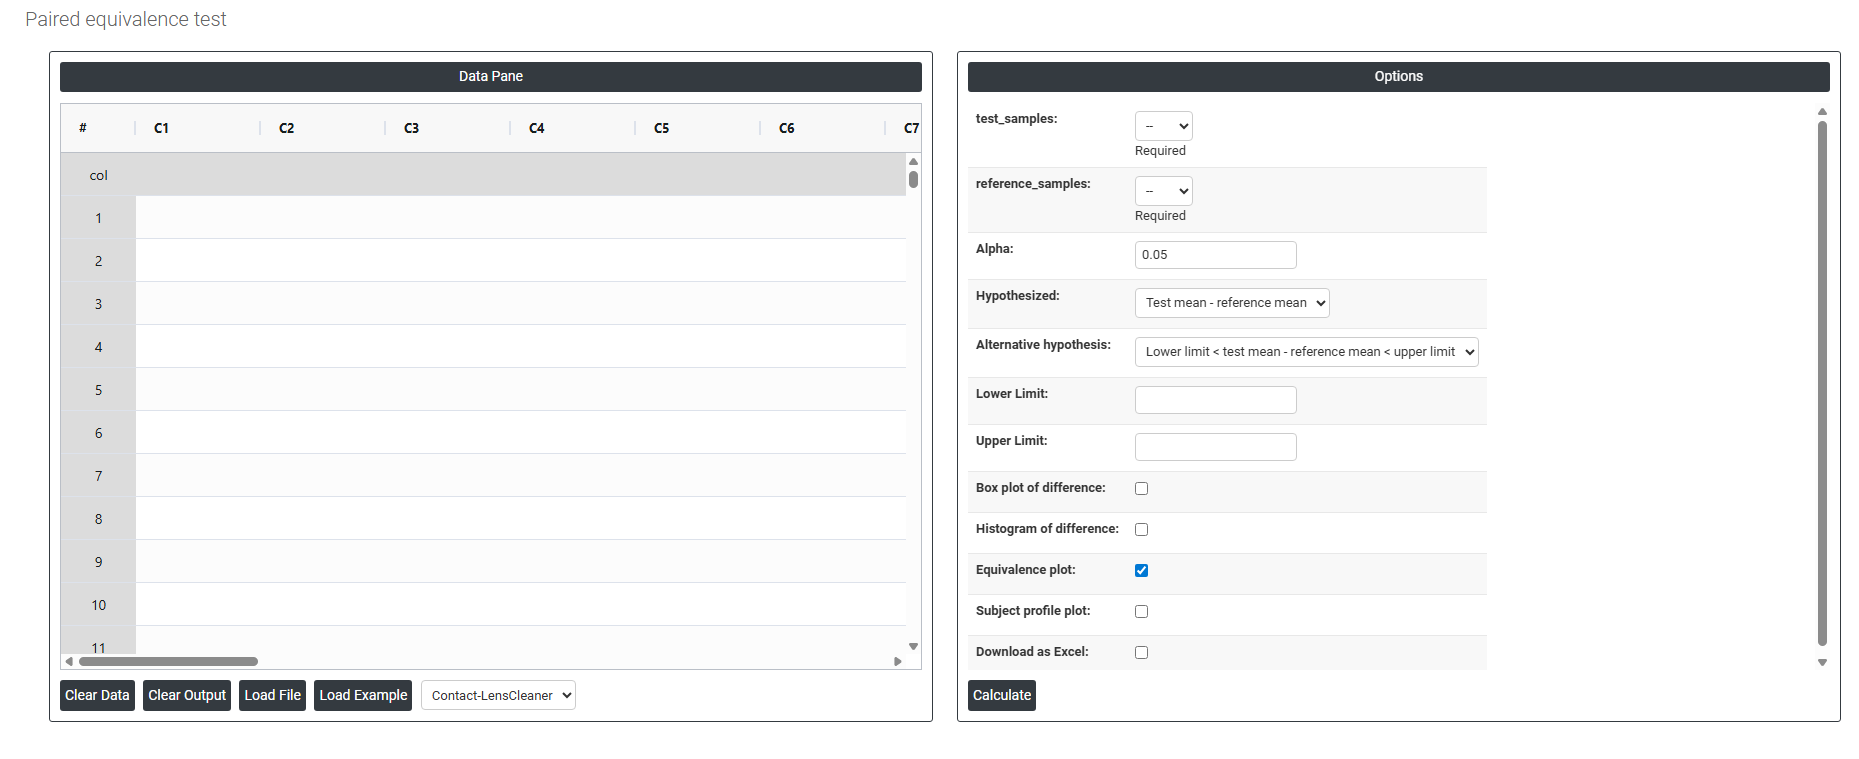
On the left part, Data Pane is present. In the Data Pane, each row makes one subgroup. Data can be fed manually or the one can completely copy (Ctrl+C) the data from excel sheet and paste (Ctrl+V) it here.
Load example: Sample data will be loaded.
Load File: It is used to directly load the excel data.
On the right part, there are many options present as follows:
- Test Samples Select the column containing measurements from the new or alternative method being evaluated — for example, readings from a new instrument, a new formulation, or an updated process. This is the method you want to prove is equivalent to the established reference. This field is required.
- Reference Samples Select the column containing measurements from the established or standard method that the test sample is being compared against — for example, readings from the current instrument, the existing formulation, or the original process. Each observation in this column must be directly paired with the corresponding observation in the Test Samples column — meaning both measurements were taken on the same subject, sample, or part. This field is required.
- Alpha Sets the significance level for the equivalence test. The standard default is 0.05, meaning there is a 5% risk of incorrectly concluding equivalence when the two methods are not truly equivalent. A smaller alpha (e.g. 0.01) makes the test more conservative and requires stronger evidence before concluding equivalence. Alpha must be defined before collecting data.
- Hypothesized (Test Mean − Reference Mean) The expected or assumed difference between the test method and the reference method. In most equivalence studies this is set to 0, meaning you assume the two methods should produce identical results on average. If a known systematic offset is expected between the two methods, that value can be entered here instead.
- Alternative Hypothesis Defines what the test is trying to prove. The standard form is:
- Lower Limit < Test Mean − Reference Mean < Upper Limit — confirms that the true average difference between the test and reference methods falls entirely within the acceptable equivalence boundaries. Equivalence is only concluded when the confidence interval for the difference is completely contained within both limits simultaneously.
- Lower Limit The minimum acceptable difference between the test and reference methods. This defines the lower boundary of the equivalence interval — any average difference smaller than this value would mean the test method falls unacceptably below the reference. This value must be set based on scientific, regulatory, or practical knowledge before the analysis is run, not derived from the data itself.
- Upper Limit The maximum acceptable difference between the test and reference methods. This defines the upper boundary of the equivalence interval — any average difference larger than this value would mean the test method produces unacceptably higher results than the reference. Together with the Lower Limit, it forms the complete equivalence window that the observed difference must fall within to declare the two methods equivalent.
- Box Plot of Difference When enabled, displays a box-and-whisker plot of the paired differences (test minus reference) for each observation. This gives a quick visual summary of the centre, spread, and shape of the differences — helping you assess whether the differences are consistently close to zero or whether there is a systematic offset between the two methods.
- Histogram of Difference When enabled, displays a histogram showing the distribution of the paired differences. This is useful for checking whether the differences are approximately normally distributed — which is an assumption of the paired equivalence test — and for identifying any unusual patterns or skewness in the difference values.
- Equivalence Plot When enabled, displays the primary results plot for the equivalence test — showing the confidence interval for the mean difference alongside the equivalence boundaries (lower and upper limits). If the entire confidence interval falls within the boundaries, equivalence is confirmed. This is the most important visual output of the test and should always be reviewed alongside the p-value.
- Subject Profile Plot When enabled, displays individual line plots connecting each paired observation — showing how the test measurement and reference measurement compare for every subject, sample, or part. This helps identify whether the difference between the two methods is consistent across all pairs or whether it varies for certain subjects, which could indicate interactions or inconsistent method performance.
- Download as Excel Exports all test results, paired differences, confidence intervals, equivalence boundaries, and p-values into an Excel file for reporting, regulatory submission, or record keeping.