What is Parametric Growth Curve ?
Parametric Growth Curve analysis models how the failure rate of a repairable system changes over time as the system accumulates operating hours and undergoes repairs. It determines whether the system is improving (decreasing failure rate), deteriorating (increasing failure rate), or stable using models such as the Non-Homogeneous Poisson Process with Power Law (Crow-AMSAA).
Simple Definitions: A statistical model for repairable systems that reveals whether repairs are making the system more reliable over time, whether it is wearing out, or whether the failure rate is holding steady.
When to use Parametric Growth Curve?
- Use when analysing repairable systems that fail and are repaired multiple times such as machinery, vehicles, or complex equipment.
- Use to determine whether reliability is improving, degrading, or stable over operating life.
- Use for maintenance planning, spare parts forecasting, and reliability improvement programmes.
Guidelines for correct usage of Parametric Growth Curve
- Record all failure times and repair times accurately missing times distort the growth curve.
- Verify model fit using goodness-of-fit tests such as Cramer-von Mises before drawing conclusions.
- Use Laplace's test to confirm whether reliability is genuinely improving or deteriorating before assuming a trend.
Alternatives: When not to use Parametric Growth Curve
- If items are non-repairable (replaced on failure), use Parametric Distribution Analysis
- If the failure rate is confirmed constant, a simple Exponential distribution model may be sufficient.
Example of Parametric Growth Curve
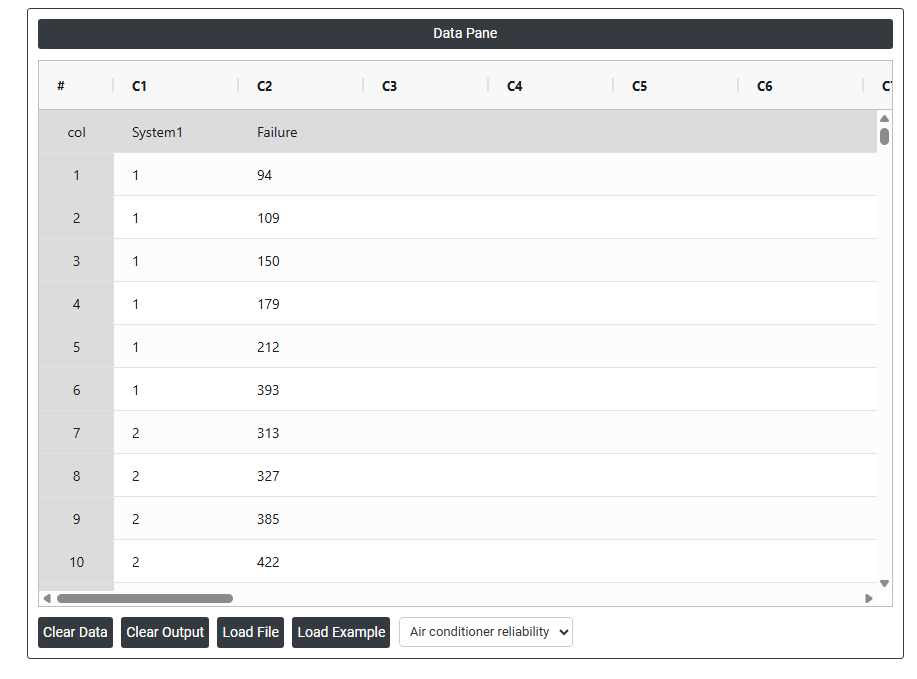
A reliability engineer is analyzing the failure rate of air conditioning units used in 13 commercial jet planes. Each unit was repaired and returned to service after failure. The engineer aims to determine if the failure rate is increasing, decreasing, or constant over time, using exact failure time data without any units being retired from service. All the data are exact failure times. The following steps:
- Gathered the necessary data.
2. Now analyses the data with the help of https://qtools.zometric.com/ or https://intelliqs.zometric.com/.
3. To find Parametric Growth Curve choose https://intelliqs.zometric.com/> Statistical module> Reliability>Parametric Growth Curve.
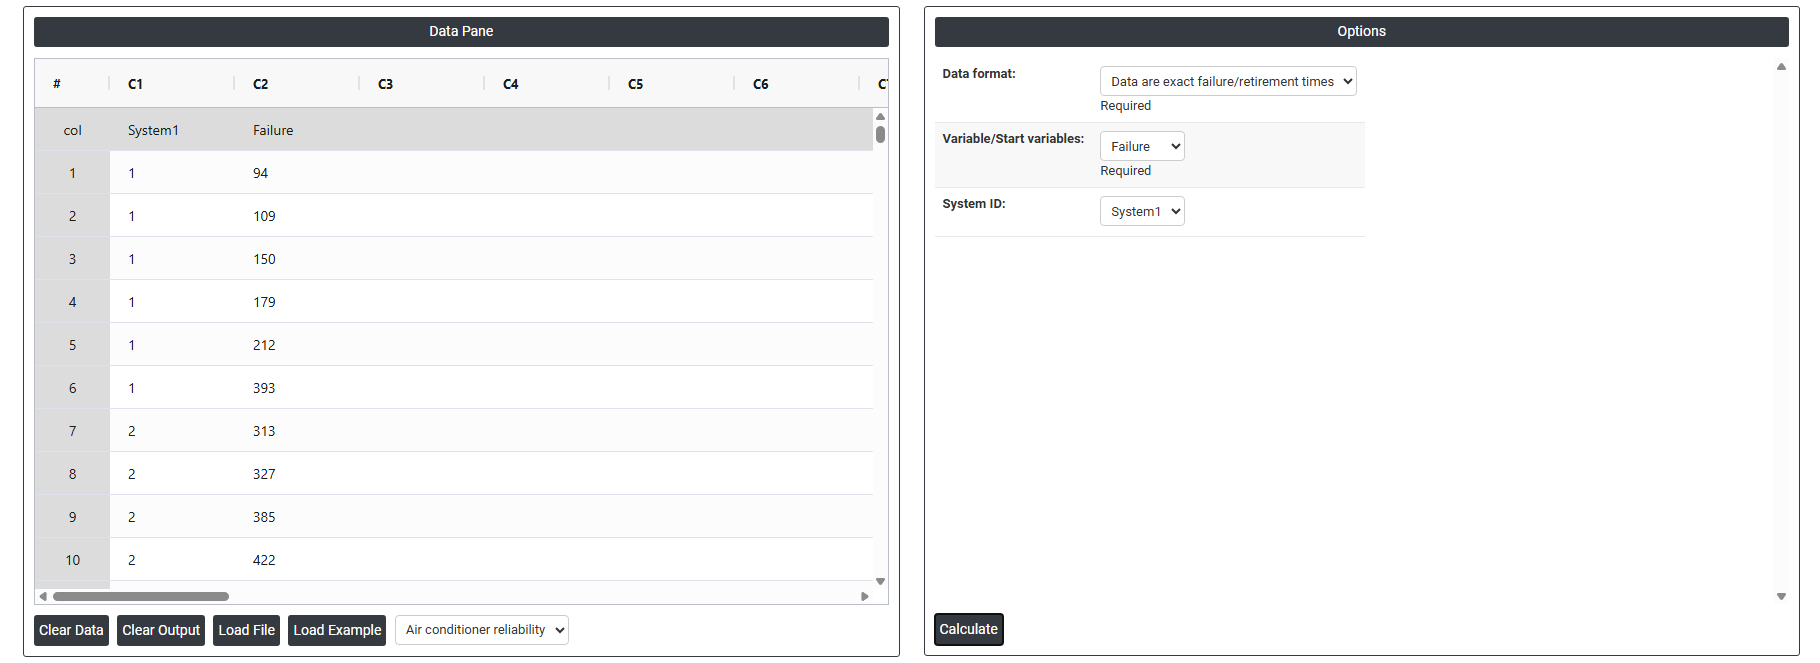
4. Inside the tool, feed the data along with other inputs as follows:
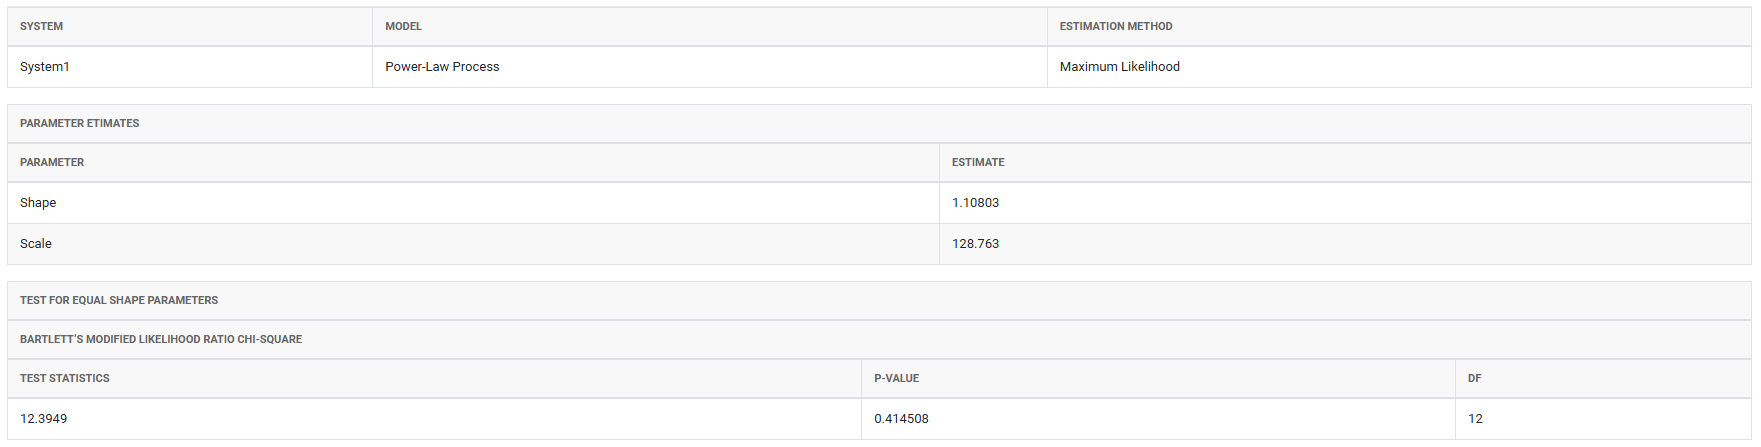
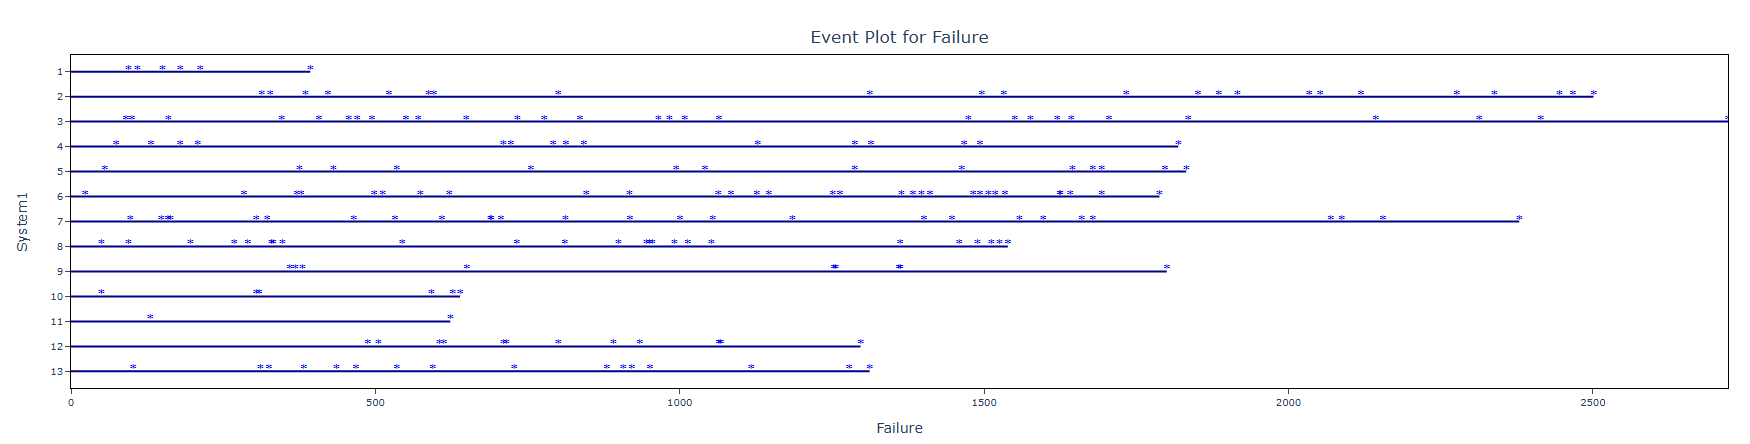
5. After using the above mentioned tool, fetches the output as follows:
How to do Parametric Growth Curve
The guide is as follows:
- Login in to QTools account with the help of https://qtools.zometric.com/ or https://intelliqs.zometric.com/
- On the home page, choose Statistical Tool> Reliability>Parametric Growth Curve.
- Next, update the data manually or can completely copy (Ctrl+C) the data from excel sheet or paste (Ctrl+V) it or else there is say option Load Example where the example data will be loaded.
- Next, you need to fill the required options.
- Finally, click on calculate at the bottom of the page and you will get desired results.
On the dashboard of Parametric Growth Curve, the window is separated into two parts.
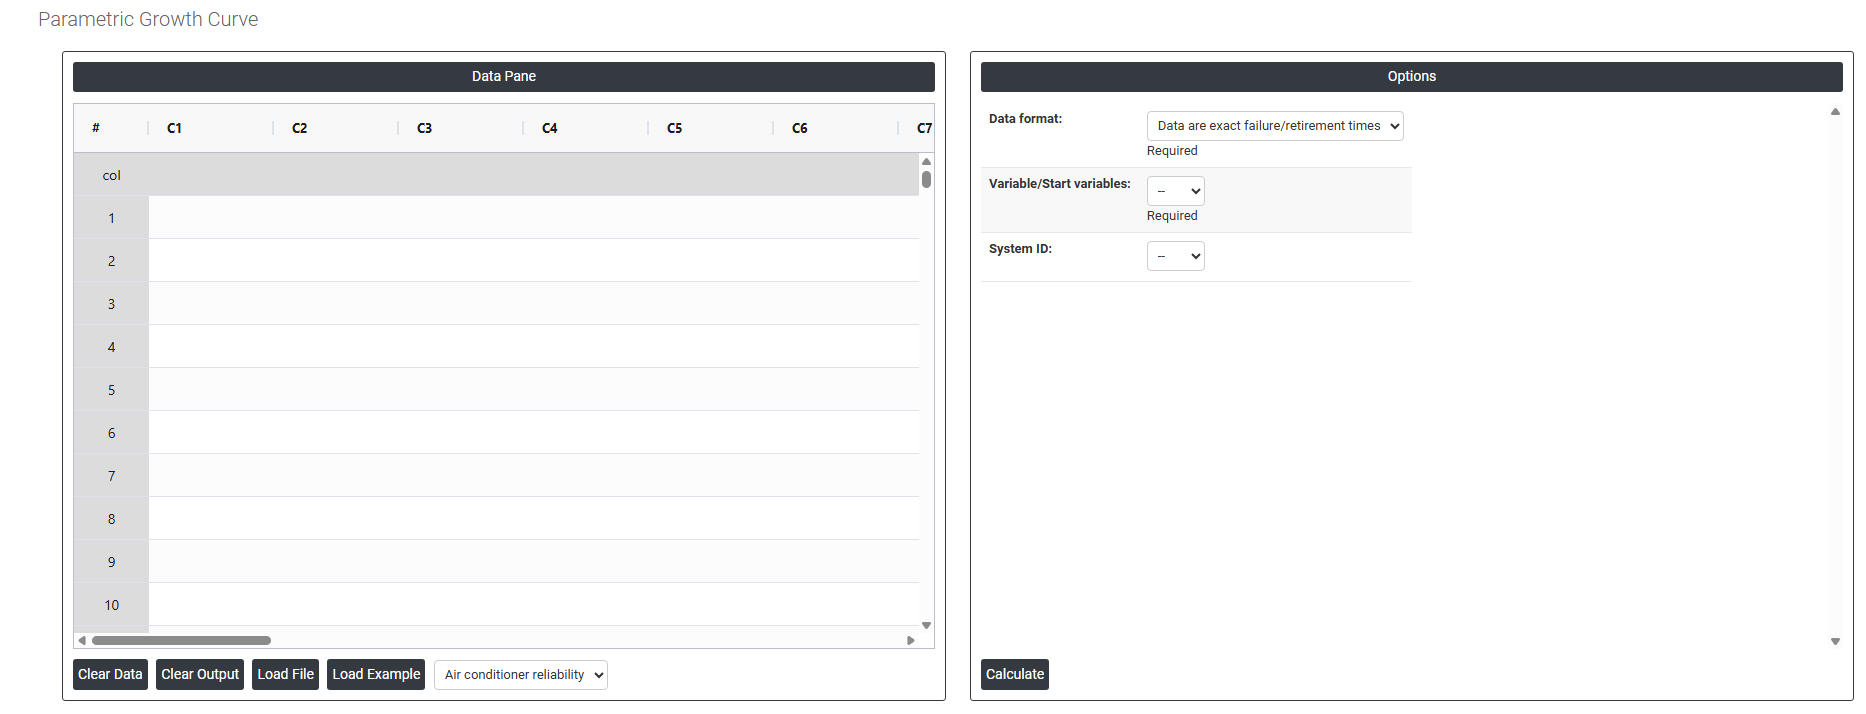
On the left part, Data Pane is present. In the Data Pane, each row makes one subgroup. Data can be fed manually or the one can completely copy (Ctrl+C) the data from excel sheet and paste (Ctrl+V) it here.
Load example: Sample data will be loaded.
On the right part, there are many options present as follows:
- Data Format: Defines how the failure time data is structured. Data are exact failure/retirement times means each observation in the dataset is the precise time at which a failure occurred or the system was retired from service as opposed to interval-censored data where only the time window of failure is known.
- Variable / Start Variables: Select the column containing the exact failure or retirement times for each event recorded on the repairable system. For interval data, this would be the start of the time interval containing the failure.
- System ID: Select the column that identifies which repairable system each failure time belongs to used when data from multiple systems is combined in the same dataset. The growth curve is then estimated separately or jointly for each identified system.