What is Partial Least Square?
When to use Partial Least Square?
Predictor Variables
- Best suited when you have many predictors that are highly correlated with each other
- Predictors must be continuous
- If predictors are few and not highly correlated, use Fit Regression Model instead
- If only one predictor is present, use Fit Line Model instead
Response Variable
- Can handle one or more continuous response variables simultaneously
- If the response is categorical → use the appropriate Logistic Regression model
Guidelines for correct usage of Partial Least Square
- Use PLS when predictors are highly correlated (multicollinear) or when the number of predictors is large compared to the sample size; standard regression becomes unstable in these conditions.
- All predictors and response variables must be continuous; categorical variables are not suitable for this method.
- Ensure the data accurately represents the target population; poor data quality will produce unreliable components and predictions.
- Collect sufficient observations — having far fewer observations than predictors makes standard regression fail, which is one of the key scenarios where PLS is most valuable.
- Select the appropriate number of components carefully — too few components miss important variation, while too many overfit the data. Use cross-validation to guide this decision.
- Measure all variables as accurately as possible; PLS is sensitive to noise when the number of components is high.
- After fitting, validate the model using predicted R-squared and cross-validation statistics to confirm the model generalizes well beyond the training data.
Alternatives: When not to use Partial Least Square
- If predictors are few and not highly correlated, use Fit Regression Model instead for simpler and more interpretable results.
- If you have only one continuous predictor, use Fit Line Model instead.
- If the response is categorical with two categories, use Fit Binary Logistic Model instead.
- If the response has three or more ordered categories, use Ordinal Logistic Regression instead.
- If the response has three or more unordered categories, use Nominal Logistic Regression instead.
- If the goal is to test measurement equivalence between two methods, use Orthogonal Regression instead.
Example of Partial Least Square
A wine producer seeks to understand how the chemical composition of their Pinot Noir wine influences its sensory evaluation. The dataset comprises 37 Pinot Noir samples, each characterized by concentrations of 17 elements (Cd, Mo, Mn, Ni, Cu, Al, Ba, Cr, Sr, Pb, B, Mg, Si, Na, Ca, P, K) and an aroma score assessed by a panel of judges. The objective is to develop a predictive model for the aroma score using the elemental concentrations. Additionally, the producer wants to include all the elemental concentrations as predictors, along with all two-way interactions involving cadmium (Cd). Given the relatively small sample size compared to the number of predictors, partial least squares (PLS) regression is chosen as the modeling approach. To evaluate this, performs the following steps:
- Gathered the necessary data.
- Now analyses the data with the help of https://qtools.zometric.com/ or https://intelliqs.zometric.com/.
- To find Partial Least Square choose https://intelliqs.zometric.com/> Statistical module> Regression>Partial Least Square.
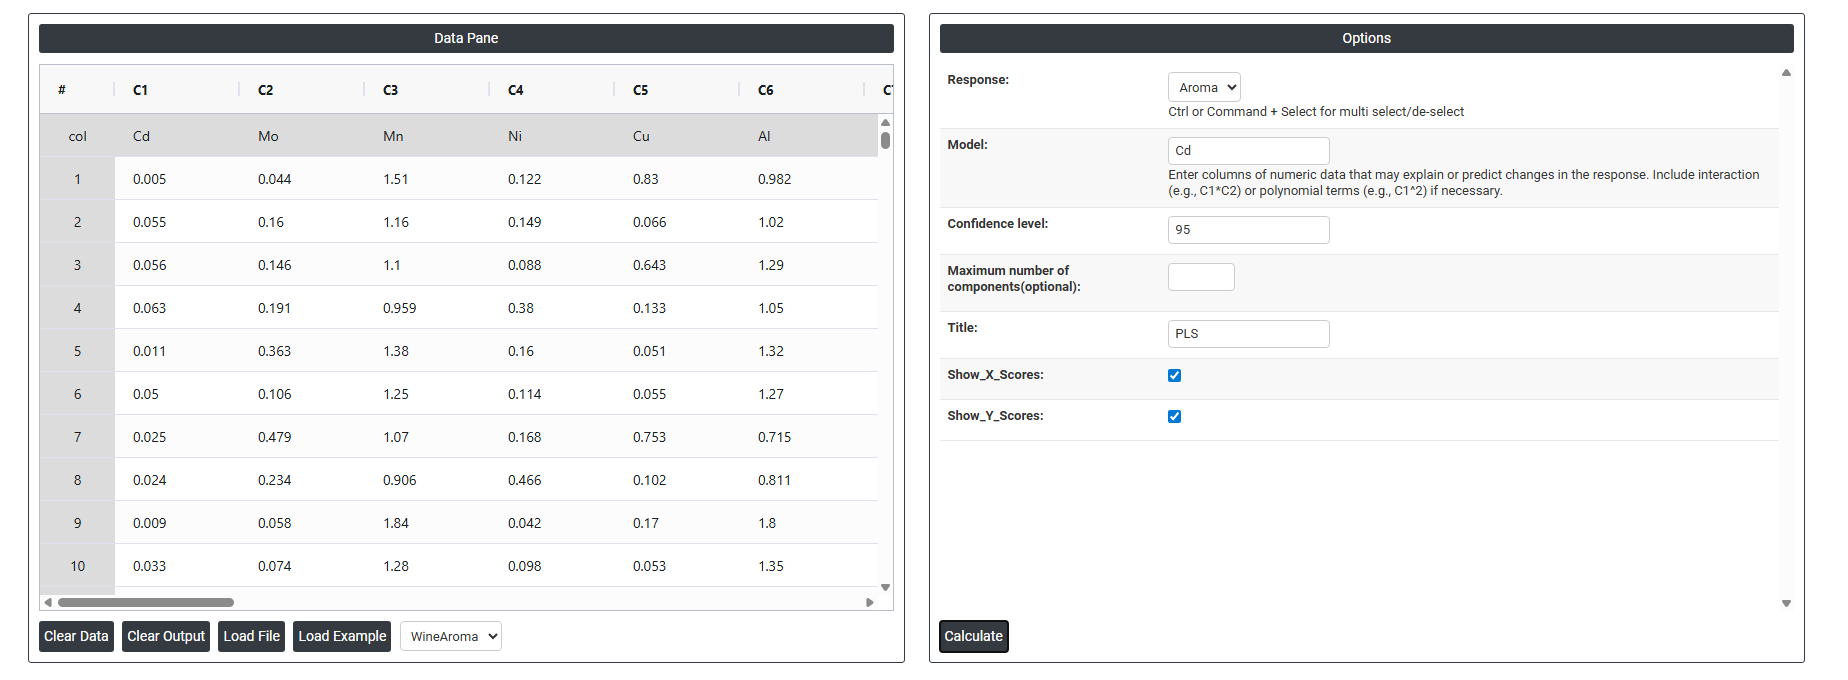
- Inside the tool, feeds the data along with other inputs as follows:
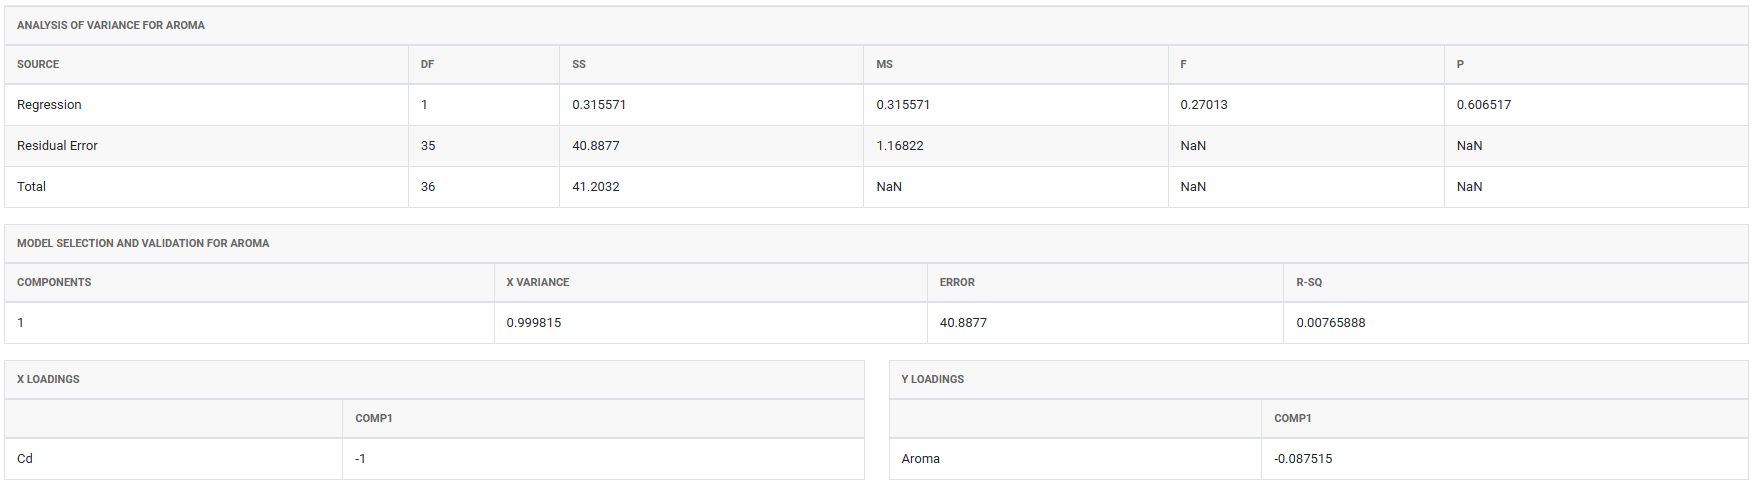
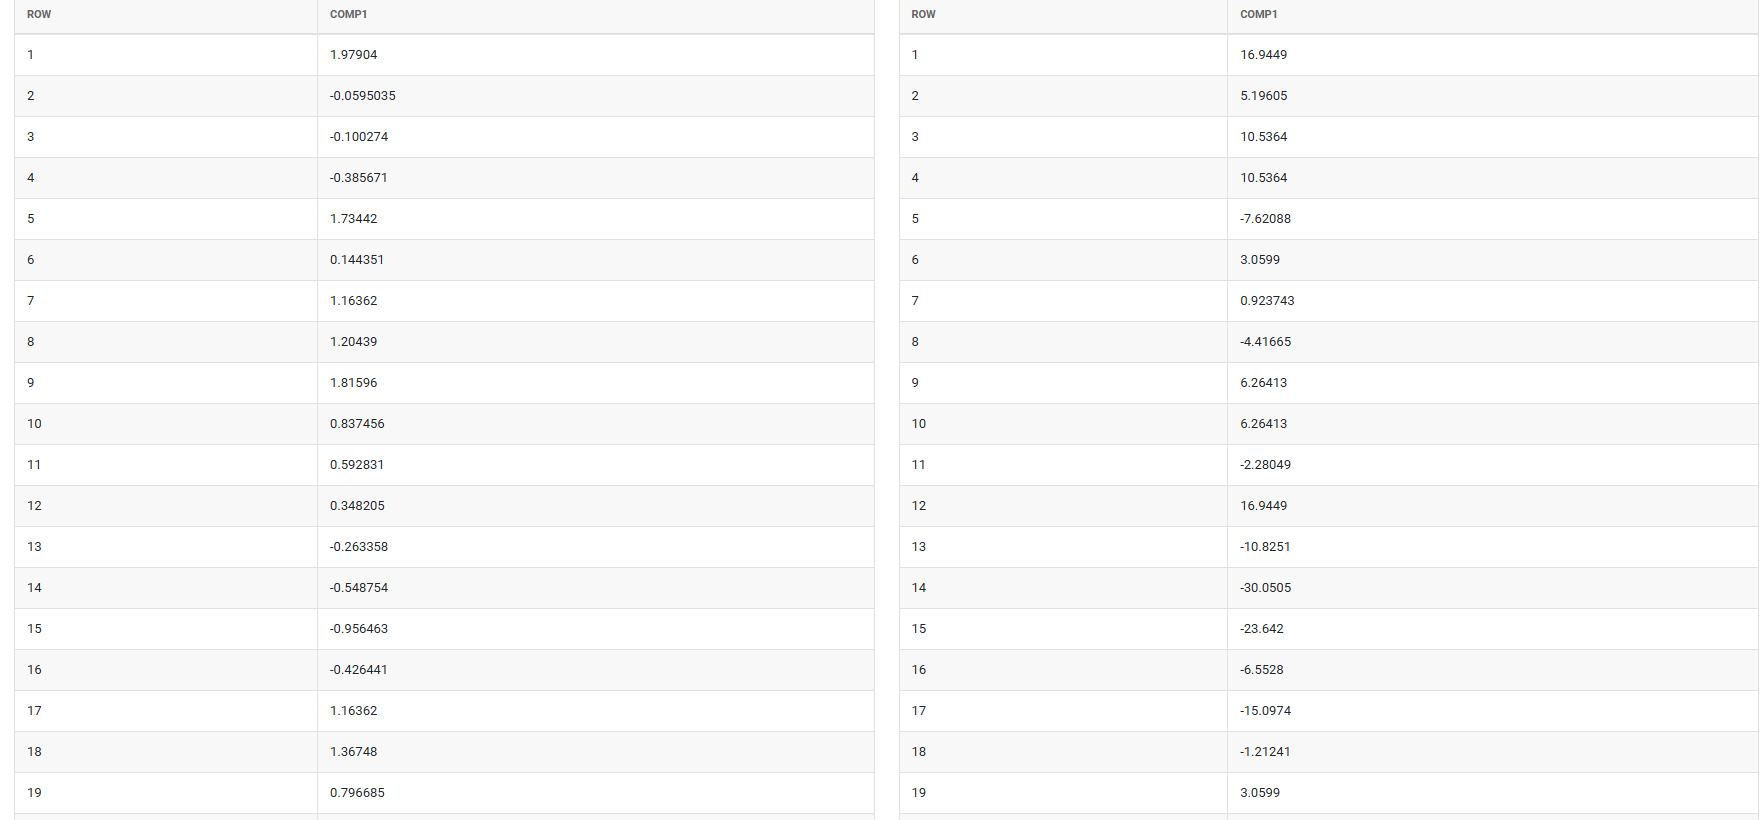
5. After using the above mentioned tool, fetches the output as follows:
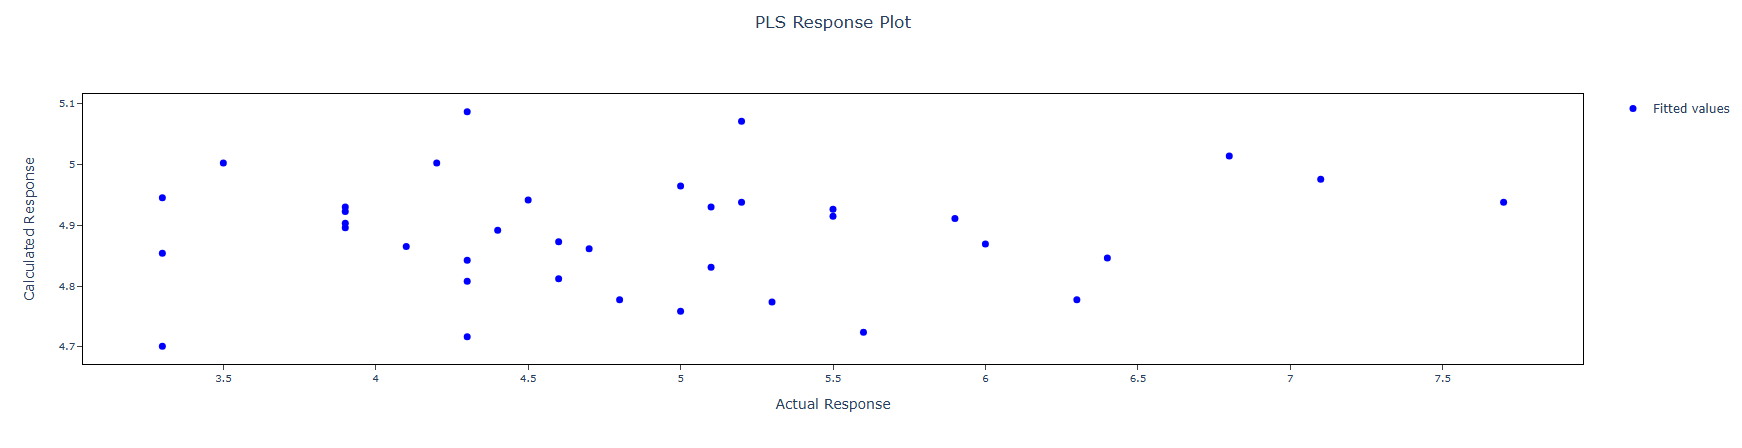
How to do Partial Least Square
The guide is as follows:
- Login in to QTools account with the help of https://qtools.zometric.com/ or https://intelliqs.zometric.com/
- On the home page, choose Statistical Tool>Regression >Partial Least Square .
- Click on Partial Least Square and reach the dashboard.
- Next, update the data manually or can completely copy (Ctrl+C) the data from excel sheet and paste (Ctrl+V) it here.
- Fill the required options given on the left side.
- Finally, click on calculate at the bottom of the page and you will get desired results.
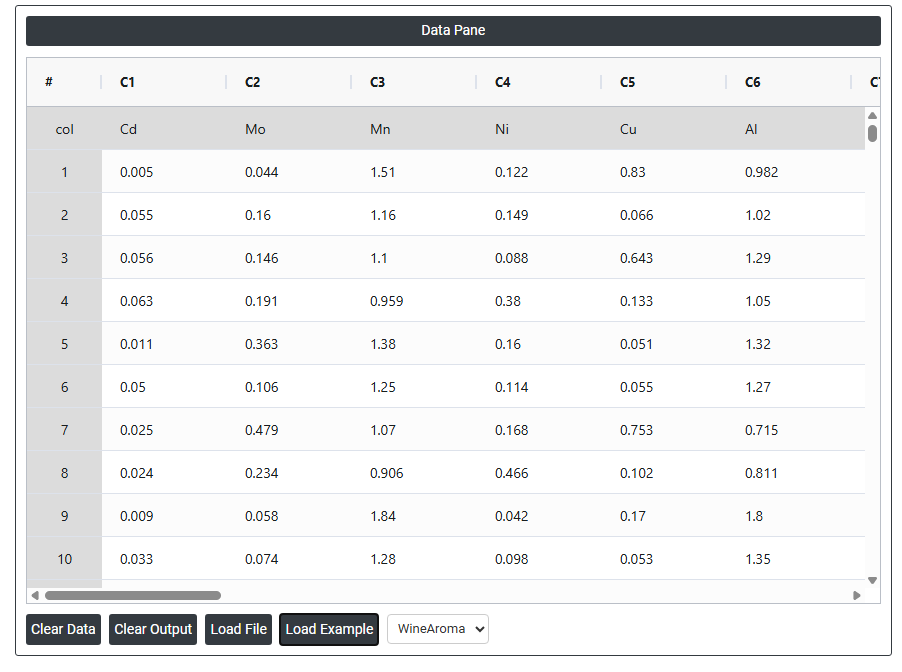
On the dashboard of Partial Least Square, the window is separated into two parts.
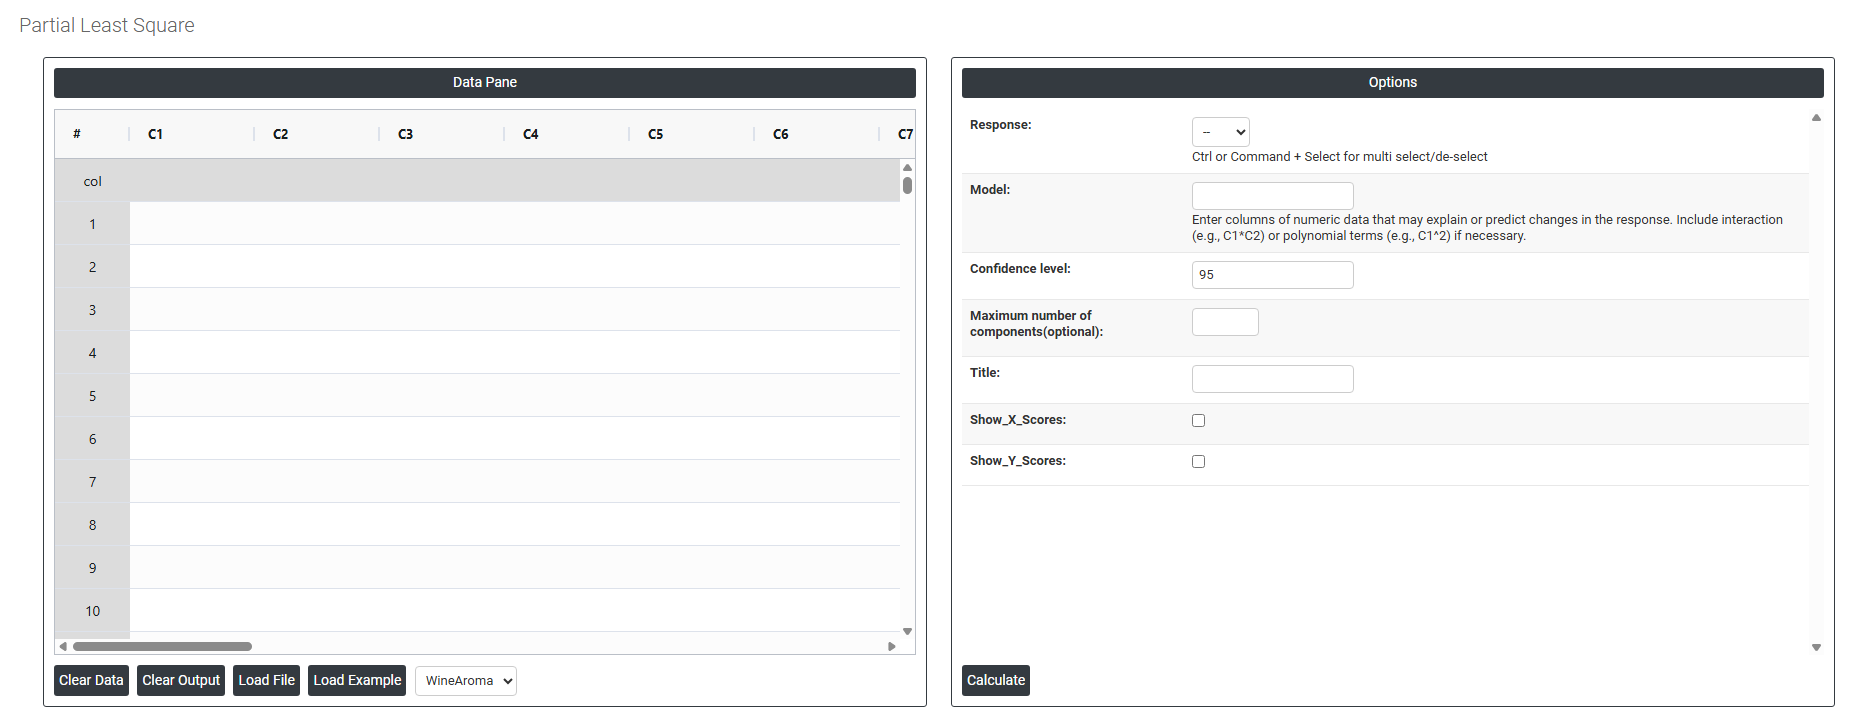
On the left part, Data Pane is present. In the Data Pane, each row makes one subgroup. Data can be fed manually or the one can completely copy (Ctrl+C) the data from excel sheet and paste (Ctrl+V) it here.
Load example: Sample data will be loaded.
Load File: It is used to directly load the excel data.
On the right part, there are many options present as follows:
-
Response: The outcome variable or variables you want to predict must be continuous. PLS is unique in that it can handle multiple response variables at the same time, making it useful when several outputs need to be modeled together using the same set of predictors.
-
Model: Defines which predictors and interaction terms are included in the analysis. By default, a main effects model is built using all selected predictors. You can add interaction terms (e.g. A*B) if two predictors are believed to jointly influence the response. Keeping the model appropriately simple avoids overfitting, especially when the number of predictors is large.
-
Confidence Interval: A range within which the true value of a predicted response or coefficient is likely to fall. The default is 95%, meaning you are 95% confident the true value lies within the displayed range. This default is used because it meets the widely accepted standard for statistical reliability across most industries and research fields.
-
Maximum Number of Components (Optional): Controls how many PLS components the model extracts from the predictors. Each component captures a portion of the variation in both predictors and response. Setting this too low misses important patterns; setting it too high risks overfitting the data. If left blank, the analysis determines the optimal number automatically using cross-validation.
-
Title: A custom label you can assign to the analysis output. This is useful when running multiple analyses on the same dataset, allowing you to distinguish between different model runs clearly in your results.
-
Show X Scores: Displays a plot of the component scores for the predictor variables. This helps you visually identify patterns, groupings, or outliers in the predictor data after the PLS components have been extracted — useful for understanding the structure within your input variables.
-
Show Y Scores: Displays a plot of the component scores for the response variables. This helps you assess how well the PLS components capture the variation in the response and whether any unusual observations or groupings exist on the output side of the model.