What is Pre Process Warranty Data ?
Pre-Process Warranty Data prepares raw warranty field return data for reliability analysis. Warranty data is typically recorded as return counts per period alongside units in service, and must be restructured into individual failure times and censoring indicators before statistical models can be applied. This tool converts period-by-period return counts into a properly formatted reliability dataset.
Simple Definitions: A data preparation tool that converts raw warranty return records reported as counts per period into individual failure time records ready for statistical reliability analysis.
When to use Pre Process Warranty Data?
- Use when warranty return data is recorded as counts per time period and needs converting to individual failure times.
- Use as the mandatory first step before running Warranty Prediction or Parametric Distribution Analysis on field return data.
- Use when data includes in-service population (exposure) counts alongside return counts.
Guidelines for correct usage of Pre Process Warranty Data
- Ensure in-service population counts are accurate incorrect exposure data distorts all downstream reliability estimates.
- Correctly identify units that have not yet failed as right-censored omitting censored units biases estimates toward shorter failure times.
- Exclude returns for non-failure reasons such as customer misuse or cosmetic issues from the reliability dataset.
Alternatives: When not to use Pre Process Warranty Data
- If data is already in individual failure time format, skip this step and go directly to Parametric Distribution Analysis.
- If no exposure (population) data is available, this tool cannot be used accurately collect or estimate population data
Example of Pre Process Warranty Data
A reliability engineer aims to forecast warranty claims resulting from defective refrigerator compressors by analyzing monthly failure data from the past year. Since the raw field data is organized in a triangular matrix, the engineer uses Pre-Process Warranty Data to convert it into a standard time-to-failure format required for effective warranty analysis. The following steps:
- Gathered the necessary data.
2. Now analyses the data with the help of https://qtools.zometric.com/ or https://intelliqs.zometric.com/.
3. To find Pre Process Warranty Data choose https://intelliqs.zometric.com/> Statistical module> Reliability>Pre Process Warranty Data.
4. Inside the tool, feed the data along with other inputs as follows:
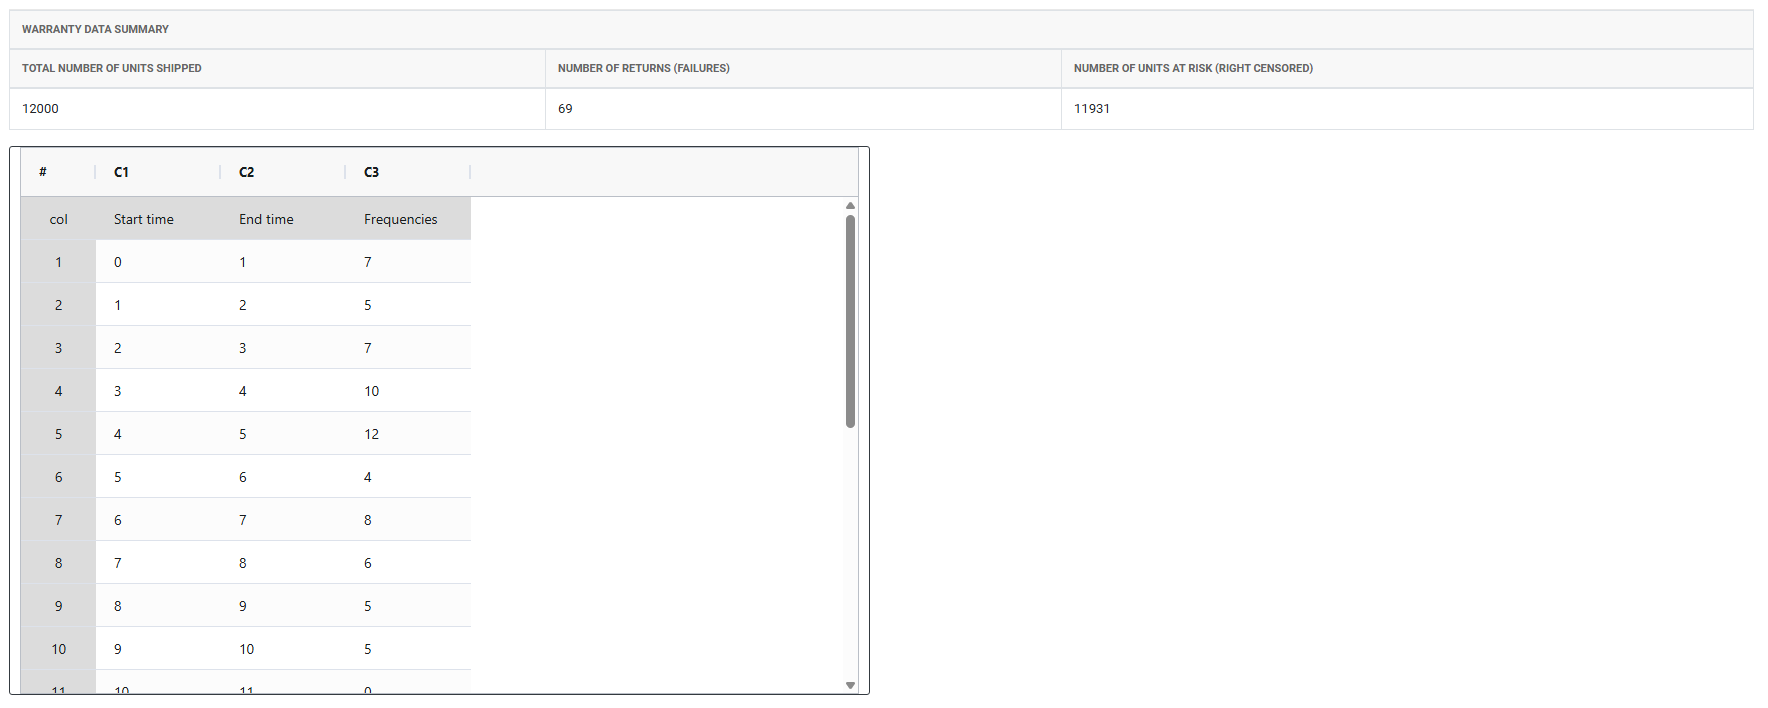
5. After using the above mentioned tool, fetches the output as follows:
How to do Pre Process Warranty Data
The guide is as follows:
- Login in to QTools account with the help of https://qtools.zometric.com/ or https://intelliqs.zometric.com/
- On the home page, choose Statistical Tool> Reliability>Pre Process Warranty Data.
- Next, update the data manually or can completely copy (Ctrl+C) the data from excel sheet or paste (Ctrl+V) it or else there is say option Load Example where the example data will be loaded.
- Next, you need to fill the required options.
- Finally, click on calculate at the bottom of the page and you will get desired results.
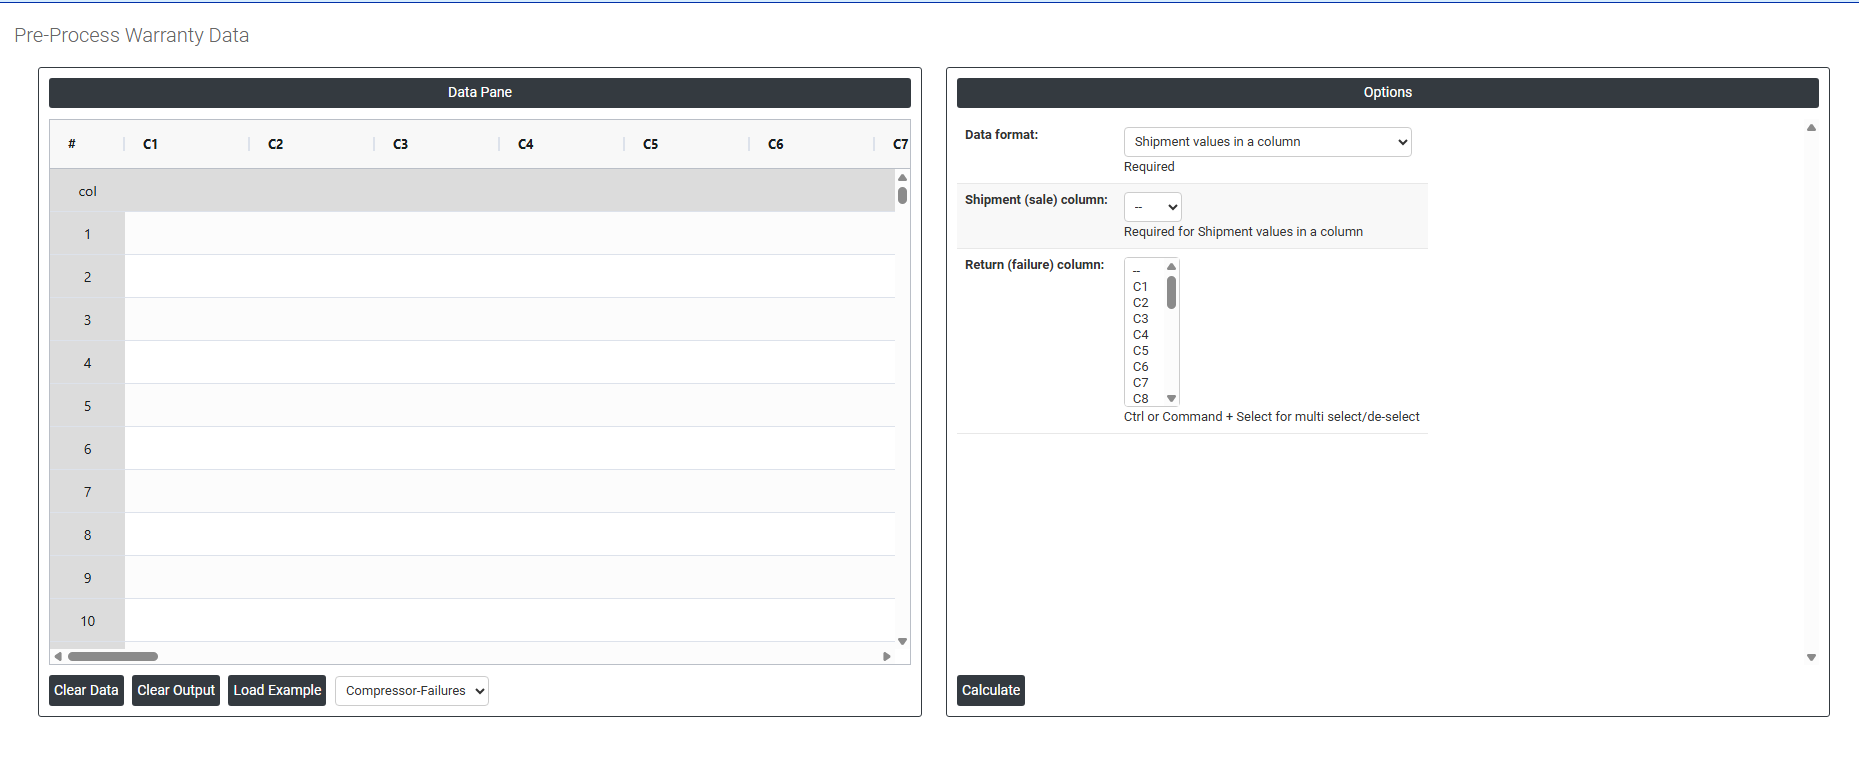
On the dashboard of Pre Process Warranty Data, the window is separated into two parts.
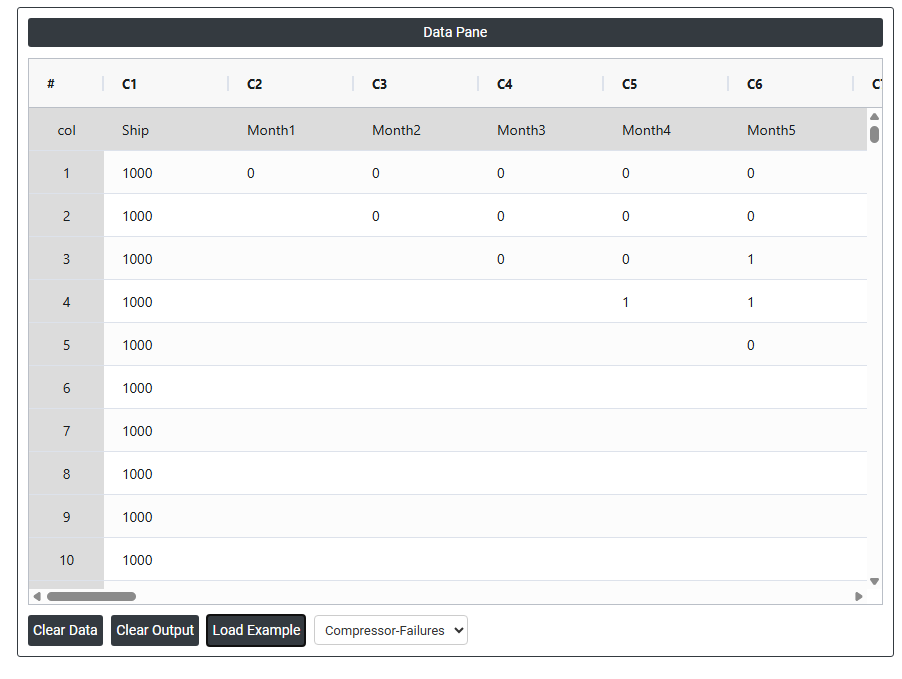
On the left part, Data Pane is present. In the Data Pane, each row makes one subgroup. Data can be fed manually or the one can completely copy (Ctrl+C) the data from excel sheet and paste (Ctrl+V) it here.
Load example: Sample data will be loaded.
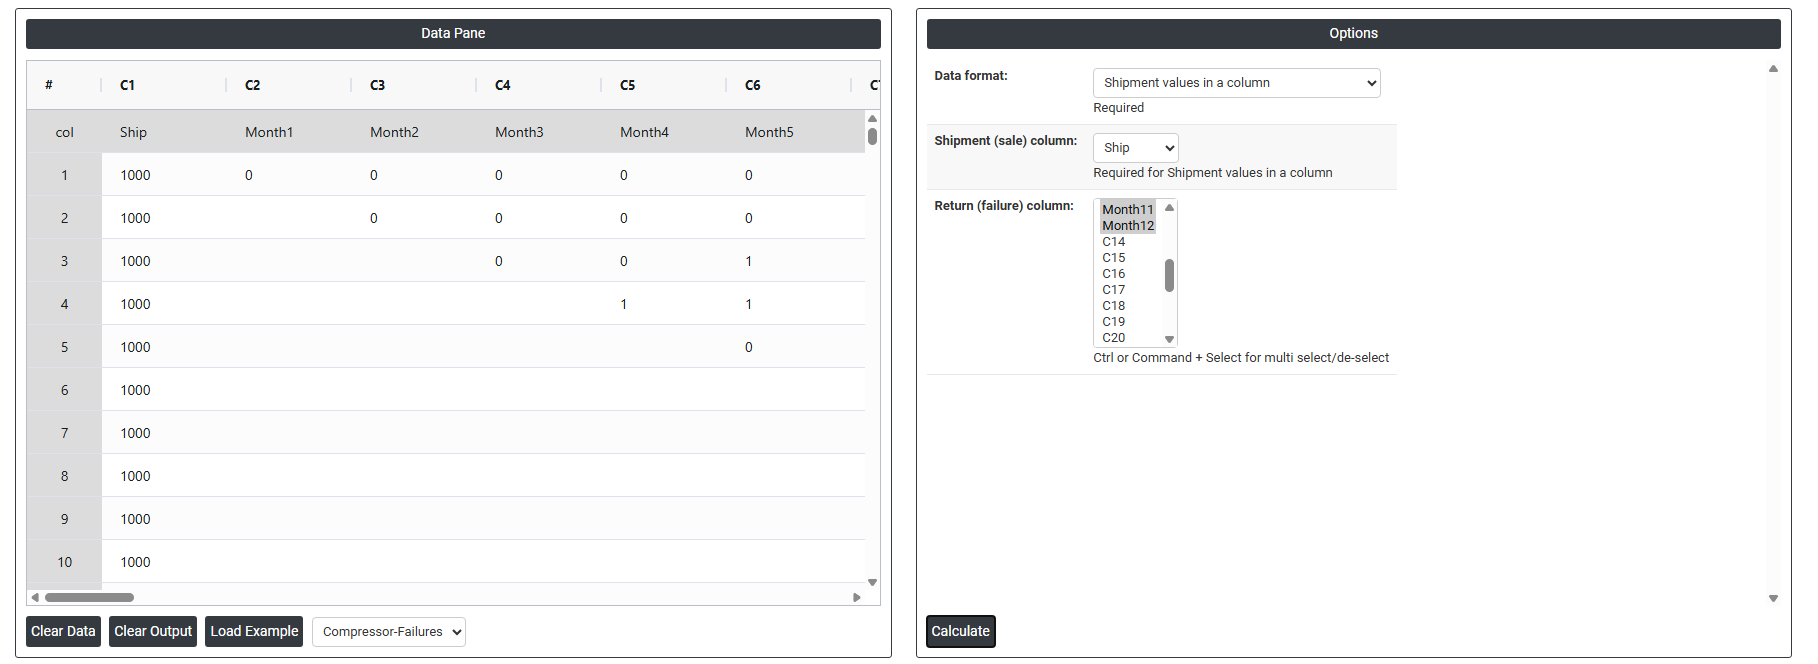
On the right part, there are many options present as follows:
- Data Format: Defines how the warranty and shipment data is structured in the worksheet. Two options:
- Shipment values in a column — each row represents a time period, with shipment counts and return counts stored in separate columns running down the worksheet.
- Shipment values in first row of first column — shipment data is arranged horizontally across the first row, with return data filling the rows below a matrix layout sometimes used in warranty reporting systems.
- Shipment (Sale) Column: Select the column containing the number of units shipped (sold) in each time period. This represents the population of units entering the field and at risk of returning under warranty.
- Return (Failure) Column: Select the column containing the number of warranty returns received in each corresponding time period. These are the observed failures used to estimate the failure time distribution.