Process Capability (Normal Distribution)
Process capability is a statistical measure of a manufacturing process's ability to produce parts that meet predefined specifications or tolerances. It quantifies the inherent variability of a process characteristic, such as dimensions or weight, to determine how consistently the process can produce within the specified limits.
Last reviewed
Key takeaway
Process capability is a statistical measure of a manufacturing process's ability to produce parts that meet predefined specifications or tolerances.
On this page
- What is Process Capability (For Normal Distribution)?
- When to use Process Capability?
- Guidelines for correct usage of Process Capability (Normal Distribution)
- Alternatives: When not to use Process Capability (Normal Distribution)
- Example of Process Capability (Normal Distribution)?
- How to do Process Capability .
What is Process Capability (For Normal Distribution)?
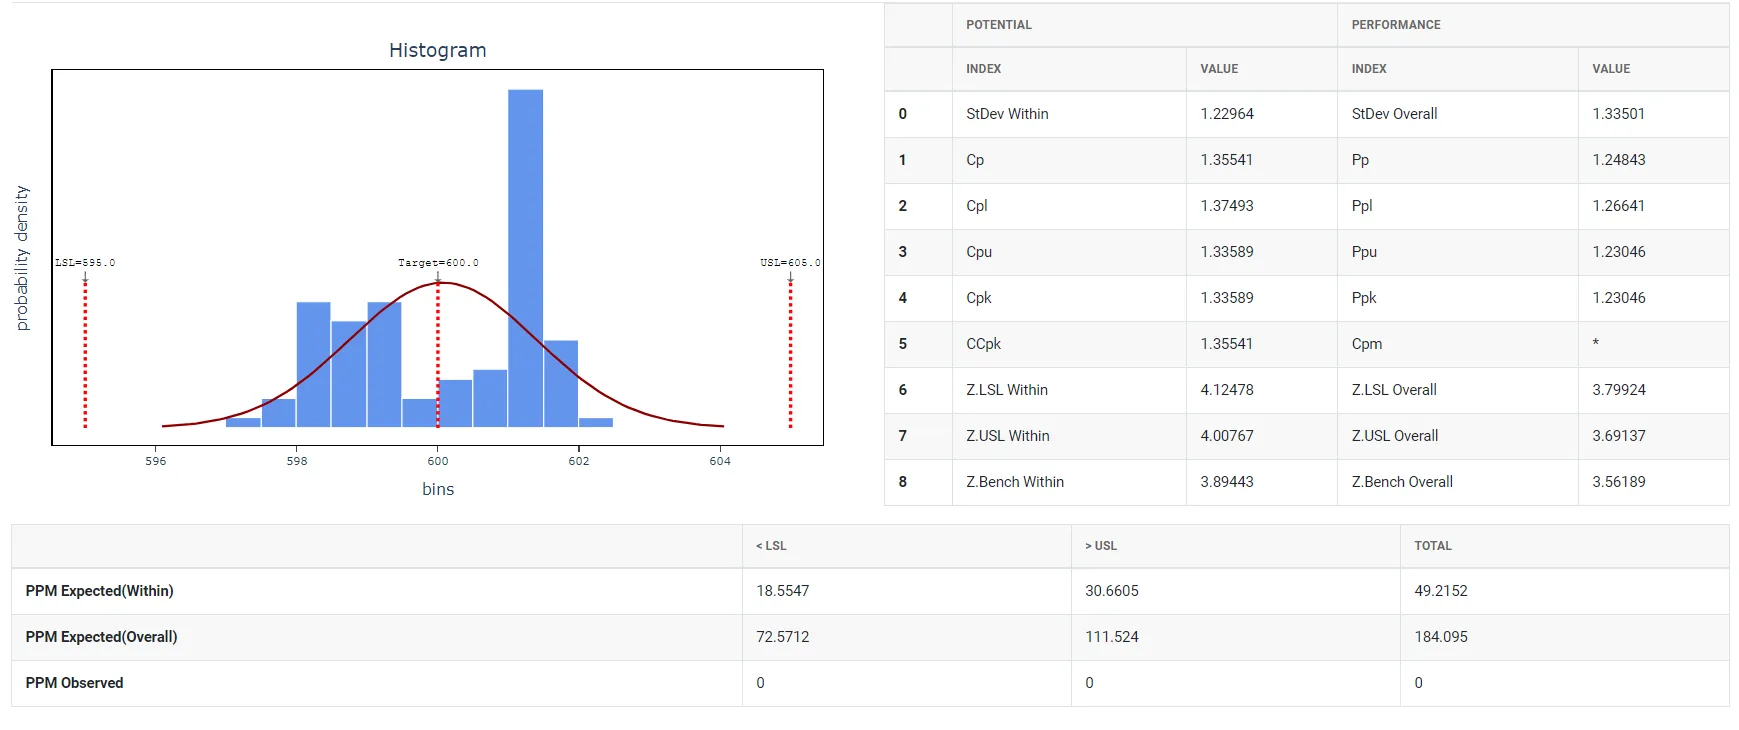
Process capability is a statistical measure of a manufacturing process's ability to produce parts that meet predefined specifications or tolerances. It quantifies the inherent variability of a process characteristic, such as dimensions or weight, to determine how consistently the process can produce within the specified limits. Essentially, process capability assesses the natural variation in a process to evaluate whether it is stable and capable of producing products that adhere to design criteria consistently. The capability indices Cpk, Ppk, and Cpm are all greater than 1.33, which is a generally accepted minimum value for a capable process. This measure is vital for ensuring product quality and for identifying opportunities for process improvements.
- Potential Capability (Cp): This metric compares the width of the process variation to the width of the specification limits, assuming the process is centered within these limits. It provides a best-case scenario of process capability.
- Actual Capability (Cpk): This metric considers the actual performance of the process, including any deviation from the target specification. It accounts for both the process spread and the mean shift, providing a realistic measure of how well the process meets specifications during production.
- Sigma (σ): Often used with attribute data, sigma is a capability estimate expressed in terms of defect rates. It indicates the number of standard deviations between the process mean and the nearest specification limit. A higher sigma value denotes a lower defect rate and higher process capability.
- Process Performance Indices (Pp and Ppk): Similar to Cp and Cpk, these indices measure process capability over a short-term period. Pp assesses the overall capability of a process, while Ppk considers the mean shift during the evaluated period.
When to use Process Capability?
Here are some scenarios where process capability analysis is commonly employed:
- Quality control: Process capability analysis is widely used in manufacturing industries to evaluate the capability of a production process to meet customer requirements. It helps identify whether the process is capable of producing products within the specified tolerances.
- Process improvement: Process capability analysis can be employed to identify areas for improvement in a process. By understanding the current capability of a process, organizations can target improvements to reduce variability and enhance the process's ability to meet customer needs.
- New product development: When introducing a new product or process, process capability analysis can provide insights into the process's performance and help determine if it meets the required specifications. It allows organizations to identify potential issues early on and make necessary adjustments before full-scale production.
- Supplier evaluation: Process capability analysis can be utilized to evaluate the capability of suppliers in meeting specified requirements. By assessing the capability of their processes, organizations can make informed decisions when selecting or evaluating suppliers.
- Six Sigma projects: Process capability analysis is an integral part of Six Sigma methodology. It helps measure the initial process capability, establish baseline performance, and assess the effectiveness of process improvement efforts.
Guidelines for correct usage of Process Capability (Normal Distribution)
- Use Continuous Data: Continuous data can take any numeric value within a range, including fractions or decimals.
- Use Appropriate Analysis for Attribute Data: For defect counts, use Binomial Capability Analysis or Poisson Capability Analysis.
- Collect Sufficient Data: Aim to collect at least 100 data points, such as 25 subgroups of size 4, or 35 subgroups of size 3.
- Collect Data in Rational Subgroups: Ensure subgroups are small samples of similar items produced over a short time under consistent conditions.
- Ensure Process Stability: The process must be stable and in control; use Xbar-S Chart or Normal Capability Sixpack to assess stability.
- Ensure Data Normality: Data should follow a normal distribution; if not, use Box-Cox or Johnson transformation, or consider Nonnormal Capability Analysis.
Alternatives: When not to use Process Capability (Normal Distribution)
- If you do not know whether your process data are in control or whether they can be evaluated using a normal distribution, use Normal Capability Six pack to assess these assumptions before you use this analysis.
- If your data are non-normal and you want to evaluate process capability by fitting a non-normal distribution, rather than by transforming your data, use Non normal Capability Analysis.
- If you have attribute data, such as counts of defectives or defects, use Binomial Capability Analysis or Poisson Capability Analysis.
Example of Process Capability (Normal Distribution)?
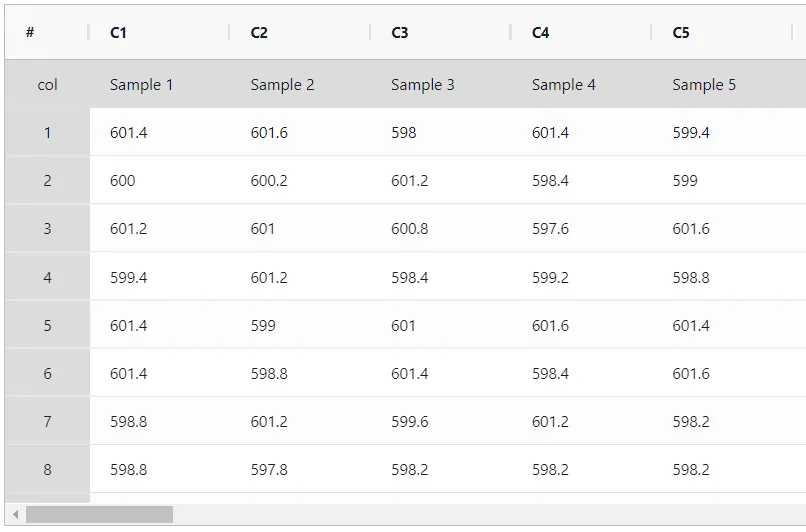
A quality engineer at an automotive parts plant monitors the lengths of camshafts. The engineer collects data in subgroup sizes of 5 every 30 minutes from one of the machines. The specification limits for camshaft length are set with a Lower Specification Limit (LSL) of 595 mm, a Target of 600 mm, and an Upper Specification Limit (USL) of 605 mm. The engineer uses normal capability analysis to evaluate how the lengths of the camshafts compare to the specified limits. The following steps:
- Gathered the necessary data.
- Now analyses the data with the help of https://qtools.zometric.com/ or https://intelliqs.zometric.com/.
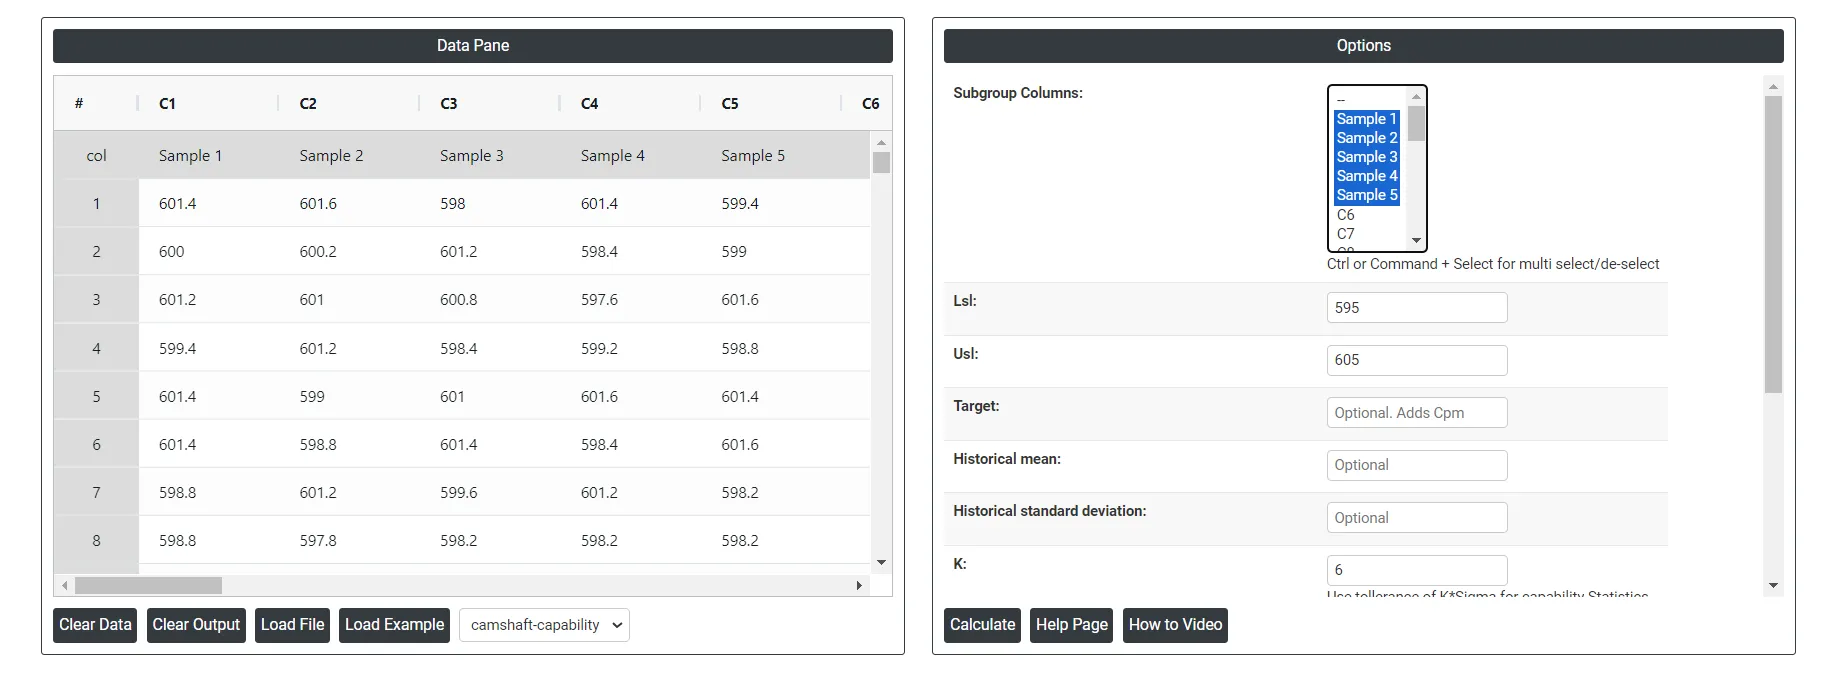
- To find Process Capability choose https://intelliqs.zometric.com/> Statistical module> Graphical analysis>Process Capability.
- Inside the tool, feeds the data along with other inputs as follows:
5. After using the above mentioned tool, fetches the output as follows:
How to do Process Capability .
The guide is as follows:
- Login in to QTools account with the help of https://qtools.zometric.com/ or https://intelliqs.zometric.com/
- On the home page, choose Statistical Tool> Graphical analysis >Process Capability .
- Click on Process Capability and reach the dashboard.
- Next, update the data manually or can completely copy (Ctrl+C) the data from excel sheet and paste (Ctrl+V) it here.
- Next, you need to fill the desired details such as lsl, usl, target, K, etc.
- Finally, click on calculate at the bottom of the page and you will get desired results.
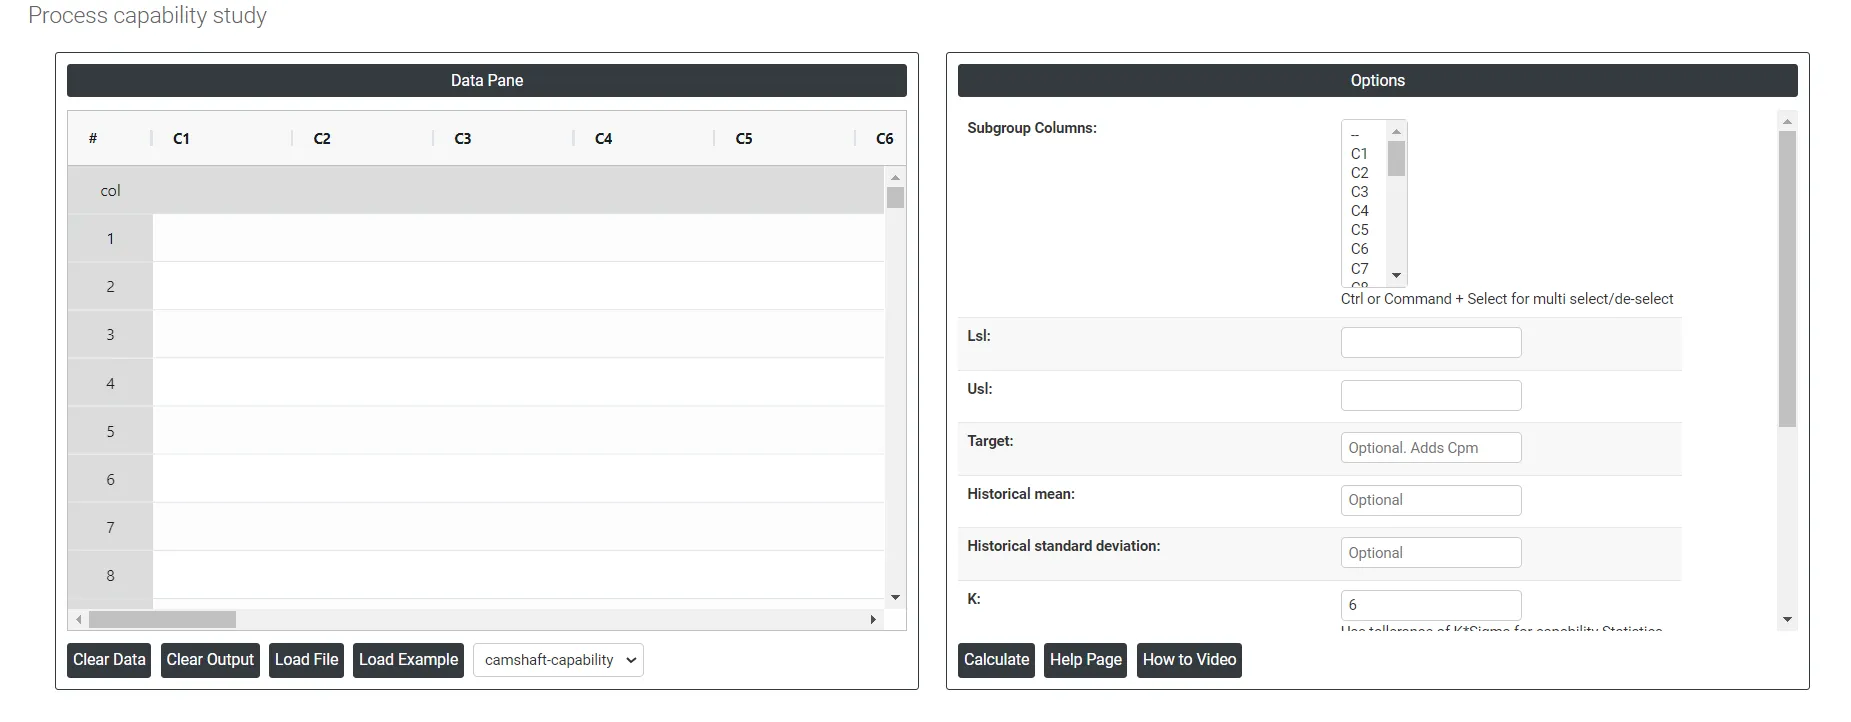
On the dashboard of Process Capability , the window is separated into two parts.
On the left part, Data Pane is present. In the Data Pane, each row makes one subgroup. Data can be fed manually or the one can completely copy (Ctrl+C) the data from excel sheet and paste (Ctrl+V) it here.
Load example: Sample data will be loaded.
Load File: It is used to directly load the excel data.
On the right part, there are many options present as follows:
- Lsl: LSL in process capability refers to the Lower Specification Limit. It is the lower boundary or threshold set for a specific process parameter or characteristic. In process capability analysis, LSL is used to determine whether a process is capable of producing outputs within the desired range or specifications.
- Usl: USL in process capability refers to the Upper Specification Limit. It represents the upper boundary or threshold set for a specific process parameter or characteristic. During process capability analysis, the USL is used to assess whether a process is capable of producing outputs within the desired range or specifications.
- Target: In process capability, the target refers to the desired or ideal value for a specific process parameter or characteristic. It represents the value that the process is intended to achieve or center around. The target is often based on design specifications or customer requirements.
- Historical Mean: The historical mean in process capability refers to the average or central tendency of a process parameter or characteristic based on past or historical data. It represents the typical or expected value that the process has demonstrated over a period of time.
- Historical Standard Deviation: The historical standard deviation in process capability refers to the measure of the dispersion or variability of a process parameter or characteristic based on past or historical data. It quantifies how much the data points deviate from the historical mean or central tendency.
- K: In process capability, K refers to the process capability index known as the "Process Capability Index for Non-Centered Distribution" or simply the K-index. It is used to evaluate the capability of a process in relation to the specification limits.
- Within Stdev estimation method:
- Pooled: The pooled standard deviation is the weighted average of subgroup variances, with larger subgroups having a greater impact on the overall estimate. This method offers a more accurate estimate of the standard deviation when the process is stable.
- Rbar: Rbar represents the average of the ranges within subgroups. The Rbar method is a widely used estimate of the standard deviation, particularly effective for subgroup sizes ranging from 2 to 8.
- Sbar:It calculates the average standard deviation (Sbar) of subgroups to monitor process variability. Sbar is crucial for setting control limits on the S chart, indicating changes in data dispersion over time. This method ensures consistent and accurate assessment of process variation in quality control practices.
- Within stdev estimation method for subgroup size = 1:
- Average Moving Range: The average moving range is the mean value of the range of two or more consecutive points, typically used when the subgroup size is 1.
- Median Moving Range: The median moving range is the middle value of the range of two or more consecutive points, recommended when data have extreme ranges that could skew the moving range.
- Square root of MSSD: The square root of MSSD (Mean of Squared Successive Differences) is the square root of the average of the squared differences between consecutive points, useful when consecutive points are not collected under similar conditions.
- Moving range of length: Specify the number of observations used to compute the moving range, with the length being ≤ 100. The default length is 2, as consecutive values are most likely to be similar.
- Use Unbiasing Constants: Apply unbiasing constants in estimating the within-subgroup standard deviation, relevant for the Sbar, pooled standard deviation, and square root of MSSD methods.
- Use Unbiasing Constants to Calculate Overall Standard Deviation: Apply unbiasing constants in estimating the overall standard deviation.
- Download as Excel: This will display the result in an Excel format, which can be easily edited and reloaded for calculations using the load file option.