What is Random Exponential Data?
Random Exponential Data generates values from the exponential distribution, which models the time between consecutive independent events such as time between machine failures, customer arrivals, or service completions. You specify the mean (average time between events), and the tool generates random inter-event durations.
Simple Definitions: Generates random waiting times between events widely used in reliability engineering and queuing analysis to simulate how long until the next failure or arrival occurs.
When to use Random Exponential Data?
- Use to simulate time between failures, arrivals, or service completions.
- Use for testing reliability analyses that assume a constant failure rate (exponential failure model).
Guidelines for correct usage of Random Exponential Data
- The exponential distribution assumes a constant failure rate (memoryless property) if failure rate changes over time, use Weibull instead.
- All generated values are strictly positive.
- Set the mean equal to the known average time between events from historical data.
Alternatives: When not to use Random Exponential Data
- If the failure rate changes over time, use Random Weibull Data
- For skewed positive continuous measurements (not time-based), use Random Lognormal Data
Example of Random Exponential Data
The following steps to Generate Random Exponential Data:
- To Generate Random Exponential Data need to fill the required options.
- Now analyses the data with the help of https://qtools.zometric.com/ or https://intelliqs.zometric.com/.
- To find Random Exponential Data choose https://intelliqs.zometric.com/> Statistical module> Random Data > Random Exponential Data
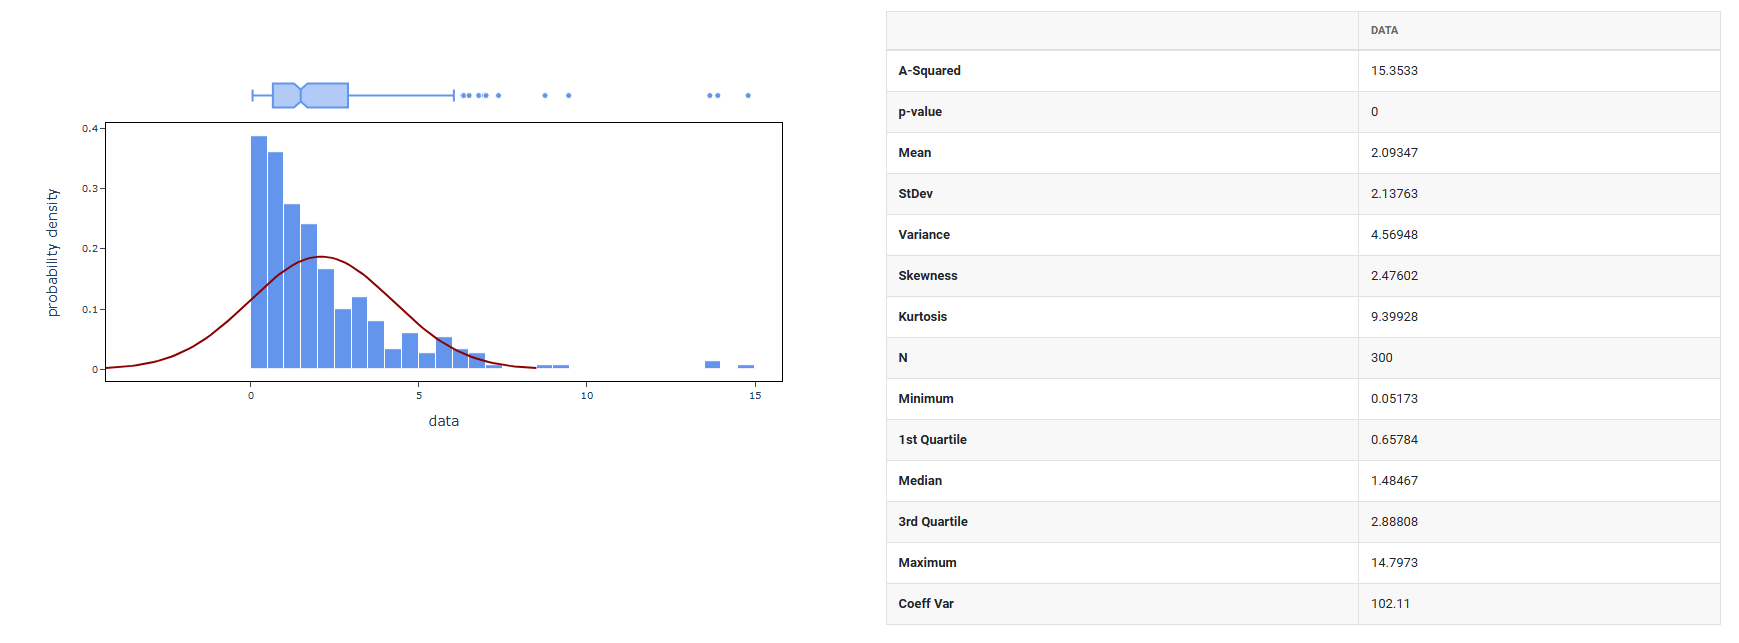
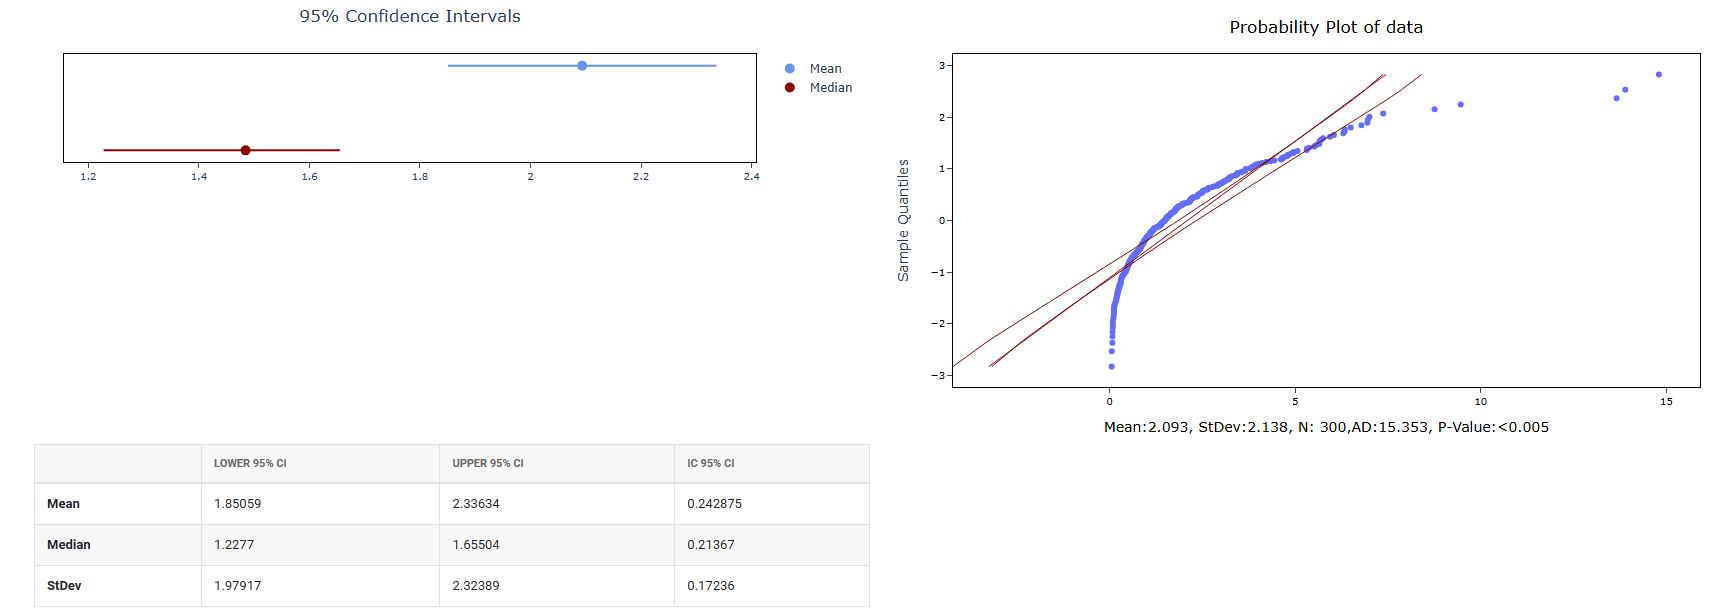
4. After using the above mentioned tool, fetches the output as follows:
How to do Random Exponential Data
The guide is as follows:
- Login in to QTools account with the help of https://qtools.zometric.com/ or https://intelliqs.zometric.com/
- On the home page, choose Statistical Tool> Random Data>Random Exponential Data.
- Next, you need to fill the required options.
- Finally, click on calculate at the bottom of the page and you will get desired results.
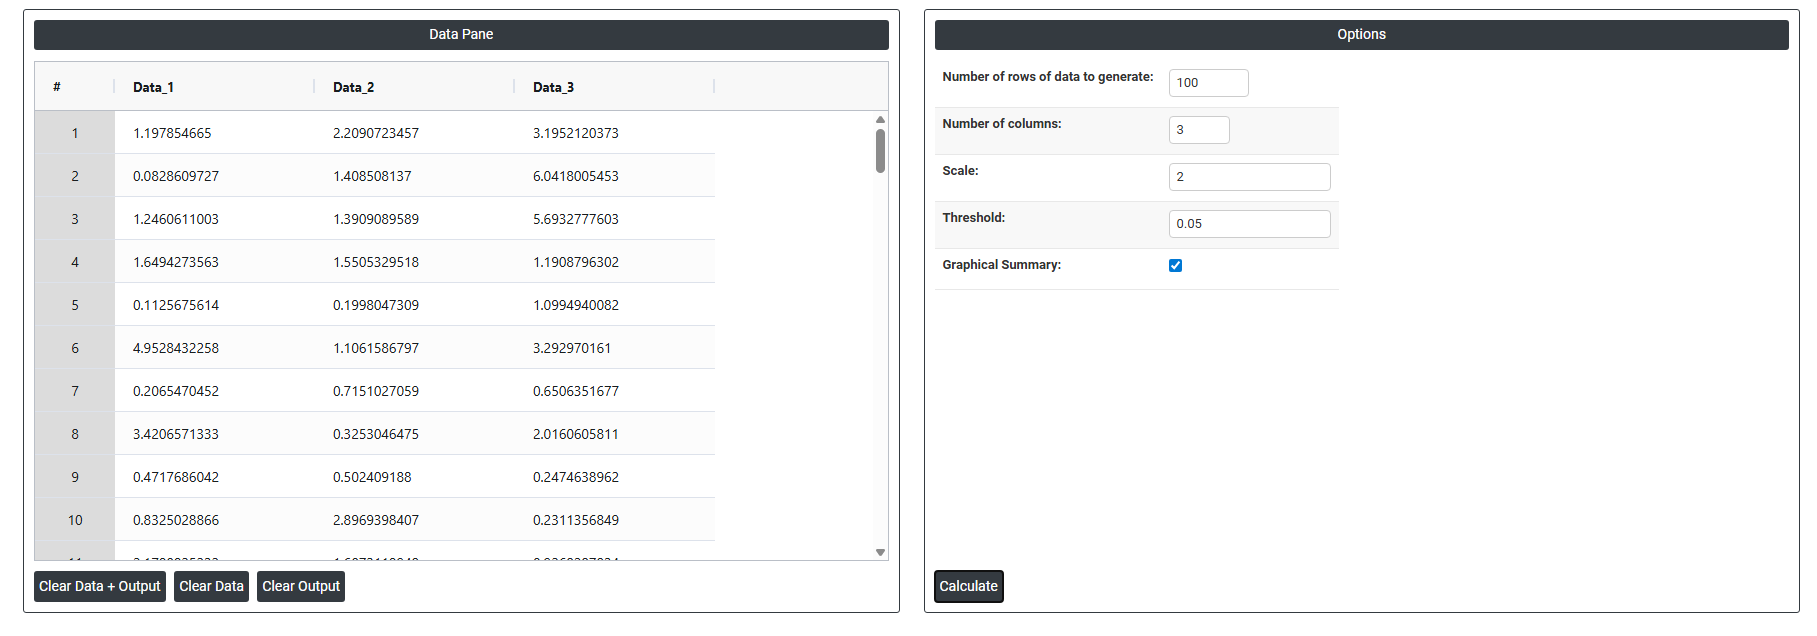
On the dashboard of Random Exponential Data, the window is separated into two parts.
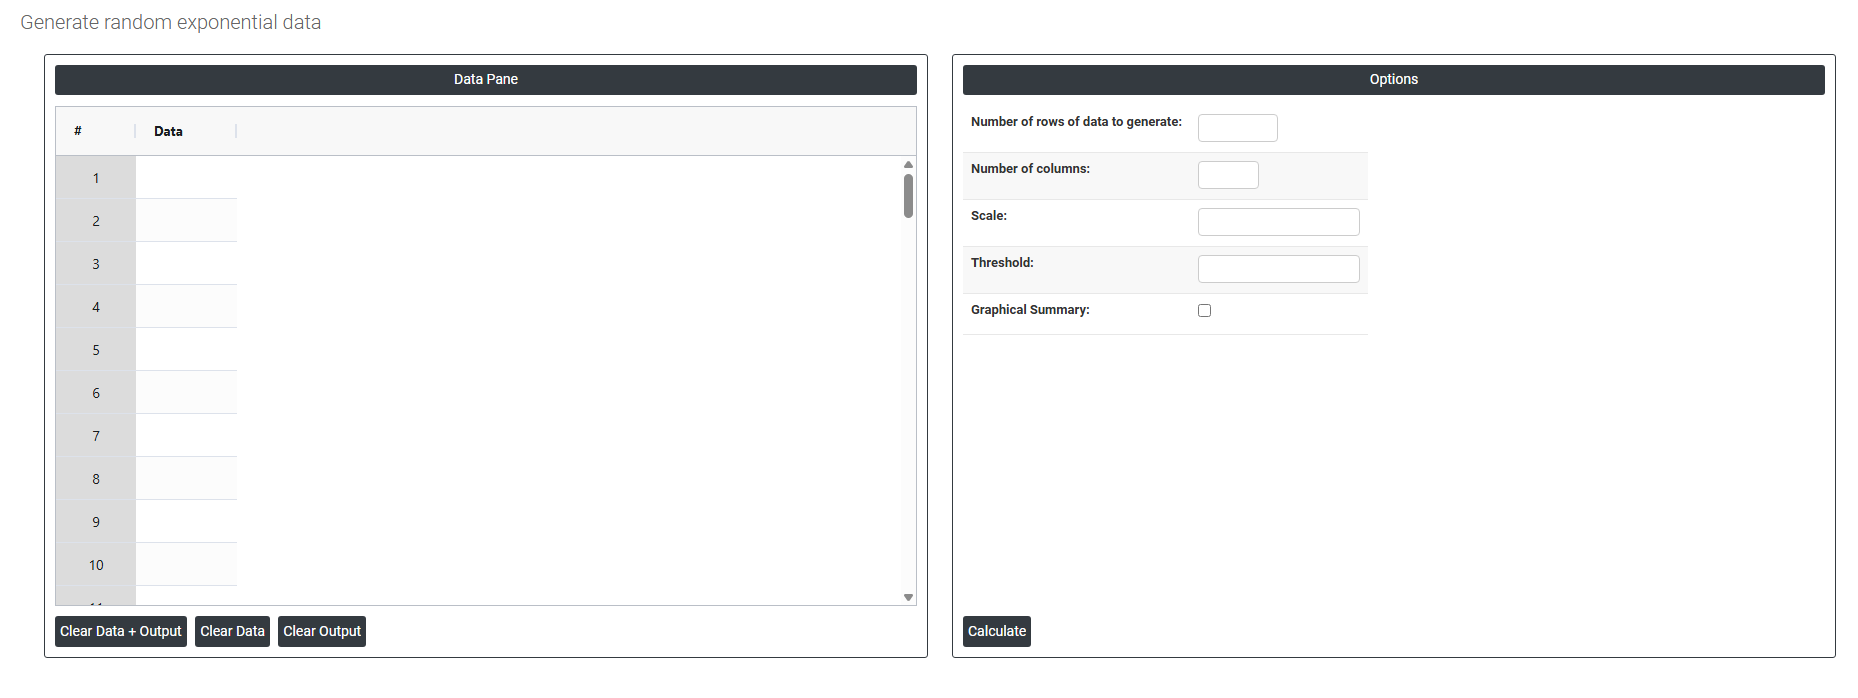
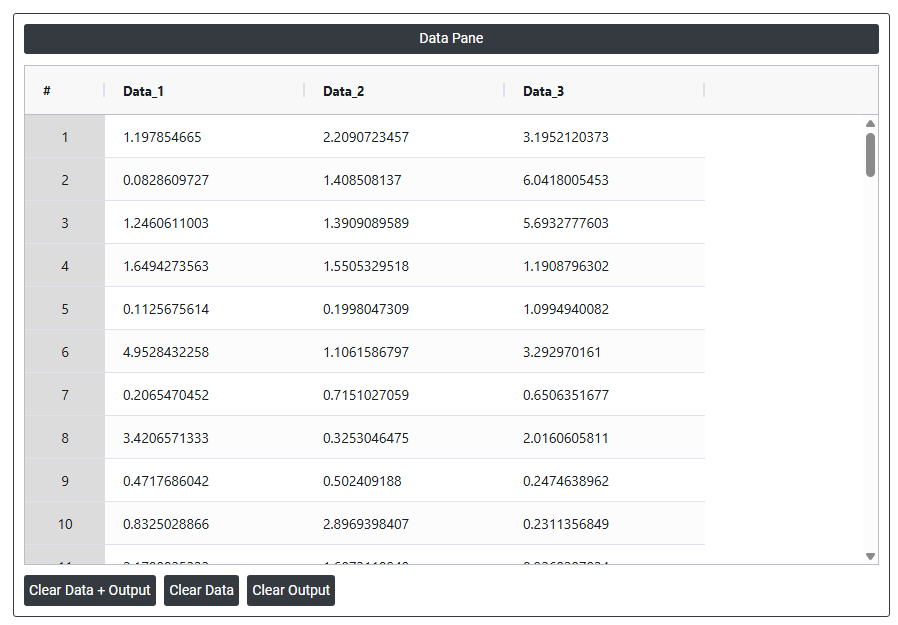
On the left part, Data Pane is present. In the Data Pane, each row makes random data generated. Data will be generated after filling the required options.
On the right part, there are many options present as follows:
- Number of rows of data to generate: Specifies how many random data points to generate. For example, entering 10 will produce exactly 10 rows of random values, all visible in the data pane.
- Number of columns: Specifies how many variables (columns) each row will have. For example, entering 3 will produce 3 columns of randomly generated data side by side in the data pane.
- Scale: Determines the average rate or spread of the exponential distribution used to generate the random data. A larger scale value produces bigger, more spread out numbers; a smaller scale value produces values that cluster closer to zero. All generated data points in the data pane will reflect this spread.
- Threshold: Sets a minimum starting point for the generated data. Instead of the values beginning from zero, the generated numbers will be shifted upward by this amount. For example, setting a threshold of 10 means all generated values will start from 10 and go upward, rather than from 0.
- Graphical summary: After the random data is generated using the mean and standard deviation you specified, this option produces a graphical analysis of that data such as a histogram showing how the generated values are distributed. It is a visual result based on the data that was just created.