What is Random T Data?
Random T Data generates values from the t-distribution a symmetric, bell-shaped distribution similar to the normal distribution but with heavier tails, controlled by a degrees of freedom parameter. As degrees of freedom increase, the t-distribution converges to the standard normal. It is widely used for simulating t-test statistics and modelling uncertainty in small-sample studies.
Simple Definitions:Generates random values from the t-distribution a bell curve with heavier tails than normal, ideal for small-sample simulations and validating t-tests.
When to use Random T Data?
- Use to validate t-tests and confidence interval calculations with known distributional properties.
- Use for power analysis simulations to determine adequate sample sizes for t-test studies.
- Use in educational demonstrations of how the t-distribution approaches normality as sample size grows.
Guidelines for correct usage of Random T Data
- Set degrees of freedom based on your study sample size (typically n − 1).
- For large degrees of freedom (> 30), the t-distribution is nearly identical to the normal distribution.
Alternatives: When not to use Random T Data
- For large-sample simulations where normality is appropriate, use Random Normal Data
- For variance comparison simulations, use Random F Data
Example of Random T Data
The following steps to Generate Random T Data:
- To Generate Random T Data need to fill the required options.
- Now analyses the data with the help of https://qtools.zometric.com/ or https://intelliqs.zometric.com/.
- To find Random T Data choose https://intelliqs.zometric.com/> Statistical module> Random Data > Random T Data
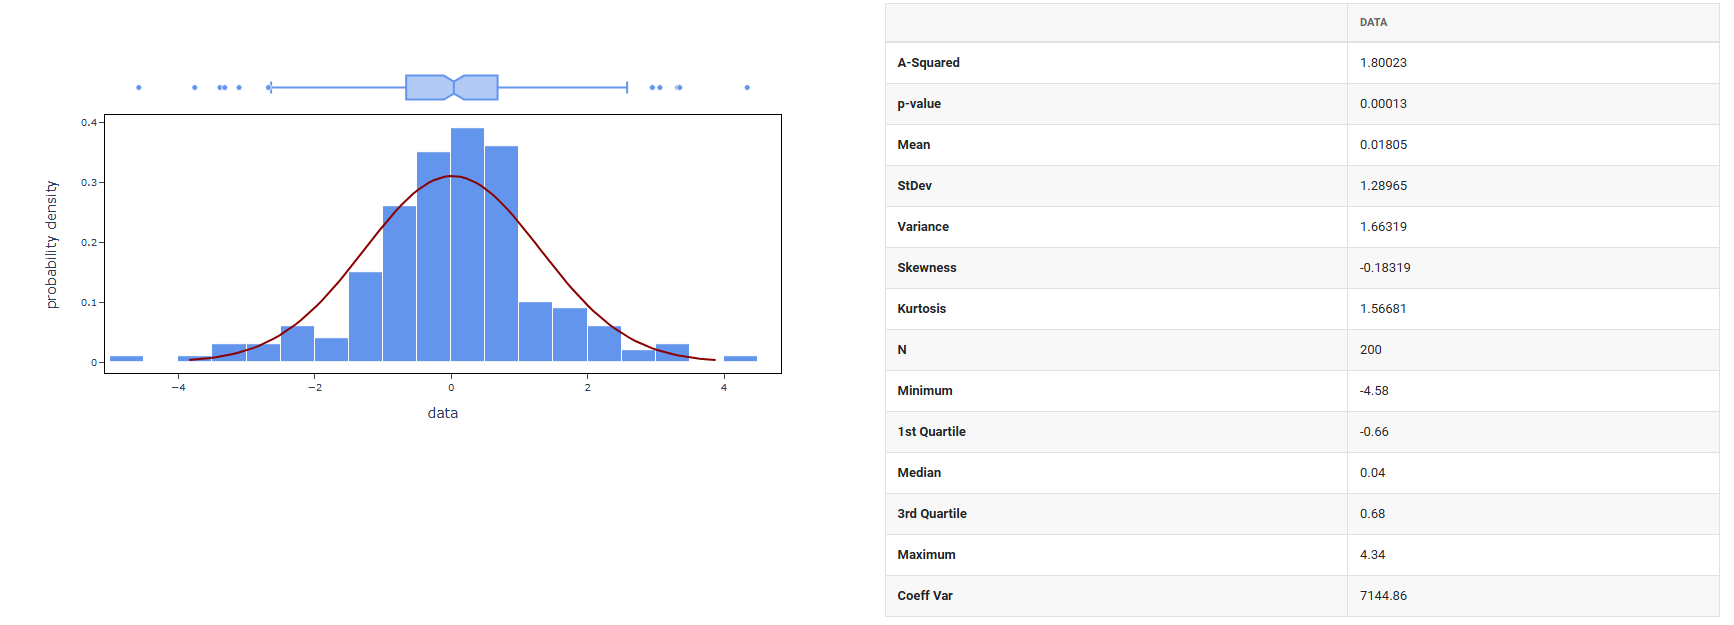
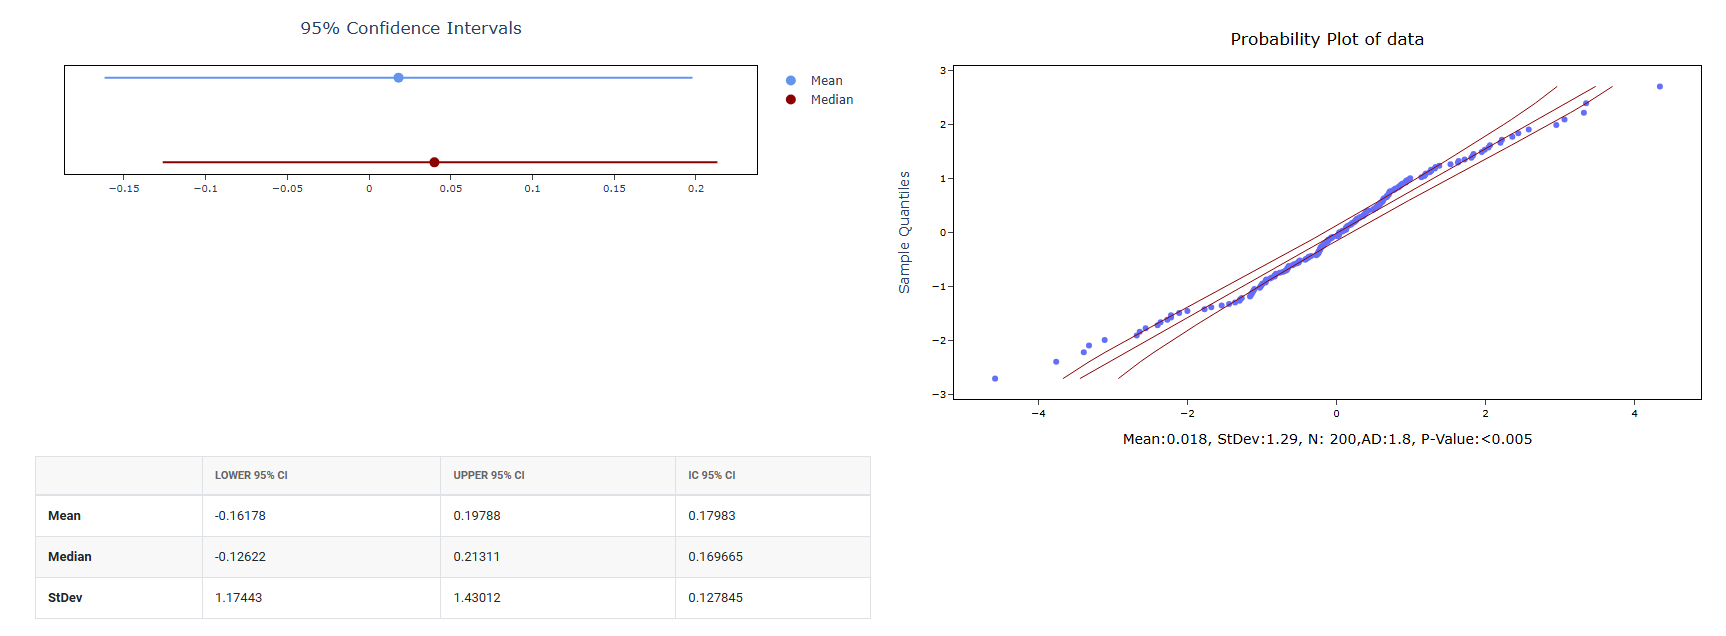
4. After using the above mentioned tool, fetches the output as follows:
How to do Random T Data
The guide is as follows:
- Login in to QTools account with the help of https://qtools.zometric.com/ or https://intelliqs.zometric.com/
- On the home page, choose Statistical Tool> Random Data>Random T Data.
- Next, you need to fill the required options.
- Finally, click on calculate at the bottom of the page and you will get desired results.
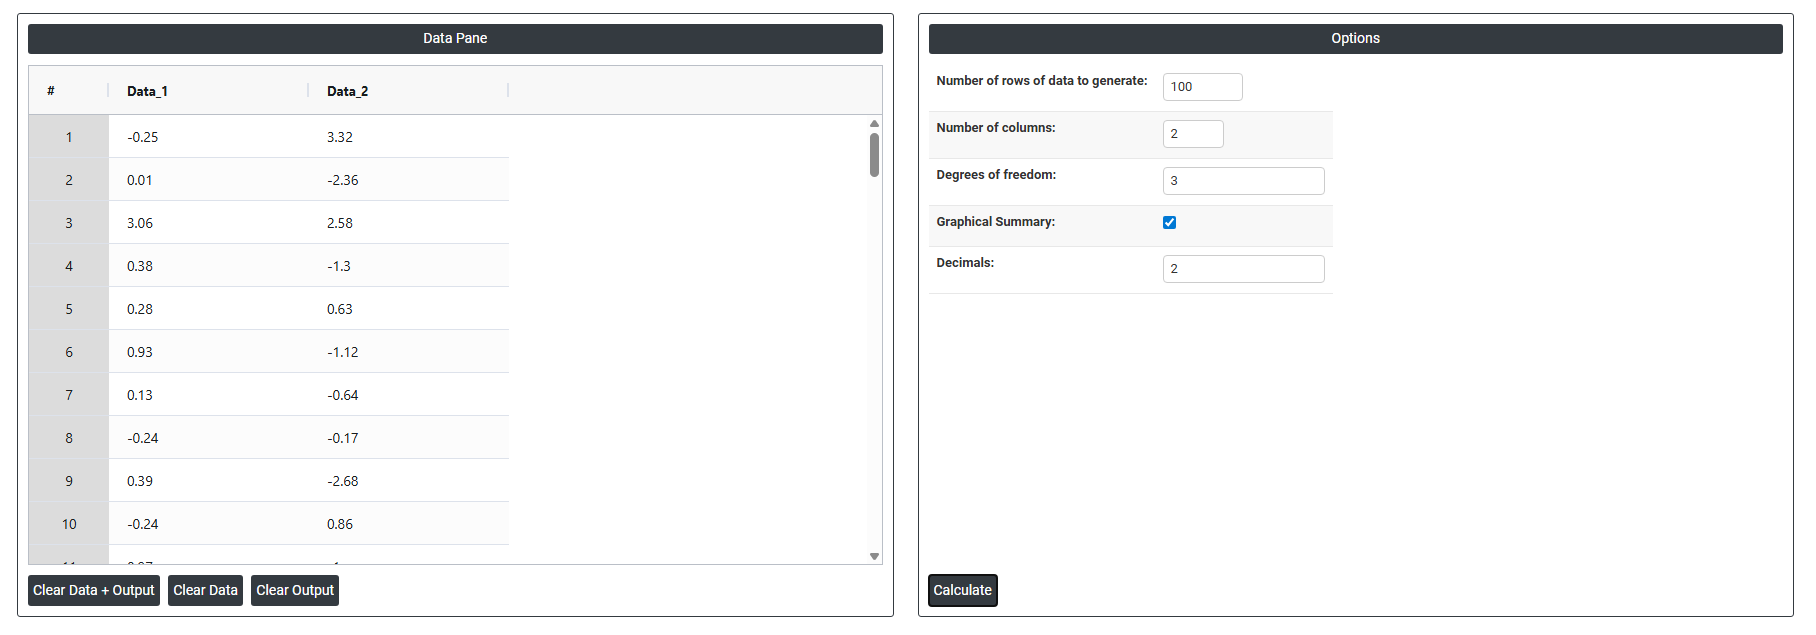
On the dashboard of Random T Data, the window is separated into two parts.
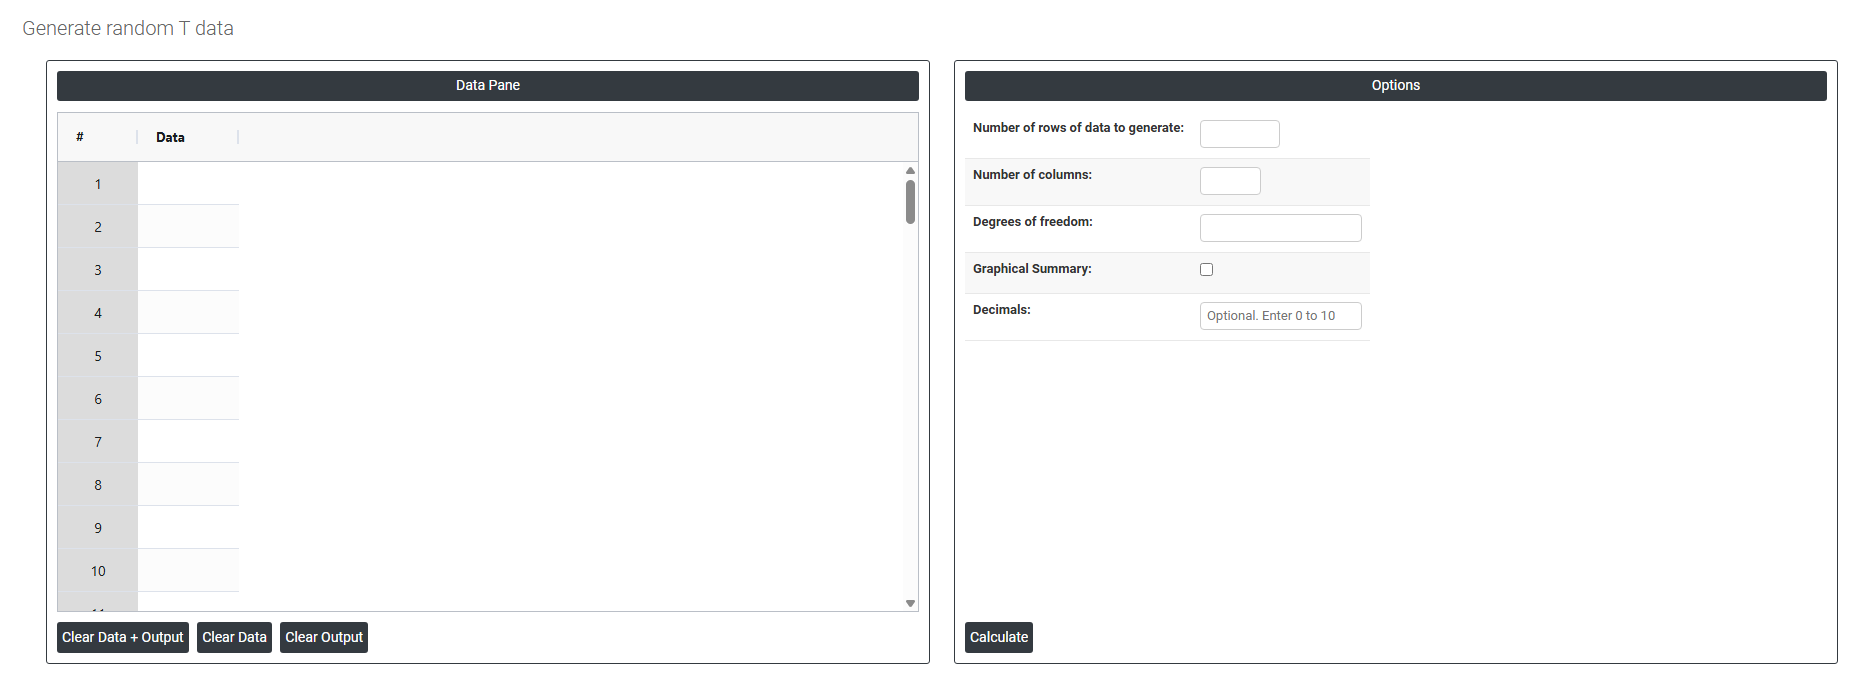
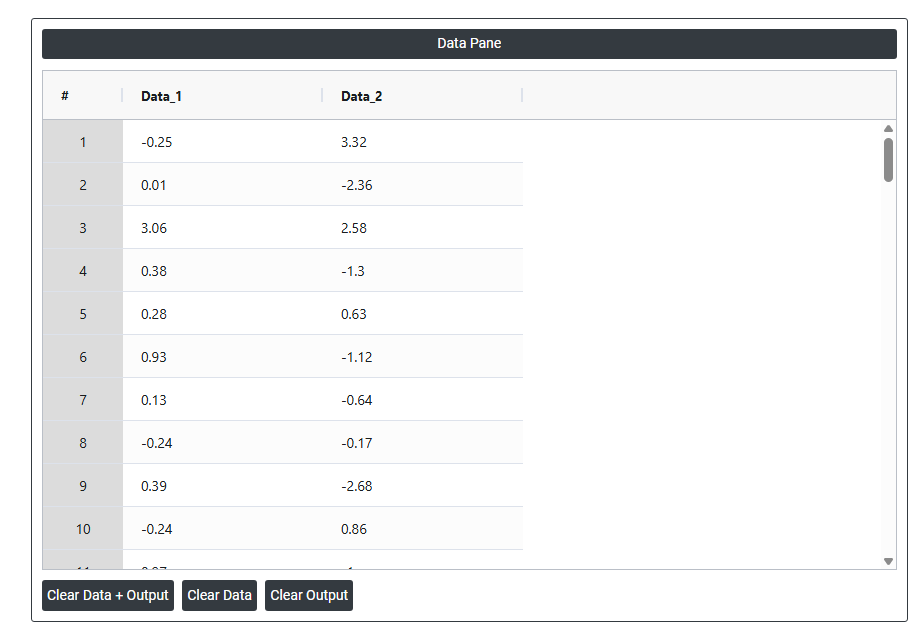
On the left part, Data Pane is present. In the Data Pane, each row makes random data generated. Data will be generated after filling the required options.
On the right part, there are many options present as follows:
- Number of rows of data to generate: Specifies how many random data points to generate. For example, entering 10 will produce exactly 10 rows of random values, all visible in the data pane.
- Number of columns: Specifies how many variables (columns) each row will have. For example, entering 3 will produce 3 columns of randomly generated data side by side in the data pane.
- Degrees of freedom: Determines the shape of the T distribution used to generate the random data. With a low degrees of freedom (such as 1 or 2), the distribution has heavier tails, meaning more extreme values will appear in the generated data. As the degrees of freedom increases, the T distribution gradually approaches the shape of a normal distribution. For example, entering 30 will generate random data from a T distribution with 30 degrees of freedom, producing values that closely resemble normally distributed data.
- Graphical summary: After the random data is generated using the mean and standard deviation you specified, this option produces a graphical analysis of that data such as a histogram showing how the generated values are distributed. It is a visual result based on the data that was just created.
- Decimals: Controls the number of decimal places in the generated random values themselves. For example, setting it to 2 means every generated number will be rounded to 2 decimal places, like 47.83 or 52.16. Setting it to 0 produces whole numbers only.